Official Trump [$TRUMP] was highlighted as a weekly loser in a recent AMBCrypto report after the memecoin closed the weekly trading session 5% in the red. Since Sunday’s daily close, $TRUMP has fallen a further 12.8%.
There were bearish drivers behind the losses.
One of them was the relatively weak sentiment around altcoins over the past two weeks, although some memecoins have posted positive returns over a fortnight.
Another driver was the wipeout of long liquidations, and the market sell orders from these liquidations forced prices even lower.
$TRUMP falls below a key Fibonacci extension level
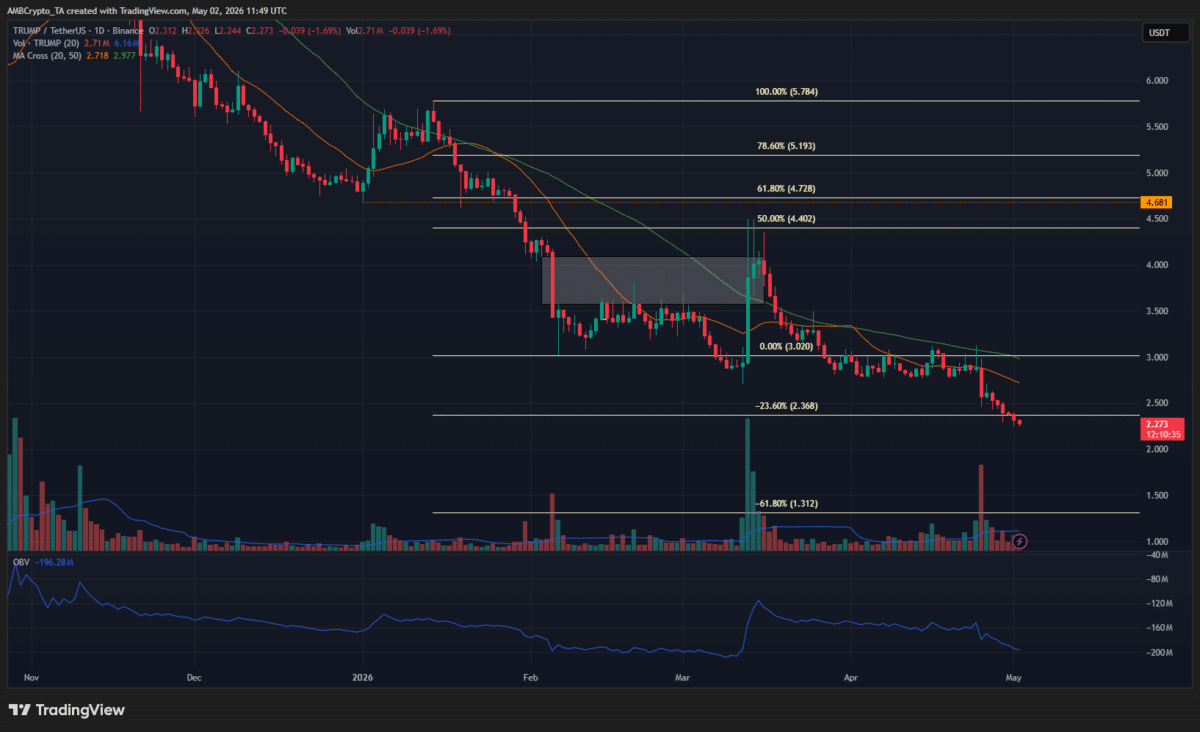
Using the bearish swing move earlier in 2026 from $5.78 to $3.02, a set of Fibonacci retracement levels was plotted. The $4 area was also highlighted as a fair value gap (white box) on this timeframe.
It was expected that the $TRUMP token would have enough in the tank to bounce as high as the $4.72 and $5.19 resistance levels. Instead, the 50% Fibonacci retracement level at $4.4 was enough to send prices careening southward.
In the past couple of days, the memecoin has closed a daily trading session below the 23.6% extension level at $2.36. It acted as a support, briefly, on the 29th and 30th of April.
The moving averages indicated bearish momentum, the OBV was sliding lower to signal steady selling pressure, and the extension level at $2.36 has been ceded to the bears.
It looked likely that the price would proceed to the $1.31 support in the coming weeks.
Traders’ call to action- Sell
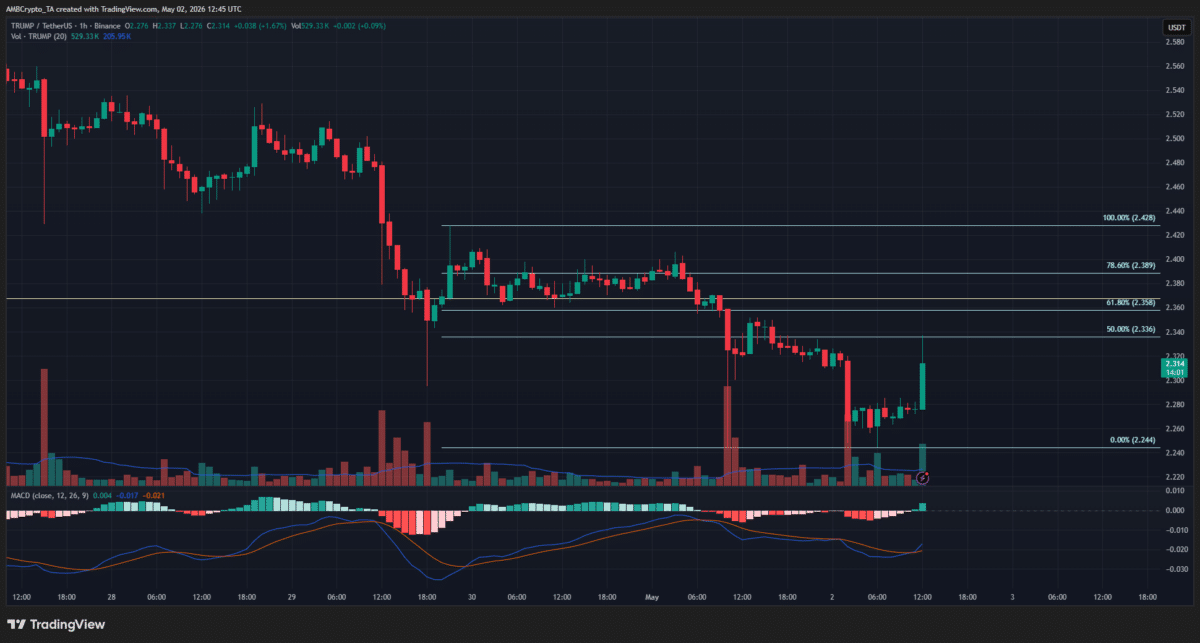
The 1-day and 4-hour charts have a bearish bias, so we looked at the 1-hour chart to see if any feasible trading opportunities were present. One selling opportunity was immediately visible.
Using the 1-hour timeframe’s swing move down from $2.42 to $2.24, another set of Fibonacci retracement levels was plotted. This showed that the price has tested and temporarily been rejected from the 50% level at $2.33.
This was similar to what we have seen on the 1-day timeframe from mid-April, so it is already a selling opportunity. Traders can set their stop loss above $2.42, as a $TRUMP rally above this swing high would invalidate the idea.
At the same time, some patience could be rewarded. A bounce toward the $2.35-$2.39 golden pocket was still possible and would offer a better risk-to-reward trade.
Final Summary
- Official Trump has a bearish bias across timeframes and could sink toward $1.31 in the coming months.
- In the short-term, traders can use a bounce toward $2.35-$2.39 to sell the memecoin.