On Wall Street, "TACO trading" is outdated, and now people are starting to discuss a new trading model—"NACHO".
Since the US-Israeli airstrikes on Iran on February 28, the Strait of Hormuz has remained closed. Oil prices are now more than 50% higher than pre-war levels, and the expectation of a Federal Reserve rate cut in 2026 has been reduced from two to zero. However, at the same time, the S&P 500 has hit a record high, rising for six consecutive weeks, its longest winning streak since 2024.
Wall Street has given this seemingly paradoxical market situation a name: NACHO, short for "Not A Chance Hormuz Opens," meaning there's absolutely no possibility of the Strait of Hormuz reopening. It's the opposite of TACO (Trump Always Chickens Out). TACO bets that "people will back down," that Trump will back down at crucial moments. NACHO bets that "things will stagnate," and that the Strait of Hormuz won't be reopened this time with a single Truth Social post.
eToro market analyst Zavier Wong described the shift this way: "For most of the crisis, every ceasefire headline triggered a sharp drop in oil prices, with traders constantly betting on a solution that would never come. The NACHO signifies that the market acknowledges that high oil prices are not a one-off shock, but rather a reflection of the current market environment itself."
Two broken lines in early April
March 23rd marked the tipping point for the TACO model to fail. That morning, Trump announced on Truth Social Media that he had had a "very good and constructive conversation" with Iran and ordered the Pentagon to suspend strikes on Iranian energy facilities for five days. S&P 500 futures rebounded nearly 4% from their lows within minutes, instantly adding $1.7 trillion to the market capitalization. Brent crude oil fell from $109 to $92 during the session.
Then Iranian officials denied the existence of the dialogue. According to Iranian state media, a "senior security official" stated that it was a market manipulation tactic and that the dialogue never took place. Gains were halved within two hours, with the S&P 500 closing at only +1.15%, while Brent crude rebounded to $99.94.
That was the first time in 14 months that Trump's "retreat" no longer had any effect on the market. The reason is not complicated: retreat under the TACO model is unilateral; a single post can fulfill its promise. The retreat on March 23 required Iran's cooperation. When the opponent doesn't cooperate, the retreat becomes a lie.
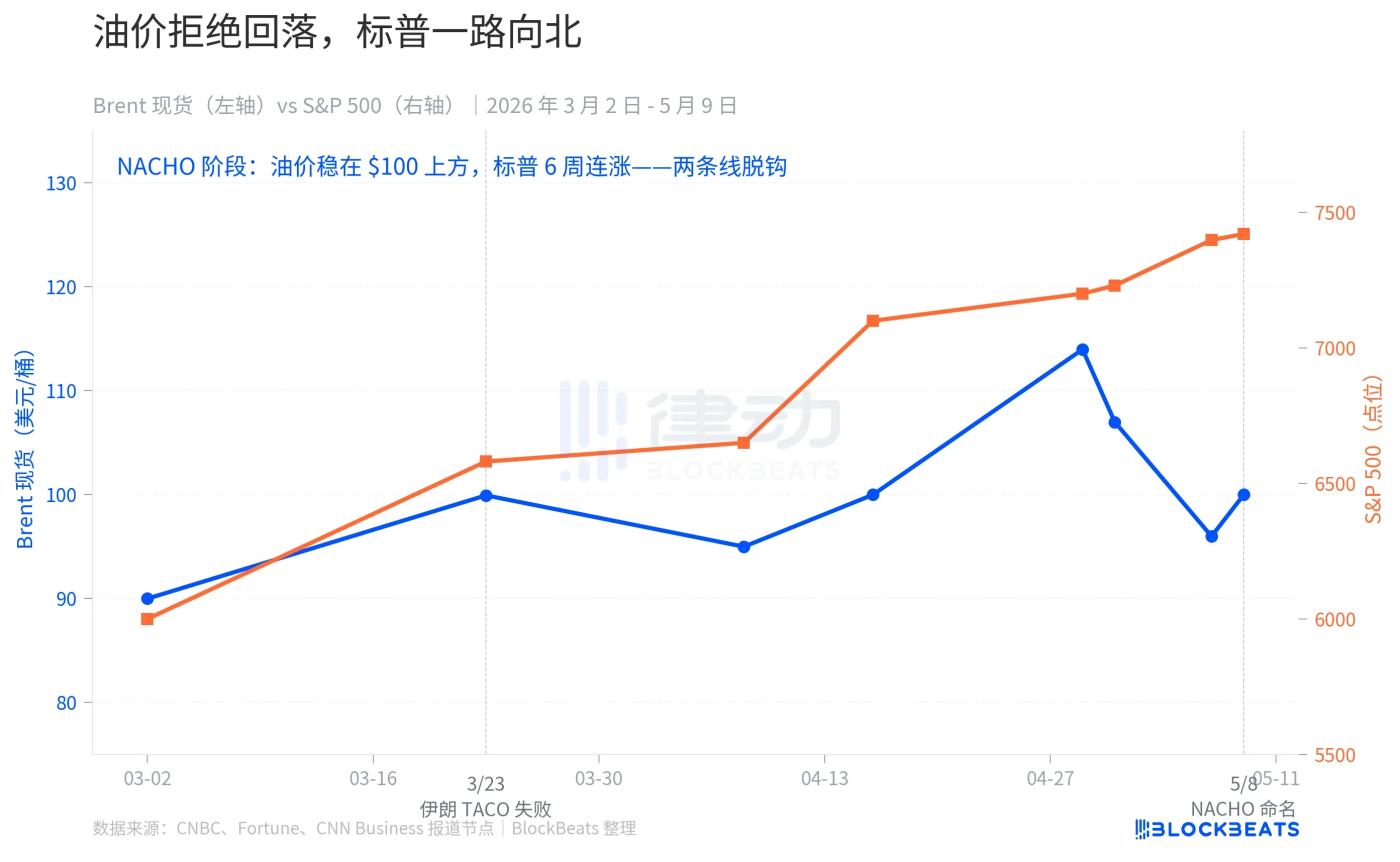
From that day on, market behavior fundamentally changed. Brent crude never fell back to its pre-war level of $67 in the following six weeks, with the May average price remaining at $109.57. During this period, there were the US-Iran ceasefire agreement on April 7th and 8th, oil prices briefly returning to "early war levels" on April 17th, and news of a near-agreement between the US and Iran on May 7th. Each of these "ceasefire headlines" failed to bring oil prices back to their baseline levels.
But the S&P 500 continued its upward trend. April saw a 10% gain, its strongest month since November 2020, during which it hit seven intraday record highs. It broke 7,230 points intraday on May 1st and closed at 7,398 points on May 7th.
The two lines completely decoupled in early April. In the TACO era, they moved in the same direction; when the threat came, oil prices fell and the S&P 500 fell, and when they retreated, oil prices rebounded and the S&P 500 rebounded. In the NACHO era, they expressed two different languages: oil prices were saying "Hormuz is closed to the end," and the S&P 500 was saying "It's none of my business."
Three markets, three reactions
NACHO is not just talk; it's the same bet wagered with real money by three independent derivatives markets.
The first layer is insurance. According to historical data from the Strauss Center, war risk premiums in the Strait of Hormuz once soared to 3.5% of the ship's value during the US invasion of Iraq in 2003, and reached 7.5% at their peak after the attack on the Yanbu Pride oil tanker during the Iran-Iraq War in 1984. The baseline before this crisis was 0.125% to 0.25%. By early May, this rate had reached the 1% range, with some types of insurance soaring to 3% to 8%.
The insurance cost for a single Very Large Crude Carrier (VLCC) transiting the strait has jumped from approximately $250,000 before the war to between $800,000 and $8 million currently. The job of insurance companies is to price risk, and the practical implications of this assumption are that if insurance companies simply refuse to insure, shipowners will not bear the risk of uninsured transit. The "physical openness" of the strait and "de facto navigation" are two different things.
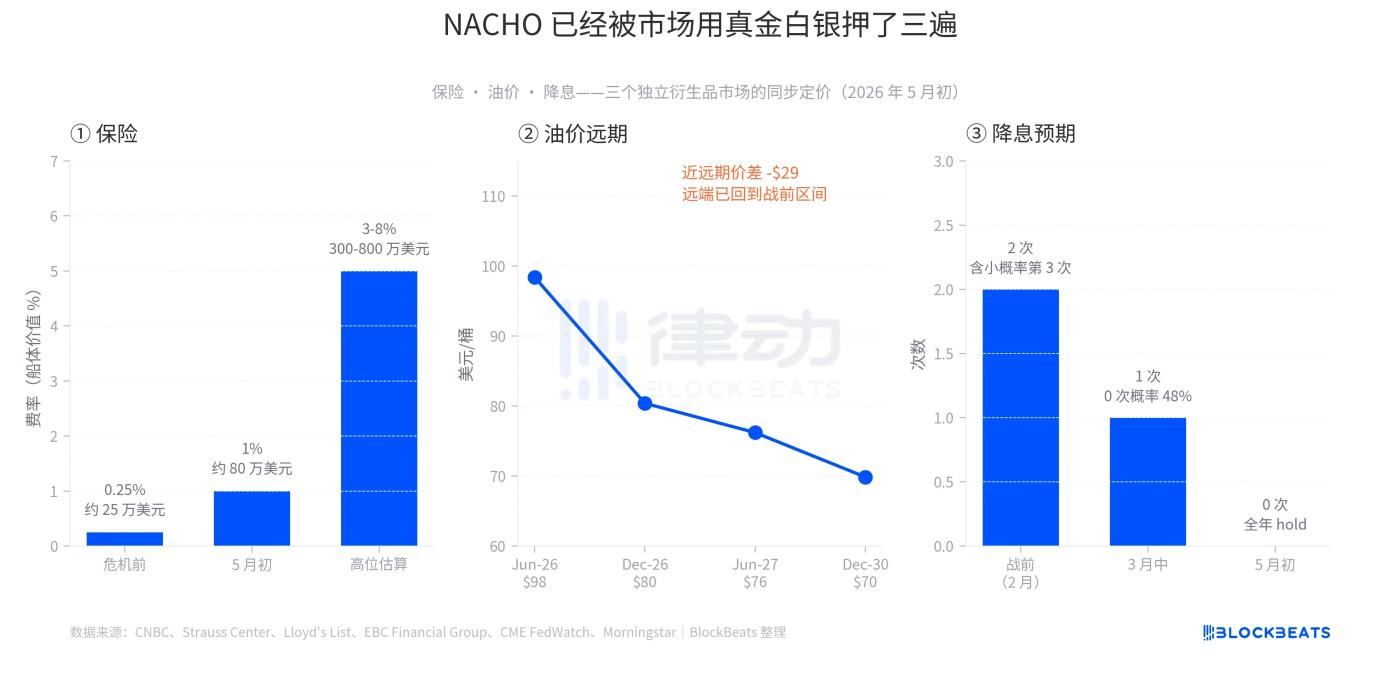
The second layer is oil prices. Early May data showed Brent crude oil futures trading at $98.41 for June 2020, $80.39 for Dec 2020, $76.20 for June 2020, and $69.85 for Dec 30. The spread between the near-month and Dec 30 contracts was approximately $28.50, one of the steepest inverted (near-month high, far-month low) price structures in the past five years. This curve tells a very specific story: the market believes that the spot market is tight but will eventually ease, with far-month prices returning to the pre-war range of $60 to $70. In other words, high oil prices are not the end, but a window with boundaries. However, this window is long enough that traders are not betting on it suddenly ending.
The third layer is interest rate cuts. In early February 2026, the market expected the Federal Reserve to cut rates twice throughout the year, with a small probability of a third. After oil prices surged in mid-March, the probability dropped to one cut, bringing the probability of zero rate cuts to 48%. On April 29, the Fed kept the rate unchanged at 3.50% to 3.75%. On May 6, CME FedWatch showed a 70% probability of holding rates at the June meeting. The market had already priced in zero rate cuts for the entire year of 2026. Hedge fund legend Paul Tudor Jones even said in a CNBC interview on May 7, "Even Warsh wouldn't have had a chance to get the Fed to cut rates."
All three layers have already left their mark on the derivatives market, not just in terms of narrative, but in terms of real money.
The market is divided
The second detail of NACHO that is not easily seen is that it has already differentiated its pricing within the broader market.
As of the closing bell on May 7, the Energy Sector ETF (XLE, State Street's Energy Select Sector Fund) has risen 31.63% year-to-date, making it the only major sector to rise throughout 2026. In comparison, the S&P 500 has risen approximately 24% over the same period. The Transportation Sector ETF (IYT, iShares US Transportation Fund) has only risen 8.79% year-to-date, underperforming the broader market by more than 15 percentage points.
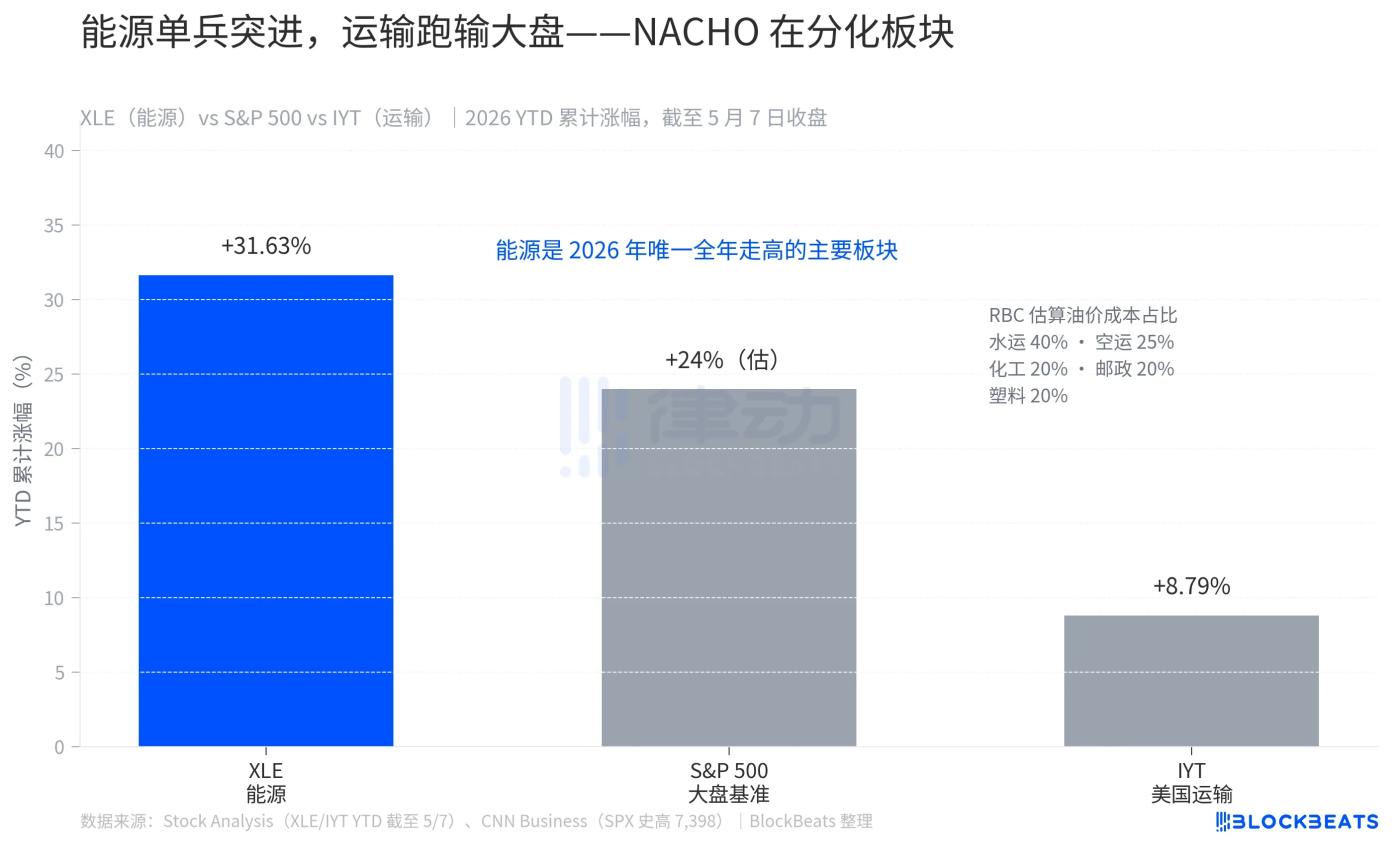
This disparity isn't random. According to estimates from RBC Capital Markets, fuel costs account for 40% of operating costs in the shipping industry, air freight 25%, and chemicals, postal services, and rubber and plastics each 20%. If fuel is a major expense in your business's cost list, NACHO will be hitting you squarely in the face.
XLE's 31.63% gain is not a short-term rebound, but the result of eight consecutive weeks of outperformance. IYT's 8.79% gain is not weakness, but rather a result of rising along with the broader market while having its gains eroded by oil prices. The market has clearly shown readers how NACHO calculates odds; just look at the extent to which the Transportation ETF has underperformed the market.
However, NACHO is not an indefinite bet; it has a very specific deadline: June 1st.
According to estimates from JPMorgan Chase's commodities research team, global commercial crude oil inventories will reach approximately 8.4 billion barrels at the beginning of 2026. However, only about 800 million barrels of this will be "actually usable," with the remainder consisting of pipeline filling, tank bottom storage, and minimum terminal storage—the parts used to maintain the daily operation of the system. Since the start of this crisis, 280 million barrels have been used, leaving approximately 520 million barrels of usable inventory. JPMorgan Chase stated that "commercial inventories are expected to approach operational stress levels by early June."
"Operational stress level" is a concrete physical concept. JPMorgan Chase explains it as, "The system won't collapse because oil disappears, but because the distribution network no longer has enough workload." Once this line is crossed, businesses and governments have only two choices: either maintain the minimum necessary inventory (which will damage the infrastructure itself) or wait for new supply. If the Hormuz trade fair doesn't open by September, OECD commercial inventories could fall to the so-called "operational floor." According to Fortune, European jet fuel inventories are expected to fall below the 23-day supply threshold in June, a critical warning line for the industry.
![]()
The odds in the prediction market are synchronized with the physical clock. According to Polymarket data on May 9, the probability of "normal navigation in the Strait of Hormuz before May 31" is 28%, and the probability before May 15 is only 2%. $9.92 million of active positions in the market are betting that NACHO will not expire until at least May.
The market has stopped trading Trump's next Truth Social post and started trading early June inventory data for the Strait of Hormuz.