Bitcoin (BTC) surged above $81,000 over the weekend, leaving traders cautious as inflation data and political tensions clashed this week. The next technical target lies at $83,400 based on Fibonacci forecasts, with the rising RSI indicator suggesting momentum continues to build.
Investors are now facing the CPI on Tuesday, the Producer Price Index (PPI) on Wednesday, and retail sales on Thursday. OPEC's monthly report will also be released mid-week. Friday marks Jerome Powell's final day as Chairman of the Federal Reserve.
Trump's warnings about Iran increase geopolitical risks.
Donald Trump accused Iran of chain with the US for 47 years. The post specifically mentioned former President Barack Obama. Trump claimed the Obama administration had given Tehran billions of dollars, including $1.7 billion in cash.
Trump described the transfer as a windfall that the regime “didn’t know what to do with.” He argued that it provided Iranian officials with a financial lifeline . The president did not announce new sanctions or military steps .
This comment comes as Bitcoin's weekend rally tested resistance near $81,000 , increasing focus on geopolitical risks in cryptocurrency markets.
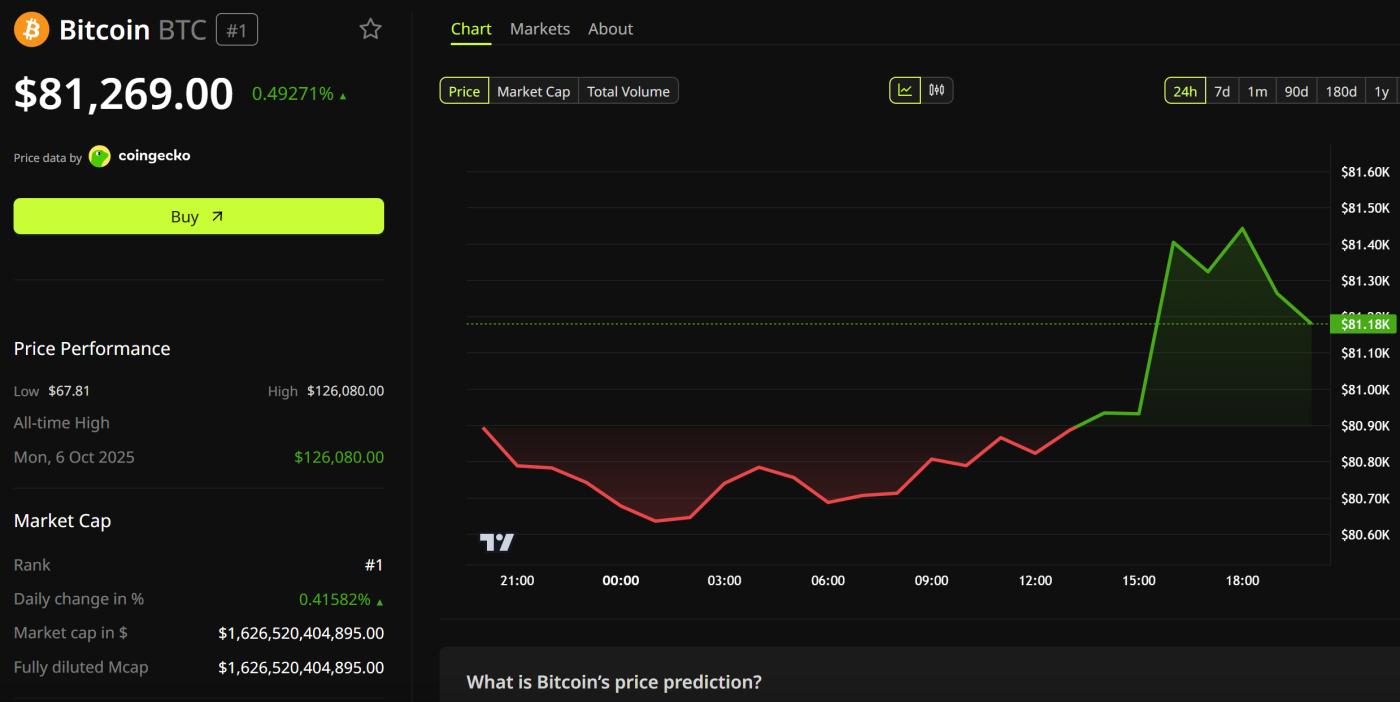 Bitcoin (BTC) price performance. Source: BeInCrypto
Macroeconomic calendar tests Bitcoin momentum.
Tuesday's CPI release remains the most important print for Federal Reserve policy expectations. Colder-than-expected figures typically support risk appetite, while hot inflation tends to push the timing of interest rate cuts further. April data could reshape pricing for the next two FOMC meetings.
Wednesday's PPI release, along with OPEC's monthly oil outlook , is complemented by retail sales on Thursday and industrial production on Friday, rounding the calendar. Each release could shift bets on Fed interest rate cuts within minutes.
Whether Bitcoin reaches $83,400 or retreats depends on howTrump's Iran rhetoric clashes with US data this week. Powell's final meeting as Fed Chairman adds another representative card.
"Never trust a weekend BTC pump," Trader Killa commented in a post.
The Bitcoin channel pattern targets $83,400 if BTC breaks above the 200-day EMA.
Meanwhile, Bitcoin is trading at $81,269 as of this writing, holding within a month-long ascending channel as the price approaches resistance at the 200-day exponential moving Medium (EMA) at $82,036.
The token has recovered approximately 35% from its February lows near $60,000, supported by new Capital of spot Bitcoin ETFs. However, momentum indicators are showing mixed signals as BTC stalled just below the long-term trendline that has limited any recovery efforts since late January.
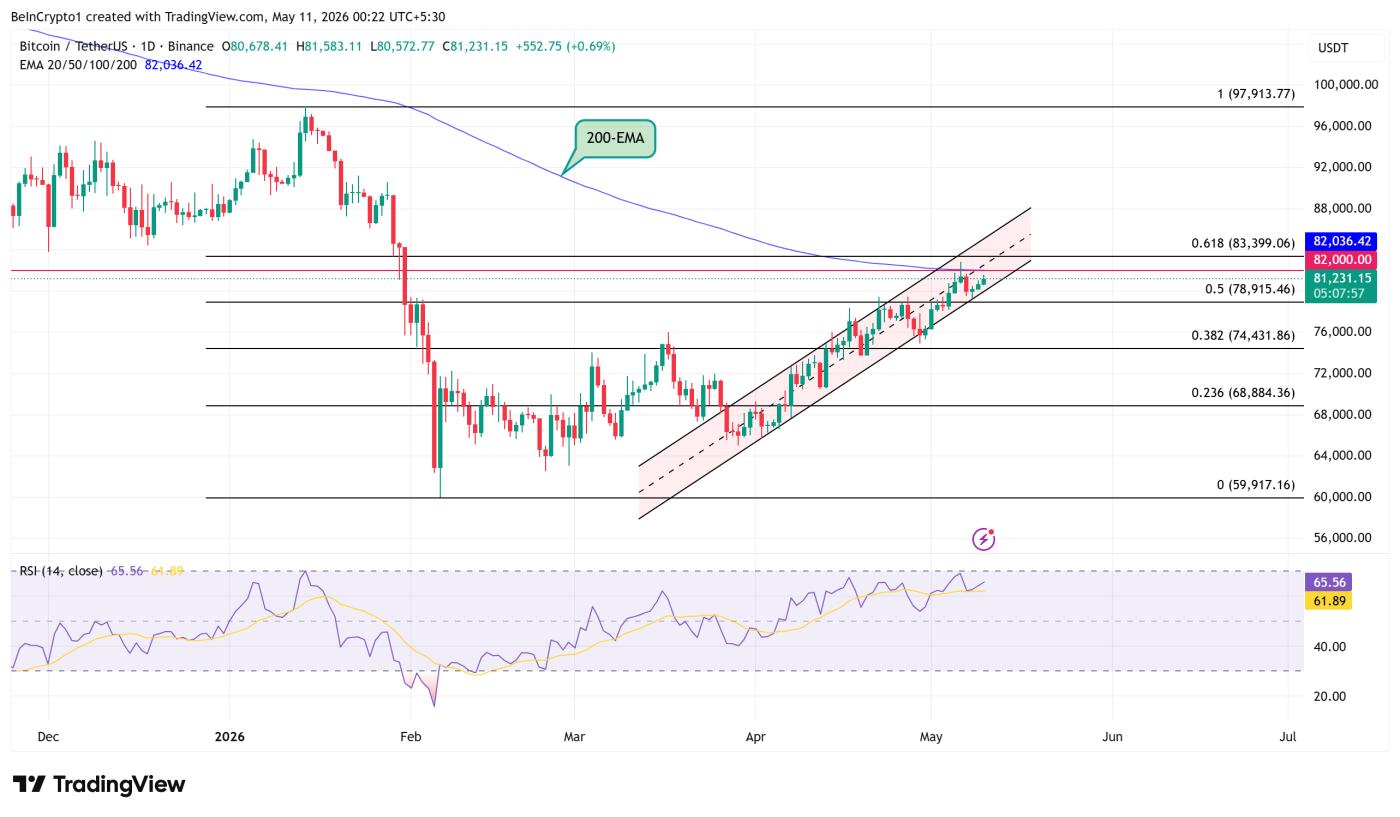 Bitcoin price performance. Source: TradingView
Bitcoin RSI climbs above 65 as overbought risk increases.
The Relative Strength Index (RSI) on the daily chart sits at 65.56, with the moving Medium at 61.89. Both indicators remain firmly above the neutral 50 line, confirming that buyers are in control of short-term price direction.
This momentum indicator tracks Bitcoin's steady recovery from the February capitulation. The RSI has risen uninterrupted since the indicator briefly broke through oversold conditions three months ago, reflecting the parallel recovery seen across BeInCrypto's bear market analysis range.
However, the current strength carries a warning sign. The 70 level marks the beginning of the overbought zone, and the indicator is currently recording its highest level since the crash began in January. Historical precedent suggests that the daily RSI pushing above 70 often precedes short-term cooling periods for BTC.
A clean breakout still needs volume confirmation. If buyers fail to push the RSI above 70 while the price remains below the 200-day EMA, a bearish divergence may form between the price high and the momentum high. A daily close that pushes the RSI back below 50 would reverse the signal and confirm sellers regain control of the trend.
Bitcoin price is predicted to reach $83,400 if the channel holds.
Bitcoin traded inside a clear ascending channel that began in early April near the $60,000 floor. Price action respected the middle line of the channel as dynamic support throughout the rally, with each pullback finding buyers within the structure.
The 200-day EMA at $82,036 is currently limiting upward momentum. This level coincides with a heavily supplied area that has rejected price multiple times between January and February. A daily close above $82,036 would mark the first time Bitcoin has reclaimed this trendline in nearly four months, confirming the May outlook predicted by several analysts .
If BTC breaks through that barrier, the 61.8% Fibonacci retracement level at $83,399 would become the next logical target. This level lies at the upper boundary of the channel, creating a confluence zone that could trigger profit-taking.
A move measured from the channel is expected to be around $86,500 in the following weeks if buyers absorb the supply at $83,400.
The bearish invalidation lies at the 50% Fibonacci level of $78.915. A daily close below this support level would break the channel structure and open the door to retest the 38.2% Fibonacci retracement level at $74.431.
Below that level, the 23.6% retracement at $68,884 marks the last support level before the recovery argument is broken, consistent with the broader long-term forecast for BTC into 2026.
Demand for spot ETFs continues to be the main catalyst . Net Capital totaled approximately $2.7 billion over nine consecutive sessions at the end of April, with BlackRock's IBIT and Fidelity's FBTC accounting for the majority.
Total assets in US spot Bitcoin products have now surpassed $100 billion, providing a stable bid that has held the lower channel boundary in place despite previously flagged bearish risk factors in 2026.
Whether Bitcoin breaks above or rejects the 200-day EMA within the next two weeks will set the directional tone for the trend toward June.