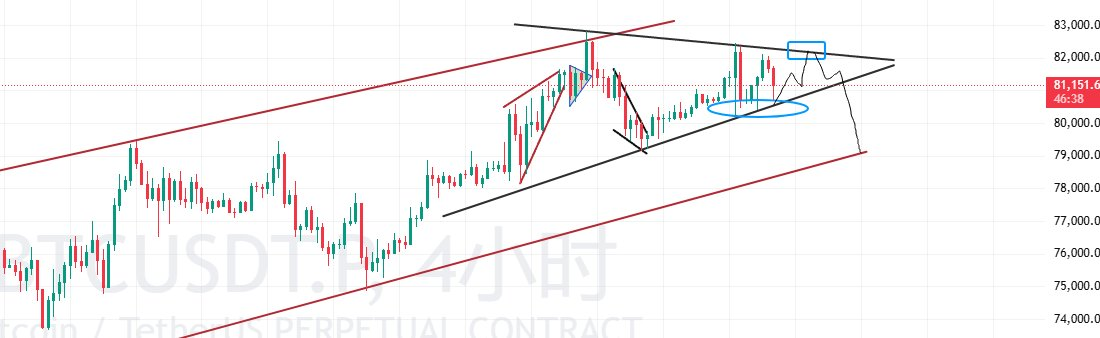
BTC experienced a short-term rebound followed by a pullback, and the price is currently touching the lower support of a small triangle pattern. The original plan was to short at 82,000, but due to anticipation of a potential bull trap, the short point was adjusted, and the current decline is not significant.
The chart pattern is bearish, with the 78,000 level consistently untouched. The lower edge of the triangle pattern provides strong support, making a break below it unlikely. Looking at the liquidation situation, most of the shares below have been liquidated, with only a small amount remaining at 80,300. The price has now stabilized.
In the short term, there's a high probability of an initial rebound, followed by a pullback to around 80,000 before moving upwards to around 82,500 to clear out positions held above. Consider long, then short to realize profits. However, the specifics depend on bottoming signals and the actual market pattern; no forced predictions are possible.
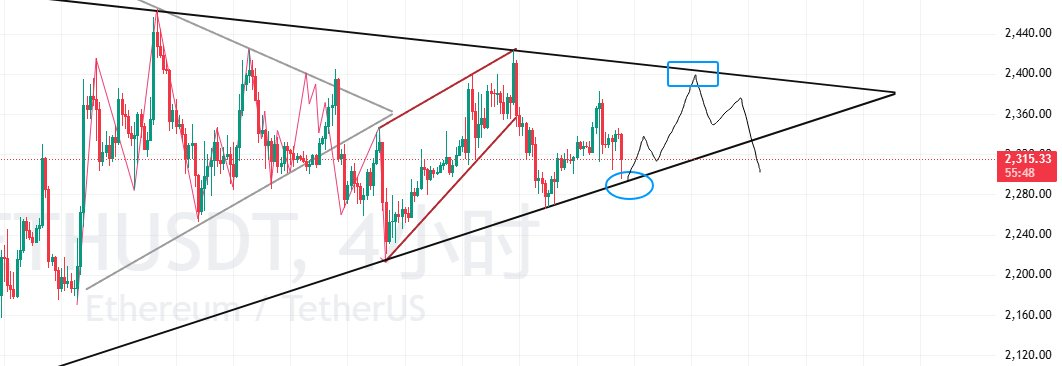
ETH remains weak in the short term. The slight rebound didn't even reach 2350, and after a period of consolidation, it plunged again. Currently, it's in a triangle pattern, and the price is almost touching the lower support level of the triangle.
Judging from the liquidation situation, most of the chips below have been cleared out, with only a little remaining around 2288. Even if the main force induces short selling to wash out this portion, the previous low of 2263 is unlikely to be broken—the recent dip touched the lower edge of the triangle and then recovered, indicating that this support level is very stable and not so easy to break.
If the support level holds, the market will likely move upwards to clear out the selling pressure above. There's still a lot of selling pressure above 2350, and if there's a rebound, it will likely reach the upper edge of the triangle pattern around 2400. In terms of trading strategy, I still plan to short around 2400; if there's a clear short-term bottoming signal, I'll long, then reverse and short, aiming to profit from both directions. The specific strategy will depend on how the market pattern changes.
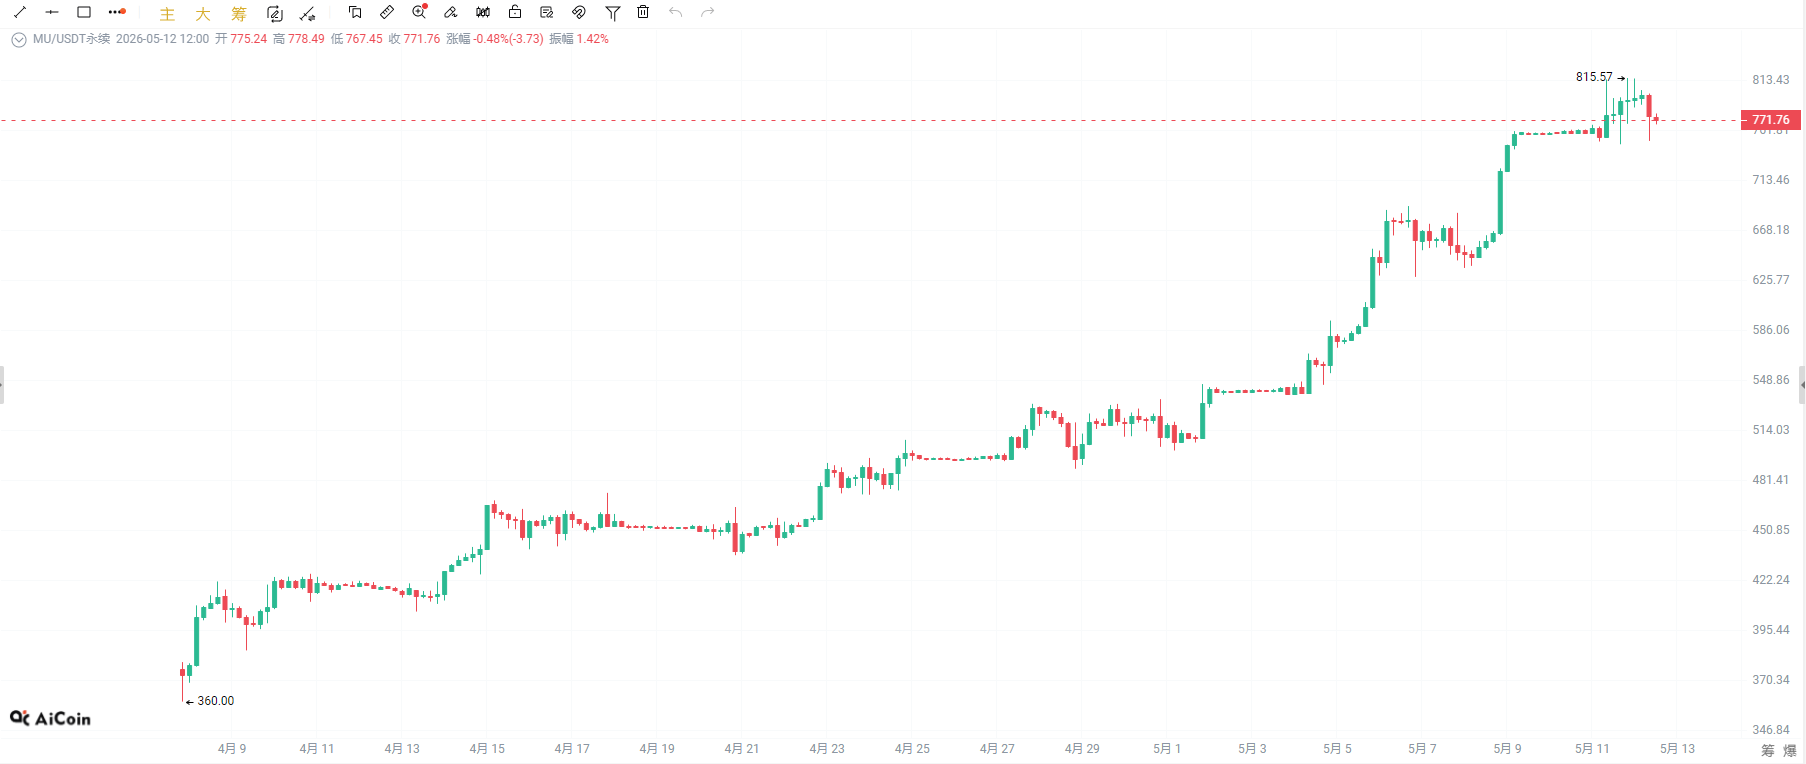
$MU: It has completed a full round of correction, and the current pre-market price is around 770, corresponding to a total market capitalization of less than 900 billion. Once the market capitalization stabilizes above the trillion mark, the corresponding stock price will likely fall between 880 and 900. The key short-term support range is 720-750, and there is still room for upward movement at this stage. The trillion-dollar market capitalization is most likely just the beginning of its upward trend.
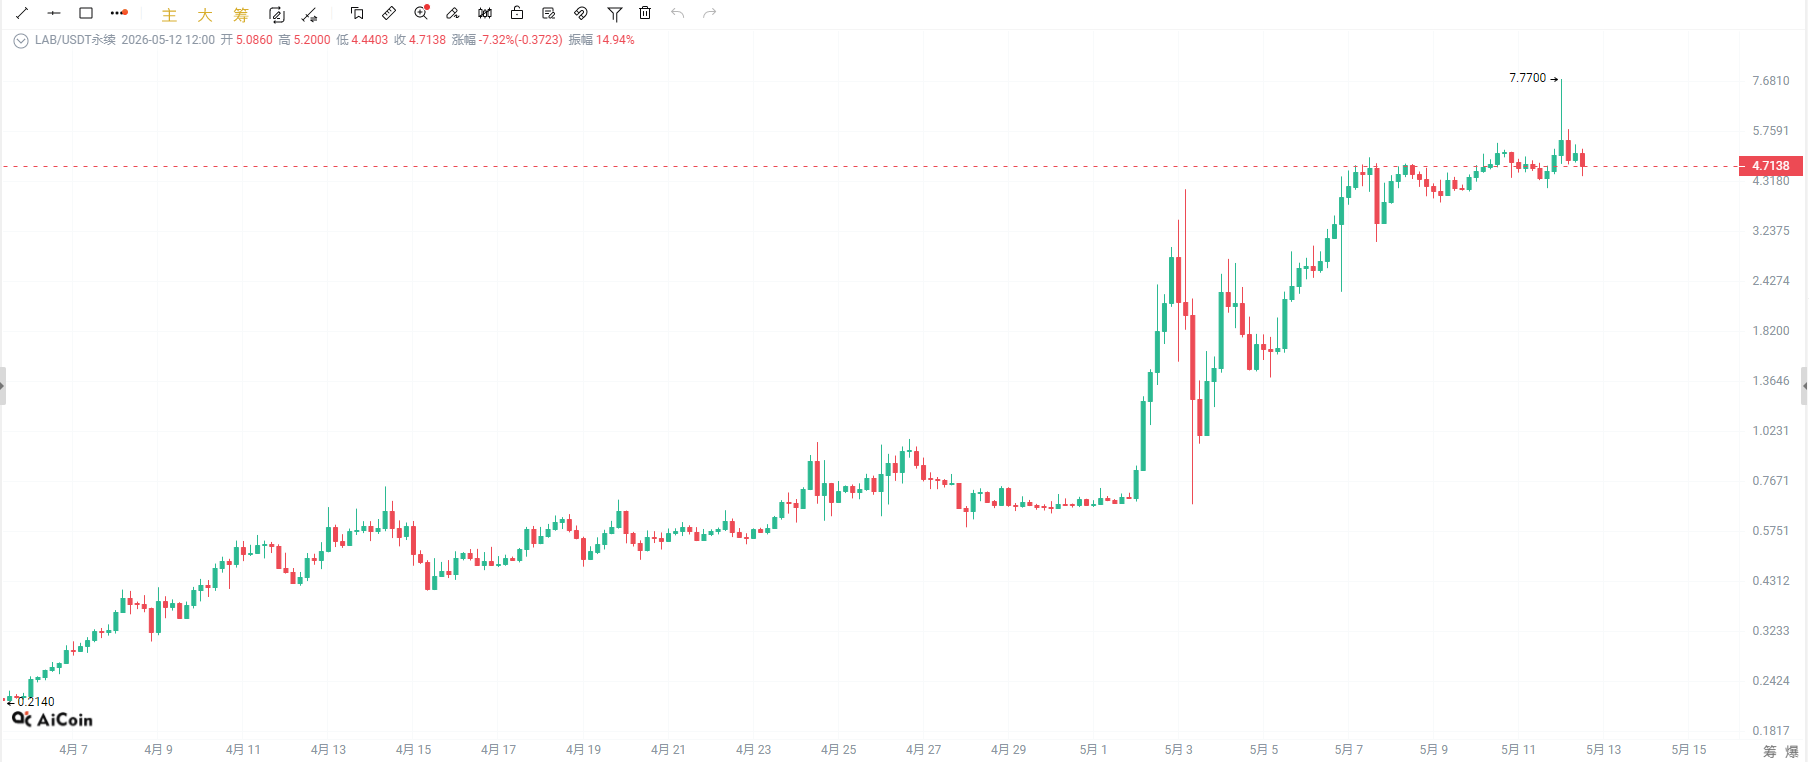
$LAB: Will it follow a similar trajectory to RAVE? Yesterday's market saw two rounds of short-term shakeouts: a batch of short positions were cleared above 5.3, followed by narrow-range fluctuations and a slight pullback during the day, and then a sharp drop in the evening that wiped out the vast majority of short positions; those with 3x leverage were almost certainly liquidated. Latest on-chain data shows that major players have transferred out 100 million LAB tokens, accounting for 30% of the total circulating supply. This manipulation is highly similar to what happened before RAVE's crash. Will history repeat itself this time?
The market is constantly changing, and specific entry and exit points should be determined based on real-time conditions. Follow the trend after a breakout! No matter how high your confidence level, please strictly adhere to your stop-loss and take-profit strategies! That's all for today! Follow me so you don't get lost! QQ: 2178747366, QQ: 3530882667 (Add me with a note, and I'll add you to our learning and discussion group).