According to the comparison terminal data, BTC hit a yearly high of $21,095 on January 13.
The 2023 BTC surge continues, with BTC topping $20,000 for the first time since the FTX crash in early November. Bitcoin is currently witnessing an uptick in bullish momentum following a strong rally across the cryptocurrency market following a positive Consumer Price Index (CPI) report. Bitcoin’s recent rally is creating higher volume levels and greater social engagement.
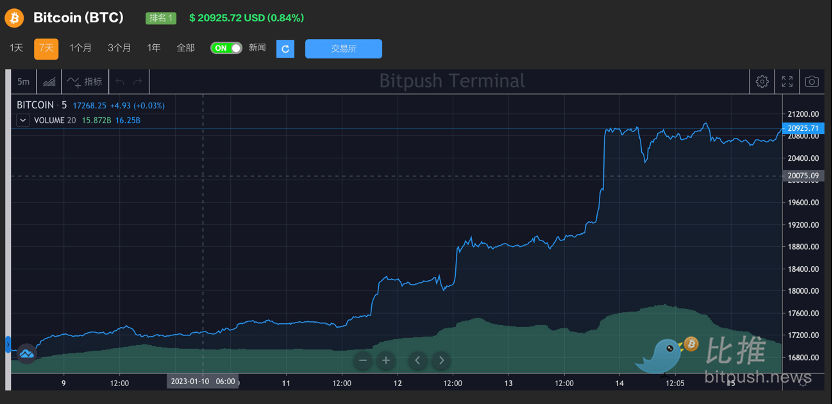
BTC started the week near the $17,000 mark after hovering around the $16,000 region since mid-December. Bitcoin is currently trading at $20,867, up 22% from last week's $16,900. Still, BTC is still near the lower end of a brutal bear market compared to November 2021 when it topped $65,000.
Is the Bitcoin bear market over?
Although the market is still in a bear market compared to last week, investor sentiment is improving. Investor sentiment towards the market hit a new monthly high, according to the Fear and Greed Index, a cryptocurrency-specific metric that measures sentiment using five weighted sources.
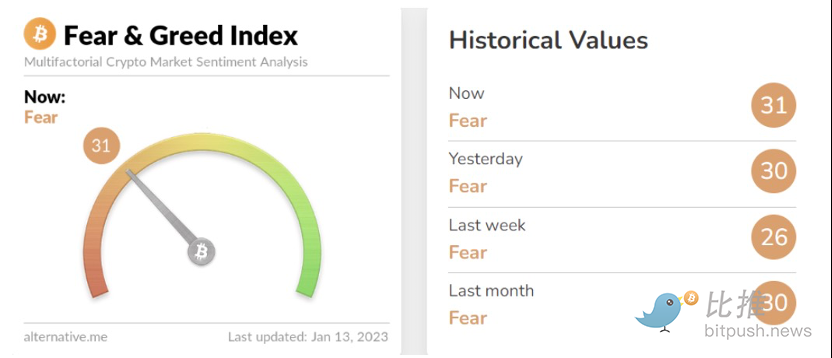
Bitcoin Fear and Greed Index Source: alternative.me
Bitcoin price is now above the important psychological level of $21,000, so many analysts and traders are expressing their views on the next direction of BTC price. "$20,000 is what was once considered a troubling low, but may now represent a sign of recovery," said Craig Erlam, senior market analyst at foreign exchange market maker Oanda.
Bitcoin volume remains a concern
Bitcoin prices have yet to recover to pre-FTX bankruptcy levels, but on Jan. 13 they traded above $21,095 for the first time since Nov. 8, 2022. Despite BTC’s strong recent rally, some analysts believe that BTC prices need to stay above $21,000 as support before the current bullish trend can continue.
According to Glassnode's analysis of BTC price-to-volume comparison data, "the new bullish trend from January 1 pushed Bitcoin to the $186,000-$189,000 level, but it needs to cross to $19,000 to break through at $19,000." Get a new trading channel near $21,000. Expect resistance near these levels as Bitcoin faces a mid-term downtrend. If price fails to break the trendline, we expect a retracement to the $16-17,000 region.”

Comparison of BTC price and transaction volume Source: Glassnode
BTC trading volume below $18,000 points to weak on-chain and centralized exchange (CEX) activity at the moment. The greatest volume and overall activity appears to be around the $16,000 level, suggesting this is a firmer bottom than the current price range. With light volumes around levels above $21,000, Bitcoin's gains may be capped at $21,095.
Is this just a bear market rally?
As Bitcoin still faces headwinds including massive layoffs at exchanges due to macroeconomic tightening, legal issues with Gemini and Genesis, and the possible establishment of the U.S. House of Representatives Encryption Subcommittee. And, Bitcoin’s Relative Strength Index (RSI) currently shows that BTC is overbought. According to RSI analysis, a sharp downtrend may form as the price corrects.
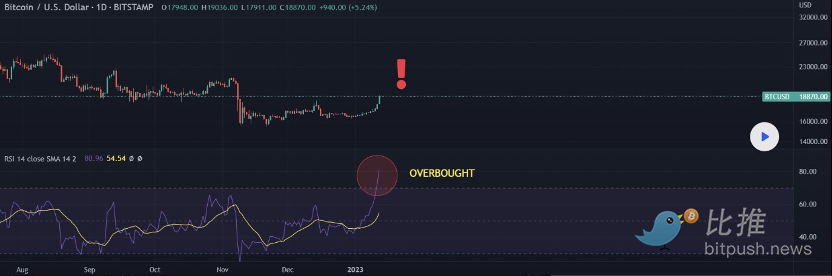
Bitcoin RSI Source: TradingView
Macro markets are also at major resistance levels, TraderSZ said. The U.S. dollar index (DXY) is at a key support level, which means risky assets like Bitcoin could start to sell off if the index recovers. Bitcoin remains correlated with stocks, and the SPX mini futures index is also showing signs of a pullback.
BTC may struggle to reach higher levels as Bitcoin investors take profits as TraderSZ suggests.
Historical Data Shows Bitcoin Could Hit a Macro Bottom
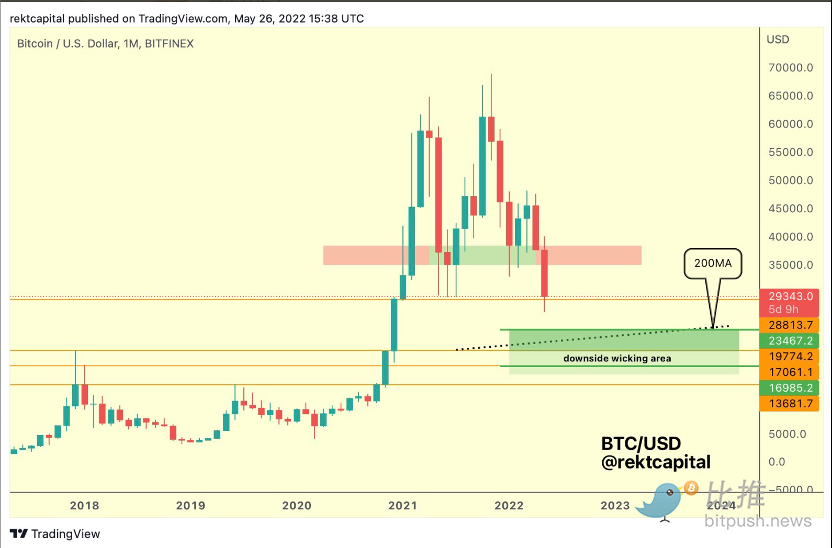
Bitcoin is currently trading below its 200-week moving average, and according to independent market analyst Rekt Capital, the price of Bitcoin may have hit a macro bottom based on historical data. Historically, the "death cross" level shows a bottom at $23,500.
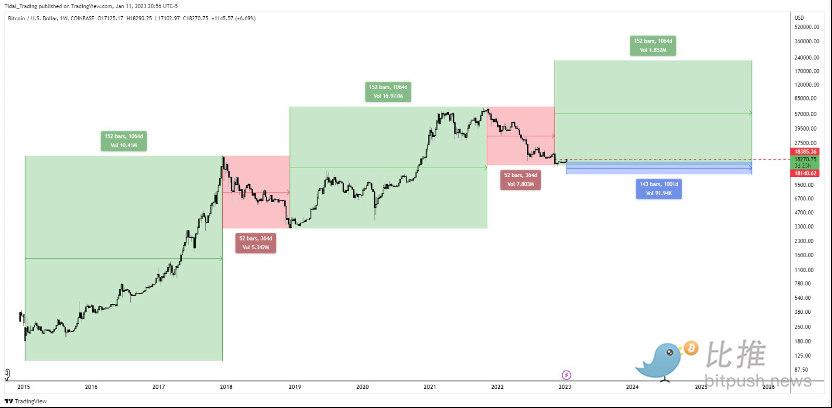
Independent market analyst HornHairs cited historical data from 2015 to estimate how long it would take for Bitcoin to hit a new all-time high. "The 2015-2017 bull market lasted 1,064 days, matching the 2018-2021 bull market that lasted the same number of days," HornHairs said. Matched, it would take Bitcoin 1,001 days to reach a new all-time high.”
Despite the current circumstances and the strength of the current price breakout, Bitcoin has proven many technical analysts wrong in the past. Risk-averse traders might consider keeping an eye out for increased volume as prices rise as an indicator of whether Bitcoin is finally back in a bull market.