Bitcoin (BTC) is breaking free from the cyclical patterns that previously defined all its historical peaks. on-chain data shows that indicators that once warned of a market peak remain silent, even though BTC has surpassed $81,000.
The MVRV Z-Score, exchange balances, and BTC holdings by spot ETFs all suggest a structural shift is underway, rather than entering the typical end-of-cycle phase . While signals from retail investors remain subdued, institutions are consistently buying aggressively at record levels.
Bitcoin Cycle: The MVRV Z-Score Indicator is no longer working as it used to.
The MVRV Z-Score measures the gap between the market value and the realized value of Bitcoin. In the past, a reading above 6 signaled a market peak, while a reading near 0 indicated an accumulation phase.
According to data from Glassnode, the index only edged up to around 3.5 after the recent halving event, significantly lower than the 12, 11, and 7 levels seen at the cycle peaks of 2013, 2017, and 2021, respectively.
Previous cycles typically peaked when the Z-Score climbed into the red zone above 6. The 2017 peak was at 10, while the 2021 peak was near 7. In this cycle, the index has not yet approached those levels.
As of May 14, 2026, the Z-Score is only fluctuating around 1. The signal that used to appear during every "peak euphoria" of the market has been completely silent since BTC rose from its 2022 Dip .
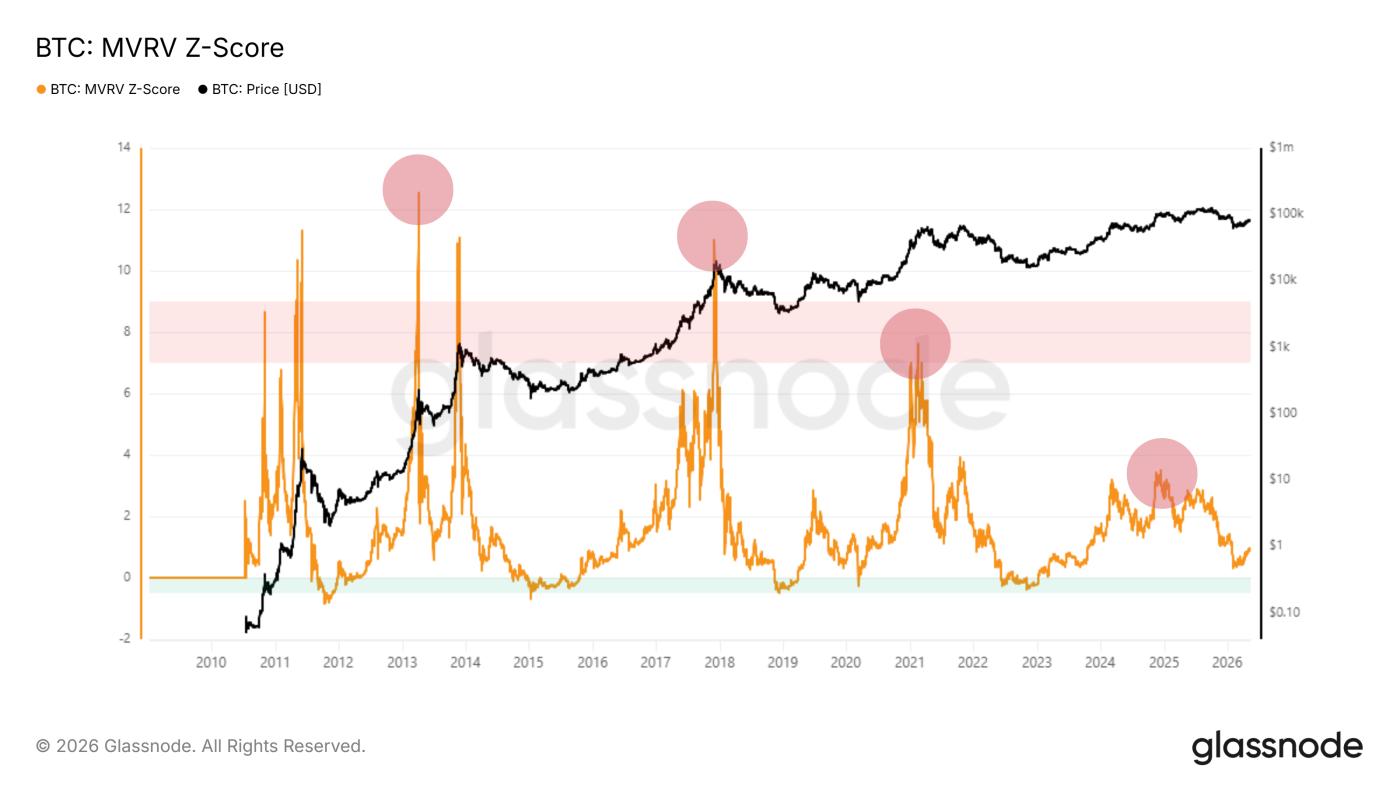 BTC 's MVRV Z-Score / Source: Glassnode
To confirm a traditional market peak, the Z-Score needs to rise back above 3.5. If the index sustainably rises towards 6, history suggests a prolonged downward correction lasting several months may occur.
The "compression" phenomenon of this index demonstrates that the actual value of BTC is increasing fast enough to absorb all price fluctuations. The bullish divergence that previously appeared at old peaks has not been repeated this time.
Supply on the exchange continues to decrease.
The balance charts on exchanges also show a clear structural shift in supply. Glassnode continuously monitors the total amount of BTC held on exchanges throughout market history.
BTC reserves on exchanges peaked at over 3.3 million BTC in early 2022. Since then, this number has steadily decreased, and by May 2026 it was only around 3 million BTC.
During the same period, the price of Bitcoin continued to rise sharply. BTC surpassed previous cyclical peaks, reaching $126,000 in October 2025, despite increasingly limited supply on exchanges.
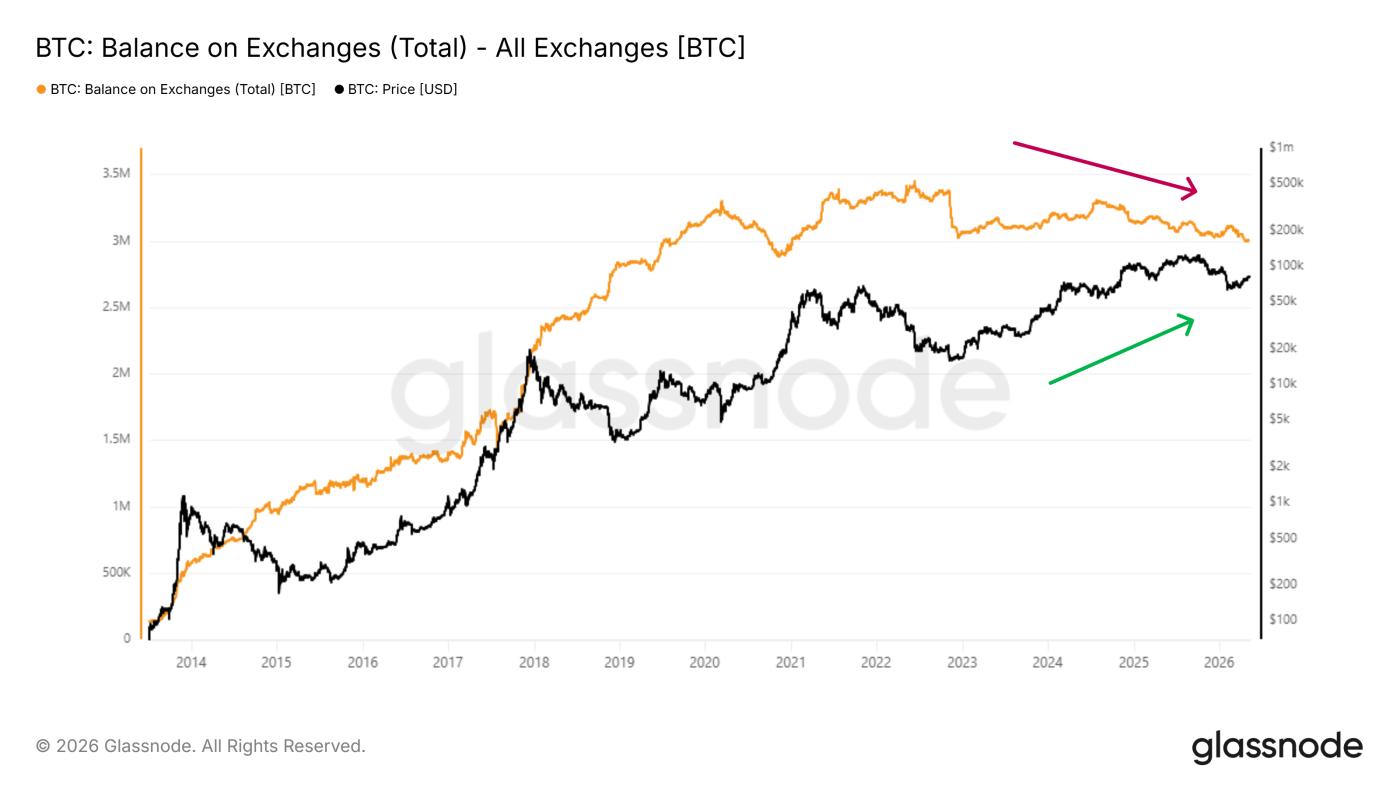 BTC balances on exchanges / Source: Glassnode
The decrease in BTC supply while the price increases suggests that a large number of investors have moved their coins to secure wallets. This pattern is also consistent with whale accumulation signals from large wallet groups.
For this trend to reverse, the amount of BTC on exchanges needs to rise back above 3.2 million BTC. This would signal that investors who have been accumulating coins for the past three years are beginning to release them onto the market.
Spot ETFs currently hold approximately 1.3 million BTC.
Spot Bitcoin ETFs in the US didn't exist before January 2024. According to aggregated data from Glassnode, these funds have held nearly 1.3 million BTC to date.
This figure accounts for approximately 6.5% of the total circulating supply of BTC. BlackRock's IBIT fund leads the way, followed by Fidelity's FBTC and Grayscale's product portfolio.
These funds consistently buy even when the price of BTC is consolidating or correcting, indicating that the majority of asset allocation decisions are made by institutions, not by retail investors chasing rallies. ETFs have been buying more BTC daily than the amount of new BTC being mined.
With the number of new buyers increasing but the circulating supply decreasing, this explains why the price of BTC has surged without the need for as many small retail investors as in previous cycles.
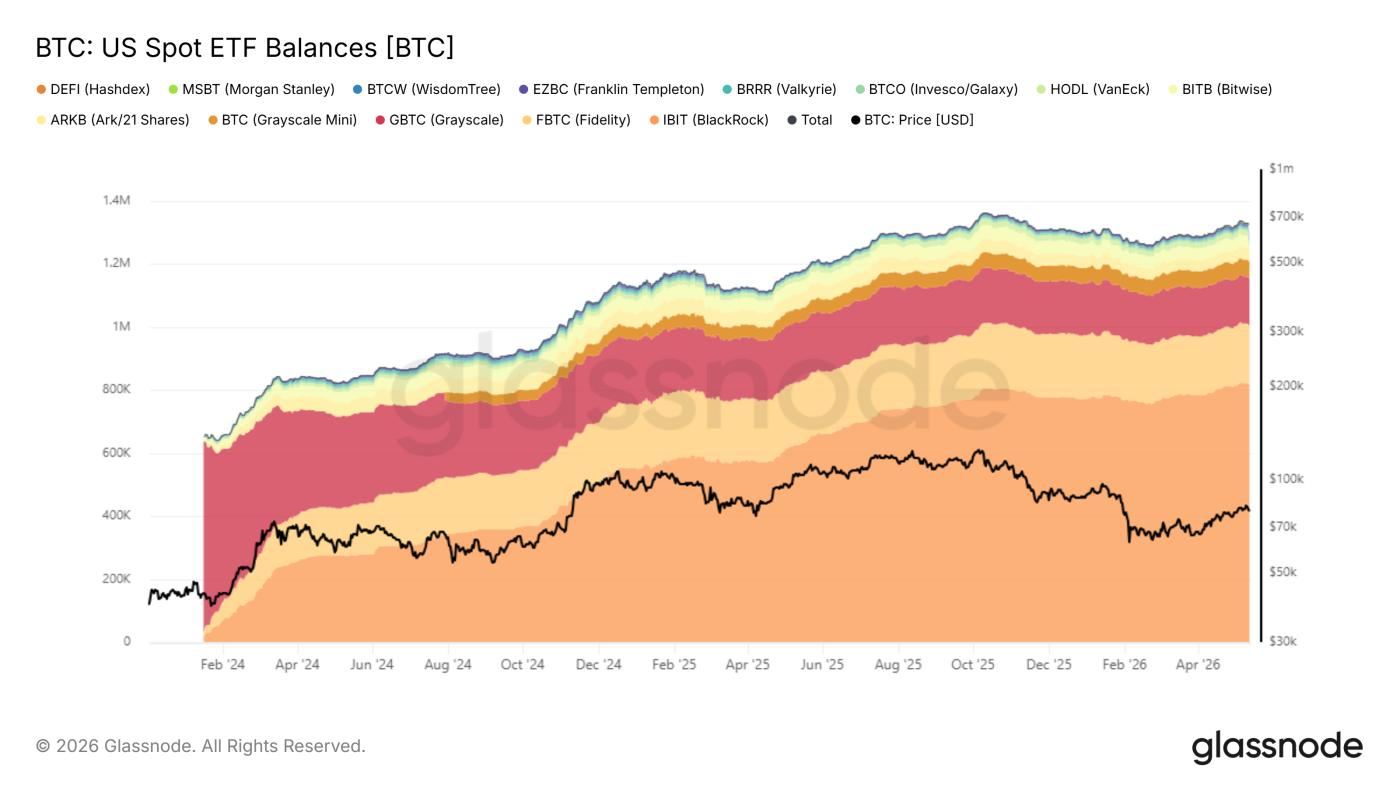 BTC balances of US spot ETFs / Source: Glassnode
However, the story here is more structural than about price direction. The reasons why there hasn't been a frenzy from retail investors could also make the correction at the end of the cycle milder.
The flow of money into ETFs could reverse at any time. The concentration of large amounts of BTC held by institutions also brings new risks related to portfolio rebalancing or liquidation conditions in the global market.
Looking at the data, it's clear that the thresholds that were historically significant may no longer be relevant to the current market.