2026 marks the year the cryptocurrency market enters a phase of strict regulation and real-world integration, transitioning from a highly speculative market to a parallel financial infrastructure.
- Legally, the European MiCA framework (Regulation (EU) 2023/1114) reaches a crucial milestone on July 1, 2026, marking the end of the transition period for crypto asset service providers (CASPs). Simultaneously, the United States implements the GENIUS Act for stablecoins (effective from July 2025, with enforcement rules expected to be finalized on July 18, 2026), and Europe implements the DAC8 tax reporting regulation (Directive (EU) 2023/2226) from January 1, 2026.
- In terms of size, stablecoins are expected to reach a market capitalization of approximately $315 to $320 billion in Q1 2026. On-chain tokenized physical assets (RWA), excluding stablecoins, are estimated at around $24 to $37 billion depending on the source. International payment infrastructure will complete the transition to the ISO 20022 data standard (SWIFT, November 22, 2025).
- Regarding standardization and risk, increasing compliance pressure (FATF sender-receiver data transmission rules, DAC8 tax reporting, proof of reserve requirements) significantly increases the operating costs of exchanges. Simultaneously, institutional capital continues to flow into decentralized finance infrastructure, and crypto card payments have reached a significant scale in consumer life.
PART I. FINTECH MARKET CLASSIFICATION FRAMEWORK AND CODED ASSET STRUCTURE
1.1. Fintech Market Classification Framework from Multiple Perspectives
The Fintech market is vast and cannot be viewed from a single perspective. According to some market research reports, the global Fintech market size is estimated at around $460 billion in 2026 with a compound annual growth rate of approximately 16%. However, these figures vary significantly between different sources due to differing statistical scopes, so they should only be considered as directional estimates. Before delving into each aspect, the report presents five complementary perspectives to clearly identify which parts of Fintech are related to blockchain.
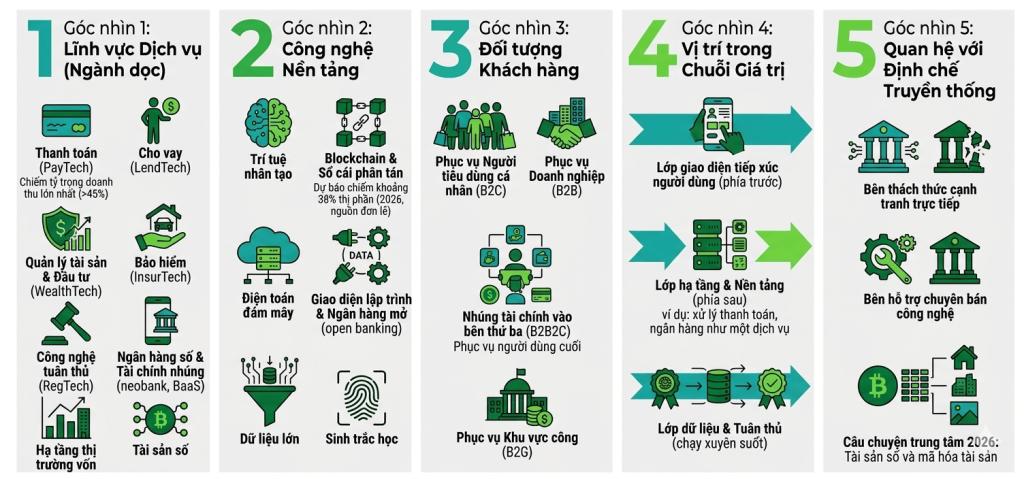
- The first perspective is based on service sectors, also known as vertical industries. The main groups include payments (PayTech), lending (LendTech), asset management and investment (WealthTech), insurance (InsurTech), compliance technology (RegTech, technology that helps businesses meet regulations), digital banking and embedded finance (neobank, BaaS, or banking as a service), capital market infrastructure, and digital assets. Of these, payments still account for the largest share of revenue, over 45% according to industry estimates.
- The second perspective is based on underlying technologies, including artificial intelligence, blockchain and distributed ledgers, cloud computing, open programming interfaces (OPS), and open banking (a mechanism that allows secure sharing of financial data between parties), big data, and biometrics. According to one market report, the blockchain component alone is projected to account for approximately 38% of the market share by technology in 2026, but this figure comes from a single source and should be interpreted with caution.
- The third perspective is customer-specific, encompassing serving individual consumers (B2C), serving businesses (B2B), embedding financial services into third-party platforms to serve end users (B2B2C), and serving the public sector (B2G).
- The fourth perspective is based on position within the value chain, encompassing the front-end user interface layer, the back-end infrastructure and platform layer (such as payment processing, banking as a service), and the data and compliance layer running throughout.
- The fifth perspective is in relation to traditional institutions, including those that directly challenge banks in competition, and those that support them by selling technology to those institutions. By 2026, digital assets and asset tokenization are considered by many large organizations, including KPMG, to be the central story of the industry.
1.2. Selecting blockchain-related application pieces for in-depth analysis.
Not all Fintech sectors are closely tied to blockchain. The table below compares the level of blockchain adoption across each sector to determine the scope of in-depth analysis for this report.
| Fintech sector | Blockchain adoption level | Manifestations in 2026 | In-depth analysis |
|---|---|---|---|
| Payment (PayTech) | High | Stablecoins, crypto tokens, cross-border payments, AI-powered payments | Have |
| Lending (LendTech) | High | Decentralized lending protocols such as Aave and Morpho. | Have |
| Asset management, investment (WealthTech) | High | Tokenize real assets, funds, and bonds on the blockchain. | Have |
| Capital market infrastructure | High | Cryptocurrency, atomic payment (DTCC) | Have |
| Digital assets | Very high | Exchange, custody, underlying assets | Have |
| RegTech (Compliance Technology) | Fit | On-chain analysis, proof-of-concept, ISO 20022, data transmission rules | Yes, throughout the class. |
| Digital banking (Neobank, BaaS) | Indirect | Deposit tokens, CBDCs | Part |
| Insurance (InsurTech) | Short | Smart contract testing is not yet at scale. | Not the main focus |
Based on this comparison, the report focuses on an in-depth analysis of five high-application areas: digital assets, payments, lending, asset management and investment, capital market infrastructure, and the underlying compliance and standardization technology layer. Indirectly related areas such as digital banking are mentioned in the asset section (deposit tokens, CBDCs), while insurance is not a focus due to its limited blockchain application scale. The following sections will explain and analyze each of these components in turn.
1.3. Classification of Cryptocurrency Assets in 2026
By 2026, "crypto assets" will no longer be a homogeneous group but will be stratified according to their economic nature (where their value comes from) and legal status (who manages them, whether they have a reserve obligation). There will be five main groups.
- Stablecoins are privately issued cryptocurrencies pegged to a reference asset (primarily the US dollar). Essentially, they are a debt of the issuer, secured by high-quality reserve assets. Under the GENIUS Act, stablecoins used for payments in the United States must be backed at a one-to-one ratio and subject to periodic audits. In the European framework, they correspond to electronic money tokens (EMTs) and asset reference tokens (ARTs) under the MiCA.
- Real-world assets (RWA) are on-chain replicas of traditional assets such as bonds (especially US Treasury bills), money market funds, private equity, commodities (gold), and stocks. Legally, they are typically tokenized securities or financial instruments, issued through a special purpose vehicle (SPV), and subject to applicable securities laws. According to the RWA.xyz data platform, tokenized US Treasury bills are the largest and fastest-growing group, exceeding $10 billion by the end of February 2026 and reaching approximately $13.4 billion by early April 2026.
- Central bank digital currencies (CBDCs) are a direct obligation of the central bank, thus eliminating credit risk from a private institution. As of 2026, this type of digital currency will largely remain in the pilot phase, according to the IMF and BIS. The wholesale CBDC variant is considered by researchers to be the safest payment asset to support cryptocurrency markets.
- Deposit tokens are tokens that represent deposits held at commercial banks. Essentially, they are money created by the bank, differing from stablecoins in that they are part of the bank's balance sheet and subject to banking oversight, including deposit insurance. They are a central component of the next-generation transactional banking strategies of institutions like Deutsche Bank and JP Morgan.
- Native crypto assets, including Bitcoin, Ether, and network tokens, derive their value from the scarcity or utility of the network, with no issuer obligated to hold reserves. This group is the most volatile in terms of price and serves as the benchmark asset for much of the derivatives market.
| Type of asset | Nature | Issuer | Main risks | Legal status 2026 |
|---|---|---|---|---|
| Stablecoin | 1:1 Secured Debt | Private licensed | Loss of price anchoring, inventory quality | GENIUS Act (USA); EMT, ART according to MiCA |
| RWA tokens | Real assets | Financial institutions, SPVs | Legal ownership rights, liquidity | Current Securities Law |
| CBDC | Central bank obligations | Central bank | Operations, Privacy | Currently in pilot phase. |
| Deposit tokens | Bank deposits | Commercial bank | Bank credit risk | Banking supervision framework |
| Native site | Scarcity, network utilities | Do not have | Price volatility, cybersecurity | Other assets under MiCA |
1.4. Classification of exchange infrastructure
From a technological standpoint, there are three models. Centralized exchanges (CEXs) hold client assets themselves, use a centralized order book, and require client identification. This remains the dominant channel, with monthly spot trading volume exceeding $1 trillion according to CoinGecko. Decentralized exchanges (DEXs) allow self-custody trading via smart contracts; the exchange does not hold client assets, with Uniswap leading the spot trading segment. Hybrid exchanges (HEXs) combine the speed and liquidity of CEXs with the self-custody of DEXs, particularly popular for perpetual contracts (derivatives without an expiration date), with Hyperliquid being a prime example.
In terms of legal status in 2026, some entities have already been granted CASP licenses under MiCA, enjoying a "passport" mechanism to operate throughout Europe. It should be noted that entities in the transitional phase are not yet considered CASP-licensed and do not enjoy this passport mechanism. In addition, exchanges registered in special financial districts such as VARA (Dubai), Singapore (MAS), and new licensing pathways in the United States, along with non-custodial or offshore exchanges, are subject to stricter regulations.
In terms of asset class, there are exchanges serving individual investors with a wide range of tokens and fast listings, and exchanges serving institutions for trading RWA and credit, with high custody standards and integration with capital market infrastructure. In Q1 2026, Nasdaq, NYSE, and DTCC all moved towards bringing crypto securities into regulated market systems.
1.5. The convergence of traditional finance and decentralized finance
A prominent trend in 2026 is the emergence of large exchanges and organizations deeply integrated with banks to provide institutional-standard custody services, including client asset segregation, independent audits (SOC 2 Type II, ISO 27001 standards), and cryptographic proof of reserves. Conversely, traditional market infrastructure is moving assets onto the blockchain. DTCC's subsidiary, DTC, received a waiver from the SEC in December 2025 to tokenize Russell 1000 stocks, major index ETFs, and Treasury bills, with a rollout roadmap for the second half of 2026. The key legal point is that tokens inherit the same legal status as underlying securities, thus fitting seamlessly into the existing collateral framework without requiring the development of new legal infrastructure.
Table 1. Comparison of exchange models in 2026
| Criteria | CEX (centralized) | DEX (decentralized) | HEX (hybrid, derivative) |
|---|---|---|---|
| Custodial model | Asset holding platform | Self-registered | Lai, usually self-registers in partnership with others. |
| Customer identification | Obligatory | Minimum | On the rise due to legal pressure. |
| Liquidity | At its highest, spot sales exceeded $1 trillion per month. | Rapid growth, wide token penetration. | The derivatives market is booming. |
| Spot market share (DEX on CEX) | Reference | Approximately 13.6% (CoinGecko) to 27% (ARK) | Within the DEX group |
| Compliance with the law | High burden | Taking shape | Intermediate level |
| Asset transparency | Evidence of reserves and audits | Transparency across the supply chain | Lai |
| Specific risks | Custody risk, counterparty risk | Smart contract errors | Liquidation risk, oracle |
| Represent | Binance, Coinbase, OKX | Uniswap, PancakeSwap | Hyperliquid, Lighter, edgeX |
The large variations in spot market share reflect differences in measurement methodologies, which are explained in detail in section 2.2.
PART II. DATA QUANTIFICATION AND EVIDENCE
Cryptocurrency market data is highly fragmented across sources due to differences in definition (whether it includes stablecoins, whether it measures actual distributed value or also the locked portion on the platform), exchange coverage, and how duplicates are handled when aggregated through data aggregators. The report is presented in range format and clearly states the source.
2.1. Macroeconomic Indicators
Regarding on-chain RWA market capitalization (excluding stablecoins), sources show a strong upward trend but differ in absolute figures. DeFiLlama recorded approximately $23.6 billion at the beginning of March 2026, an increase of about 66% year-to-date. RWA.xyz recorded approximately $27.5 to $29 billion in Q1, rising to around $32 billion by May 2026, with some sources reporting higher figures of $34.5 to $37.5 billion. CoinGecko's RWA report at the end of Q1 put the figure at around $19.3 billion. The conservative consensus range is approximately $24 to $34 billion by mid-2026, an increase of over 100% year-to-date. Including stablecoins, the total crypto RWA in the broad sense exceeds $300 billion. Standard Chartered's long-term projection places the crypto market at approximately $30 trillion by 2034, a scenario that is both indicative and highly uncertain.
Regarding stablecoins, market capitalization is projected to reach approximately $315 to $320 billion in Q1 2026, with USDT accounting for around $184 to $190 billion and USDC around $77 to $78 billion, these two coins together representing about four-fifths of the market. On-chain trading volume for stablecoins in Q1 reached approximately $28 trillion, an increase of about 51% compared to the previous quarter. For 2026 projections, OCC estimates the private sector at around $500 billion, while Bernstein estimates around $420 billion by the end of the year; this difference reflects the uncertainty surrounding the implementation of the GENIUS Act and market cycles.
The majority of institutional trading volume remains on licensed and centralized exchanges, while decentralized finance is increasing its market share, though its absolute value fluctuates cyclically. In Q1 2026, stablecoins accounted for approximately 75% of total crypto trading volume, demonstrating their role as the market's operating currency.
2.2. Financial indicators of the exchange
Regarding market share ratios between DEXs and CEXs, this is a data point that requires caution because sources provide very different figures at the same time. CoinGecko reports that the spot DEX-to-CEX ratio is approximately 13.6% in January 2026, having peaked at around 24.5% in June 2025, while derivatives on DEXs is around 10.2%. ARK Invest gives a figure of around 27.4% in Q1 2026, although the absolute volume decreased by 26% to approximately $832 billion. CoinDesk Exchange Review in March 2026, however, indicates that the spot DEX ratio is only about 14.3%, derivatives about 14.9%, while the total volume of CEXs reached approximately $5.26 trillion. The long-term trend is for DEXs to sustainably increase their market share, from around 6.9% at the beginning of 2024, but the exact figure at any given time is heavily dependent on the measurement methodology, so a single number should not be cited.
Regarding compliance costs and their impact on profit margins, mid-sized exchanges face the greatest pressure. The dual pressures from MiCA, DAC8, and data transmission rules increase fixed costs for enhanced identification, jurisdictional reporting systems, and audits. For DAC8 alone, official EU estimates a one-time implementation cost of approximately €259 million and maintenance costs of around €24 million per year for service providers, counterbalancing additional tax revenues of approximately €1 to €2.4 billion per year for member states. Because compliance costs are largely fixed, they compress profit margins most severely for exchanges that are not large enough to cover these costs and lack the capital to compete for licenses.
2.3. Actual Results of DeFi Platforms
The total value of assets locked in decentralized finance protocols (TVL, or total value locked, the total amount of money users deposit into these protocols) in March 2026 was approximately $94 billion, down from around $120 billion at the beginning of the year. Depending on the measurement method, DeFiLlama recorded between $95 and $140 billion by mid-April 2026. Importantly, the decline was primarily due to falling asset prices, not user withdrawals: the amount of ETH deposited into the protocols still increased from 22.6 million to 25.3 million (an increase of approximately 12%) in the first quarter.
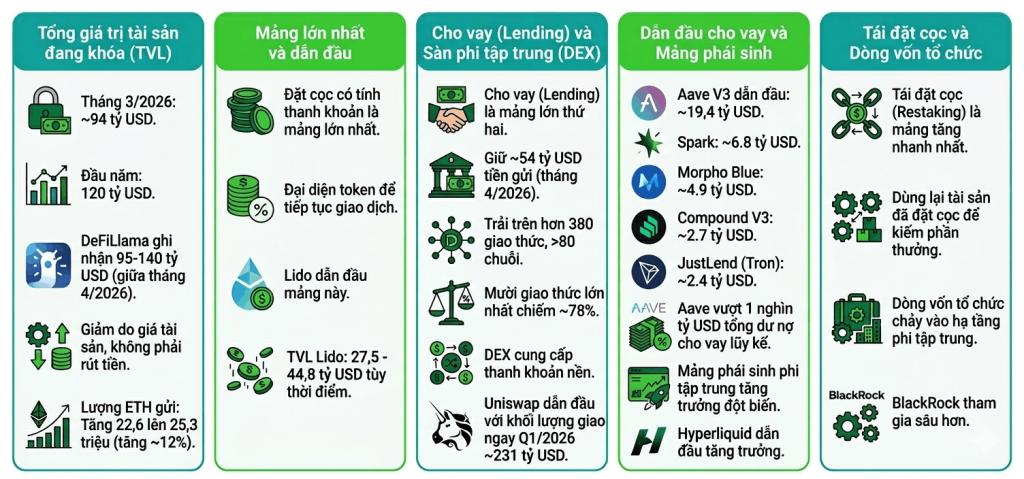
- Liquid staking (where users stake assets to receive rewards while also holding a representative token that can be traded) is the largest segment by TVL. Lido leads this segment, with TVL fluctuating between approximately $27.5 billion and $44.8 billion depending on the time and asset price.
- The lending segment is the second largest, holding approximately $54 billion in deposits as of April 2026, spread across more than 380 protocols on over 80 chains, with the ten largest protocols accounting for approximately 78% of total deposits. Specifically, Aave V3 leads with approximately $19.4 billion, followed by Spark with approximately $6.8 billion, Morpho Blue with approximately $4.9 billion, Compound V3 with approximately $2.7 billion, and JustLend on Tron with approximately $2.4 billion. Aave alone has surpassed the $1 trillion mark in cumulative outstanding loans.
- The decentralized exchange (DEX) sector continues to provide underlying liquidity for the entire ecosystem. Uniswap regained its leading position with approximately $231 billion in spot trading volume in Q1 2026. The decentralized derivatives sector experienced explosive growth, led by Hyperliquid and several new players.
- The restaking segment (using previously staked assets to earn additional rewards from other systems) is projected to grow fastest in 2026. Simultaneously, institutional capital continues to flow into decentralized infrastructure, with BlackRock becoming more deeply involved in the sector.
2.4. Transparency Index: Evidence of Reserves and Asset Separation
Proof of reserves (the way exchanges demonstrate they actually hold sufficient assets for clients) in 2026 will primarily rely on Merkle tree structures, demonstrating both total asset reserves and total obligations to clients. Practices are shifting in three directions: higher frequency of disclosures, from periodic to near-continuous verification, with some exchanges conducting internal checks every ten minutes; the application of non-disclosure proof to verify solvency in real time without data exposure; and a strong emphasis on client asset segregation and independent audits by major firms.
The Zondacrypto crash in Poland in April 2026 is a classic example of the year. The exchange's Bitcoin hot wallet balances plummeted by approximately 99.7%, despite the exchange claiming sufficient liquidity, affecting around 30,000 users and considered the largest exchange crash in Europe since the FTX crash. This was compounded by Poland's slow adoption of the MiCA (Ministry of Commerce and Industry), only passing it on May 15, 2026, with a CASP (Civil Service Prohibition) license deadline of July 1, 2026. In the United States, there is no federal requirement for proof of reserves, while the CLARITY Act is moving toward requiring reserve verification for custodian exchanges.
2.5. Operational Efficiency: On-chain Payments vs. Traditional Clearing
The central idea of atomic settlement is that assets and money are transferred simultaneously and inseparably, thereby virtually eliminating the risk of one party failing to pay, freeing up capital held as a guarantee against payment risks, and eliminating many intermediate reconciliation steps.
Quantitative estimates should be interpreted as conditional potential ranges, as these are not yet operational results at large scale. According to industry analyses of DTCC, the new model has the potential to reduce payment errors by approximately 90% and operating costs for market participants by approximately 50%, with a deployment roadmap in the second half of 2026. A Fireblocks report estimates that post-transaction processing costs could decrease by 35 to 65% depending on the asset type. The new system also allows for 24/7 operation, including weekends, supporting collateral management and meeting margin requirements at any time. In its 2026 document, the IMF positions asset tokenization as a structural shift in financial architecture, provided it is anchored to secure payment assets, robust source code governance, and legal certainty.
Table 2. Performance and Risk Comparison: Old System vs. New System
| Aspect | Traditional clearing (T+2) | On-chain, atomic payments (2026 target) |
|---|---|---|
| Payment cycle | T+1 or T+2, depending on the batch. | Instantaneous or near-instantaneous, continuous |
| Operating hours | According to trading hours | 24/7, including weekends |
| Intermediary | Multiple layers | Simplification through smart contracts |
| Post-transaction costs | Base level 100% | A decrease of approximately 35 to 65% (industry estimate) |
| Payment error | Base level 100% | Potential reduction of approximately 90% (DTCC) |
| Utilization of capital | Capital is held as a reserve. | Free up capital by delivering and settling simultaneously. |
| New risks | Counterparty risk, reconciliation lag | Smart contract errors, network congestion, oracle manipulation. |
| Status 2026 | Operating smoothly, now switched to T+1. | Pilot and phased implementation |
The figures for cost reduction and error rates are potential estimates based on industry reports, depending on asset type and actual deployment level, and should not be considered as market-wide results.
PART III. STANDARDIZATION AND RISK MANAGEMENT
3.1. Data standardization: ISO 20022
On November 22, 2025, SWIFT completed its transition to the ISO 20022 data standard and officially discontinued the old MT format for core payment messages between financial institutions, after a period of parallel use since March 2023. Prior to this, the US Federal Reserve had already transitioned starting in July 2025. This network covers over 11,000 banks in more than 200 countries. For fintech blockchain, ISO 20022 provides structured and information-rich data, a foundation for automated reconciliation and compliance screening, for interoperability with crypto assets and CBDCs, and for building shared ledgers with enforced rules on fees, rates, and traceability. It's important to note that ISO 20022 is a data standard, not a cryptocurrency certification standard. Self-locating networks that are ISO 20022 compliant, such as XRP, XLM, ALGO, QNT, XDC, and HBAR, are technically compatible but are not officially certified.
3.2. Compliance in 2026: Data Transmission Rules and DAC8
The Travel Rule, or FATF Recommendation 16, requires sender and receiver information to accompany all asset transfer transactions. The FATF updated Recommendation 16 on June 18, 2025, tightening transparency for cross-border transfers above a threshold of approximately $1,000 USD or EUR, with a formal compliance benchmark set for the end of 2030. In Europe, the Regulation on Money Transfers (Regulation (EU) 2023/1113), effective from December 30, 2024, requires sender and receiver information to accompany all transactions between two CASPs without a minimum threshold, along with enhanced due diligence obligations for non-custodial wallets. By 2026, this rule will have expanded to over 40 jurisdictions, but fragmentation between countries and poor interoperability remain major bottlenecks.
DAC8, or Directive (EU) 2023/2226, takes effect on January 1, 2026, with the first calendar year of application in 2026 and the first reporting period due in January 2027, although some operational deadlines have been extended to July 1, 2026. DAC8 integrates the OECD Crypto Asset Reporting Framework (CARF) and a new version of the Common Reporting Standard into European law. Its scope extends beyond Europe; all global crypto service providers with European taxpayer clients are subject to reporting, including cryptocurrency brokers in the United States. Notably, withdrawals to custodial wallets are also considered reporting events. The CARF framework is expected to be automatically adopted by approximately 52 to 76 Global Forum members from around 2027, with the United States following suit. The legal analysis in this section is for informational purposes only and does not replace official legal advice specific to each jurisdiction.
3.3. Infrastructure Risk Management according to the NIST 2.0 Framework
The NIST Cybersecurity Framework version 2.0, released in 2024, adds a Governance function to the five existing functions: Identification, Protection, Detection, Response, and Recovery, emphasizing risk governance at the leadership level and supply chain risk.
| Function | Applicable to infrastructure risks in 2026. |
|---|---|
| Administration | Risk appetite, board liability, custodian provider risk, oracle, bridge |
| Identification | Smart contract mapping, Layer 2 network dependencies, oracle source, hot wallets, and cold wallets. |
| Protect | Contract auditing, signing authorization, asset segregation, access control. |
| Detect | Continuous on-chain monitoring, balance anomaly alerts, price manipulation detection. |
| Response | Incident response procedures, transaction suspension, and crisis communication. |
| Recover | Restoration, reimbursement, post-audit |
Three key technical risk groups include: attacks or failures of smart contracts, including at inter-chain bridges; congestion and latency in Layer 2 networks, affecting settlement and liquidation; and price manipulation via oracles (external price data feeds for smart contracts), particularly dangerous for decentralized derivatives exchanges and price-based lending protocols.
3.4. Payment by crypto card
Crypto cards are one of the most prominent components connecting stablecoins to the real economy in 2026. The mechanism is that users hold stablecoins in their wallets, use the cards to spend at regular stores, and the stores still accept payment as a normal card transaction, thus requiring no new integrations.
The scale is growing rapidly. Crypto card spending increased from approximately $100 million per month in early 2023 to over $1.5 billion per month by the end of 2025, equivalent to about $18 billion per year by early 2026, according to Artemis and CoinDesk. Some recent reports cite a record high of around $7.8 billion and a growth rate of about 230% year-on-year, with the figures varying due to different data collection methods between sources.
In terms of market structure, Visa handles approximately 90% of the on-chain crypto card volume, with USDT accounting for about 62.5% of settled payment value. Visa's stablecoin payment sales are projected to reach approximately $3.5 billion annually in Q4 2025, rising to around $7 billion annually by the end of April 2026. Visa is partnering with Bridge, Stripe's stablecoin infrastructure company, to issue stablecoin cards, starting in 18 markets with Latin America as the first region, and planning to expand to over 100 countries by the end of 2026, through a network of approximately 175 million acceptance points. Mastercard opted for acquisitions, with its purchase of stablecoin infrastructure company BVNK for approximately $1.8 billion, providing end-to-end stablecoin capabilities across a network of over 150 million acceptance points. OKX's stablecoin card runs on the Mastercard network and launched in Europe in January 2026, with grocery spending accounting for approximately 26%, restaurant spending around 18%, and online shopping around 13%.
At the issuer level, crypto-focused entities are experiencing strong growth. Jupiter Global's USDC token, developed by the Jupiter decentralized exchange team on Solana, has seen growth of approximately 648 to 660% in just two months. Rain has reached over $3 billion annually, Reap over $6 billion annually and is heavily geared towards corporate spending, while EtherFi has reached approximately $55.4 million annually. The economic context is that the average global remittance cost remains at around 6.49% according to the World Bank, a benchmark that stablecoin payments aim to improve upon. JP Morgan's scenario analysis places full-year crypto token volume at around $9 billion in a conservative scenario, where growth slows due to reduced rewards and stricter compliance requirements.
3.5. Autonomous artificial intelligence connects directly to the exchange's API.
2026 will see the shaping of autonomous AI-powered commerce (agent commerce), where AI agents independently execute both transaction and payment cycles using stablecoins via APIs. Four layers of protocols are emerging and complementing each other. Coinbase and Cloudflare's x402 protocol, with the x402 Fund launched in September 2025 and version 2 released in December 2025, embeds stablecoin payments into HTTP 402 status codes. By March 2026, x402 will have processed over 119 million transactions on the Base network and approximately 35 million on Solana, with an annual volume of around $600 million, and no protocol fees. Stripe and Tempo's MPP protocol will launch its mainnet on March 18, 2026, with over 100 integrated services. OpenAI and Stripe's ACP protocol standardizes the purchase payment flow, Google's AP2 standardizes the authorization and trust framework, while the ERC-8004 standard provides verifiable identification for AI agents.
A realistic assessment of maturity is needed. While the ecosystem surrounding x402 is highly valued at around $7 billion, actual trading demand remains thin. One analysis notes that the actual daily trading volume of x402 is only about $28,000, largely consisting of test trades, and the number of trades fluctuates greatly between months, from a peak of around 731,000 trades per day in December 2025 to around 57,000 in February 2026.
CONCLUDE
In 2026, compliance capabilities will become a core competitive factor for exchanges, as the July 1st deadline for MiCA, along with DAC8 and data transmission rules, will simultaneously raise operational standards. Mid-sized exchanges will face the greatest pressure on their profit margins.
The convergence between traditional and decentralized finance is the mainstream, with crypto assets with clear legal status such as RWAs and deposit tokens driving institutional growth. The total value locked in DeFi is projected to reach approximately $94 billion by March 2026, with liquidity staking and lending being the two largest segments, and restaking growing the fastest.
Crypto card payments have reached real-world scale, with monthly spending in the billions of USD and Visa holding approximately 90% of the volume on the chain. Atomic payments and AI-powered payments are still in the pilot or partial deployment phase as of mid-2026.