BEAT, NEAR, and DeXe are three notable altcoins this week, each experiencing double-digit Token thanks to strong buying pressure pushing prices toward key resistance levels.
All three altcoins are trading significantly higher than their previous price levels. However, the upward momentum is stretched thin, and declining volume on some charts raises questions about how long this rally can last.
BEAT leads notable altcoins with a target of $5.
Audiera (BEAT) is currently trading around $4.37, up over 65% in the last 24 hours. The Token ranks 61st by market Capital with approximately $1.26 billion.
On the daily chart, BEAT just completed an extended rounded Dip pattern resembling a "cup-and-handle" or double Dip, before a strong breakout at the end of May 2024. Following that, the price of BEAT showed three consecutive large green candles.
This breakout has helped BEAT surpass previous highs and is now approaching its all-time high of nearly $4.91. If it clearly breaks through this level, BEAT could target the Fibonacci level of $4.97, coinciding with the psychological mark of $5.
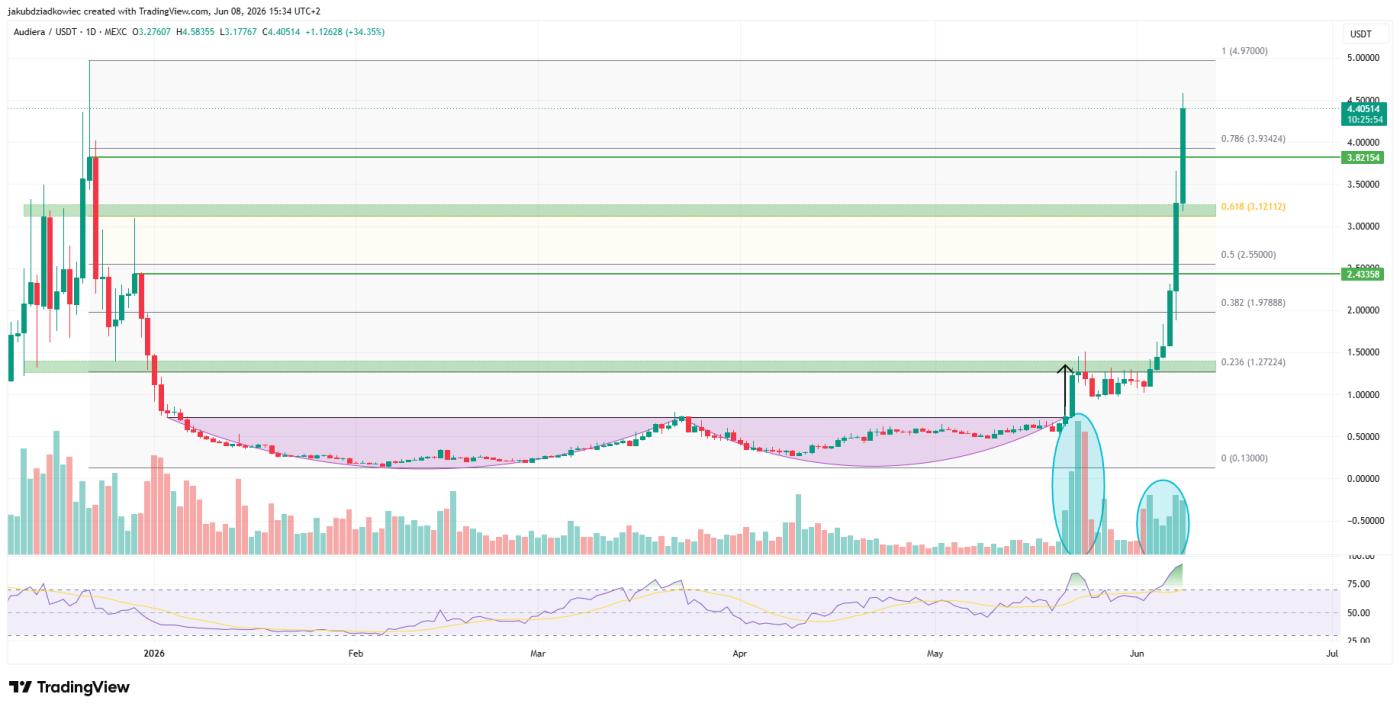 BEAT daily chart. Source: Tradingview
During the price increase, BEAT experienced two surges in volume – at the end of May 2024 and during the current upward trend (blue area). The RSI indicator on the daily timeframe has risen very high, approaching the overbought zone at 93, however, there is still no sign of bearish divergence.
If a correction occurs, the first support zone will be the previous high at $3.83, followed by the previous high at $2.43. The 0.618 Fibonacci level at $3.12 and the 0.236 level at $1.27 will be deeper support levels.
BEAT continues to be one of the standout altcoins on the daily chart, but a drop to $2.43 would weaken its bullish outlook.
NEAR price regains the $2 mark, targeting $2.80.
NEAR Protocol (NEAR) is currently trading around $2.15, up approximately 13% on the day. The Token ranks 36th by market Capital at around $2.79 billion.
NEAR began a renewed uptrend in February 2024 and broke through the key resistance level near $1.40 on May 18, 2024. The subsequent rally reached the $2.80 region – above the 0.786 Fibonacci level at $2.68, where sellers blocked the price twice in a row (red arrows).
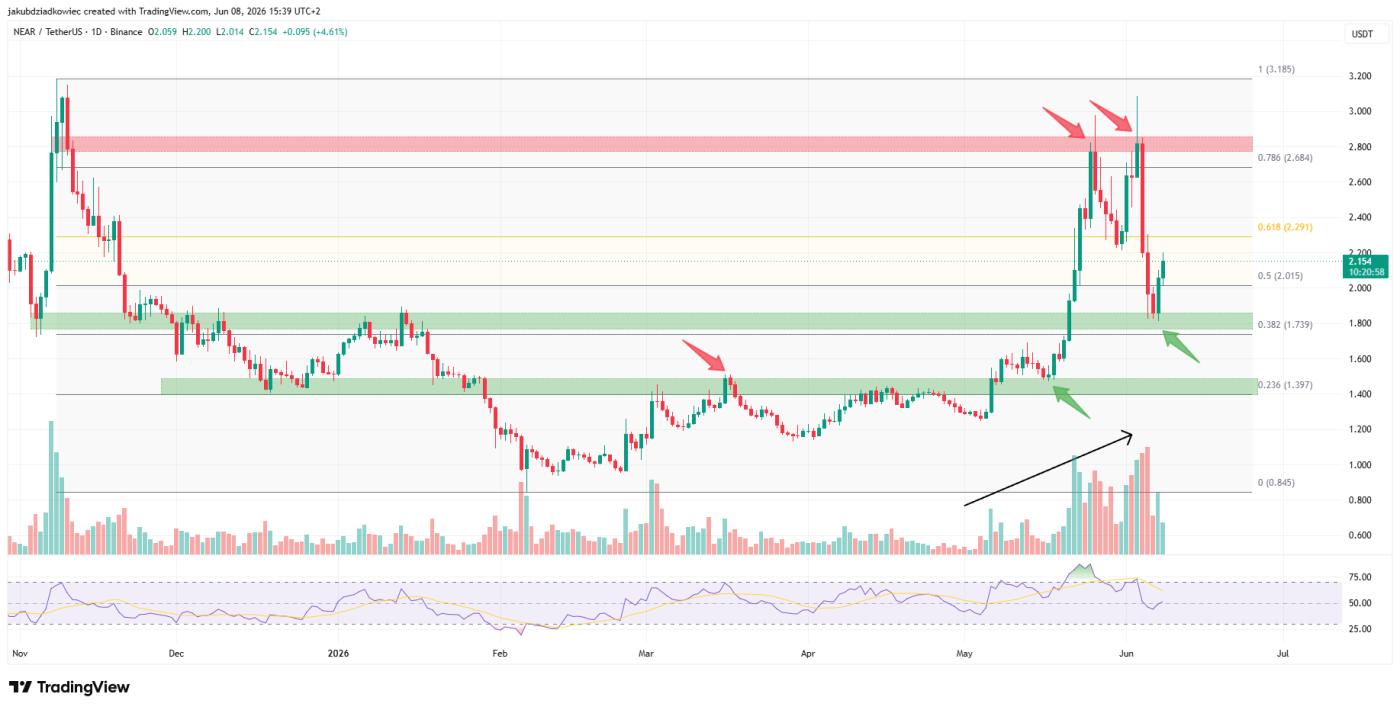 NEAR daily chart. Source: Tradingview
Subsequently, NEAR corrected to the support zone just above the 0.382 Fibonacci level at $1.74 and bounced back. Currently, NEAR has retraced to the 0.5 retracement level at $2.01, indicating that buying pressure remains quite strong. Our previous NEAR price forecast also identified a similar price structure. Also Read .
If the support zone at $1.74 holds, the next target will be the 0.618 Fibonacci level at $2.29. Following that, a third price test will be conducted at the resistance zone of $2.80. Currently, volume is increasing in both directions, indicating both buyers and sellers are participating. The RSI indicator remains in the neutral zone, not yet showing a clear upward or downward trend.
Third notable altcoin: DeXe tests $24 resistance amid declining volume.
DeXe (DeXe) is currently trading around $22.82, up approximately 16% this week. The Token ranks 66th by market Capital , at around $1.07 billion.
On the weekly chart, DeXe has been steadily rising for months in a near-parabolic trend, starting from its early 2026 Dip of around $2. Last week, DeXe tested the $24 target zone, coinciding with the Fibonacci 1.0 level at $24.20, with a high of $23.26. This recent surge in DeXe is considered one of the strongest drivers among mid - cap altcoins.
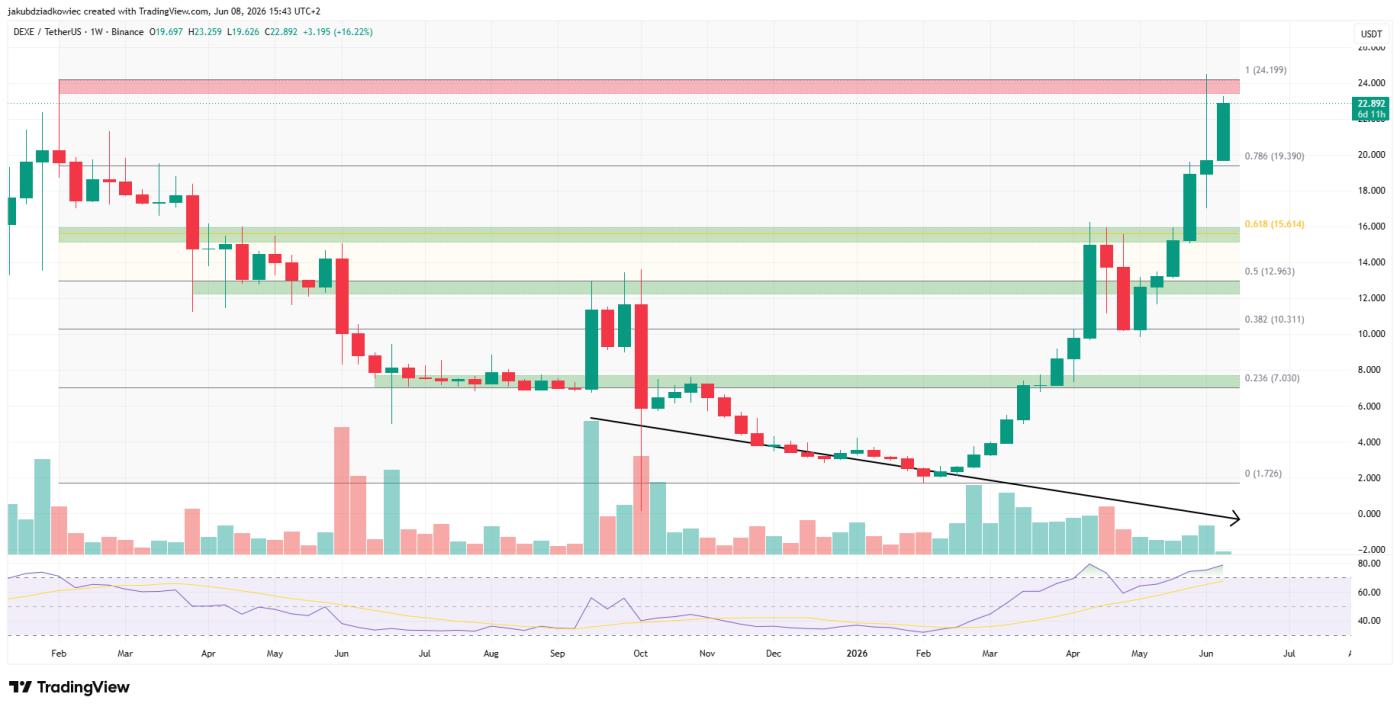 DeXe weekly chart. Source: Tradingview
However, throughout the price increase, volume has tended to decrease, which does not confirm the true strength of the upward momentum. In addition, the RSI indicator on the weekly timeframe has approached 79, close to the previous peak around 80. If a bearish divergence appears, the DeXe may correct downwards.
When the price corrects, the first support zone is the 0.786 Fibonacci level at $19.39, followed by a stronger level at 0.618 near $15.60. For a more detailed look at the current trend, you can XEM the DeXe price forecast here .
Currently, DeXe will either break through the $24 level to continue its uptrend, or fail there and potentially retest the support levels below.