No significant increase in buying interest has yet emerged to form a solid bottom.
Written by: Chris Beamish, CryptoVizArt, Antoine Colpaert, Glassnode
Compiled by: Chopper, Foresight News
TL;DR:
- The AVIV index Z-value fell to -1.09, and then further declined to -1.06, indicating that the current price has entered a deeply oversold range relative to the cyclical average. The price failed to rebound effectively at these low levels, and market panic continued to spread.
- Over 95% of short-term holders are in a loss-making state, and the proportion of profitable short-term holders has only slightly rebounded to 3.3%, far below the four-year average of 55%. The market fundamentals are fragile and highly susceptible to external shocks.
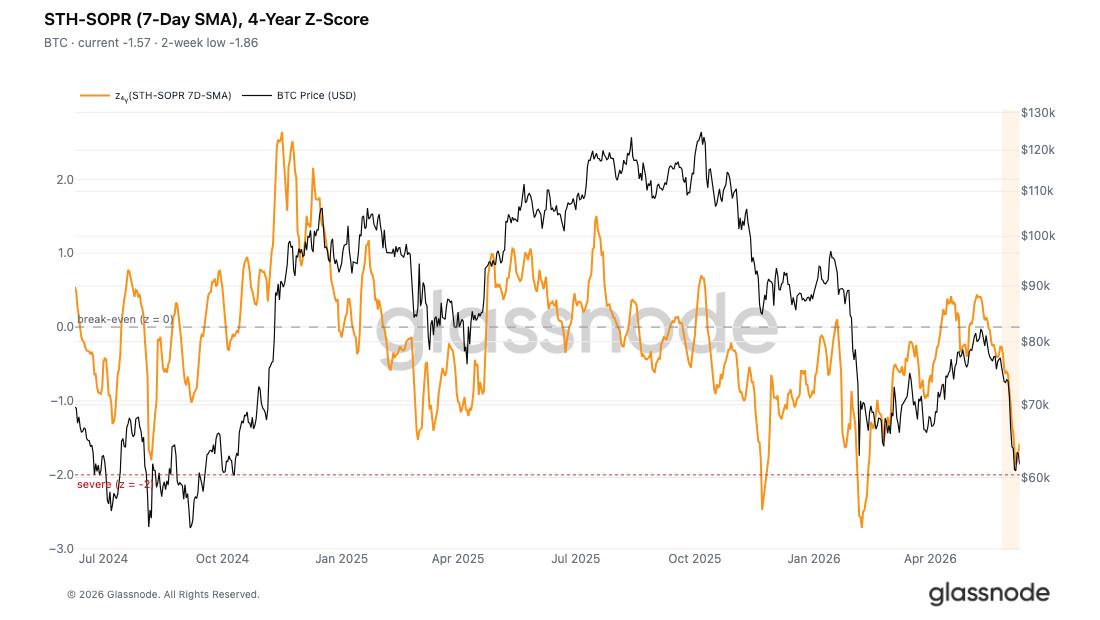
- The realized profit/loss ratio (STH-SOPR) Z-score for short-term holders hit a low of -1.86, just shy of the -2 threshold for deep panic selling. This indicates that stop-loss behavior is intensifying, but has not yet reached the selling pressure intensity historically capable of triggering a sustained rebound.
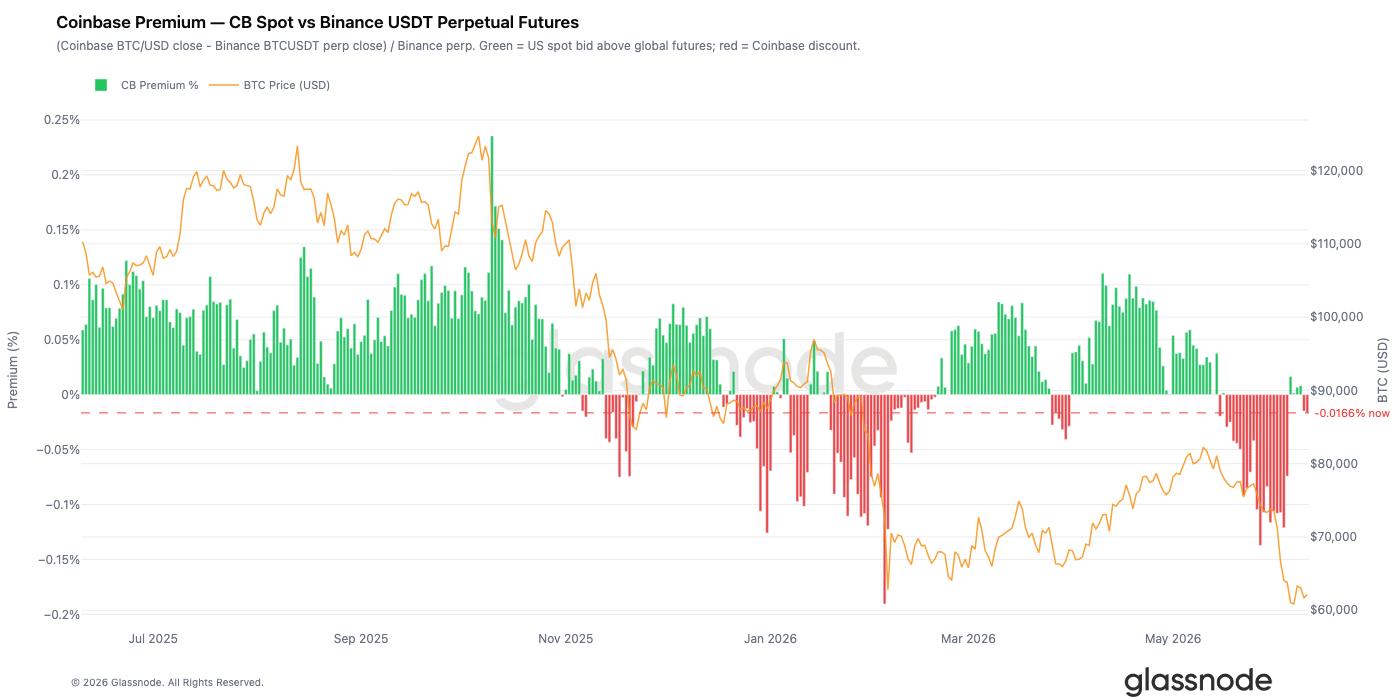
- Demand from US institutions has cooled significantly. During Bitcoin's pullback towards $60,000, Coinbase spreads remained at a discount, reflecting a lack of institutional buy the dips activity in the platform's spot market.
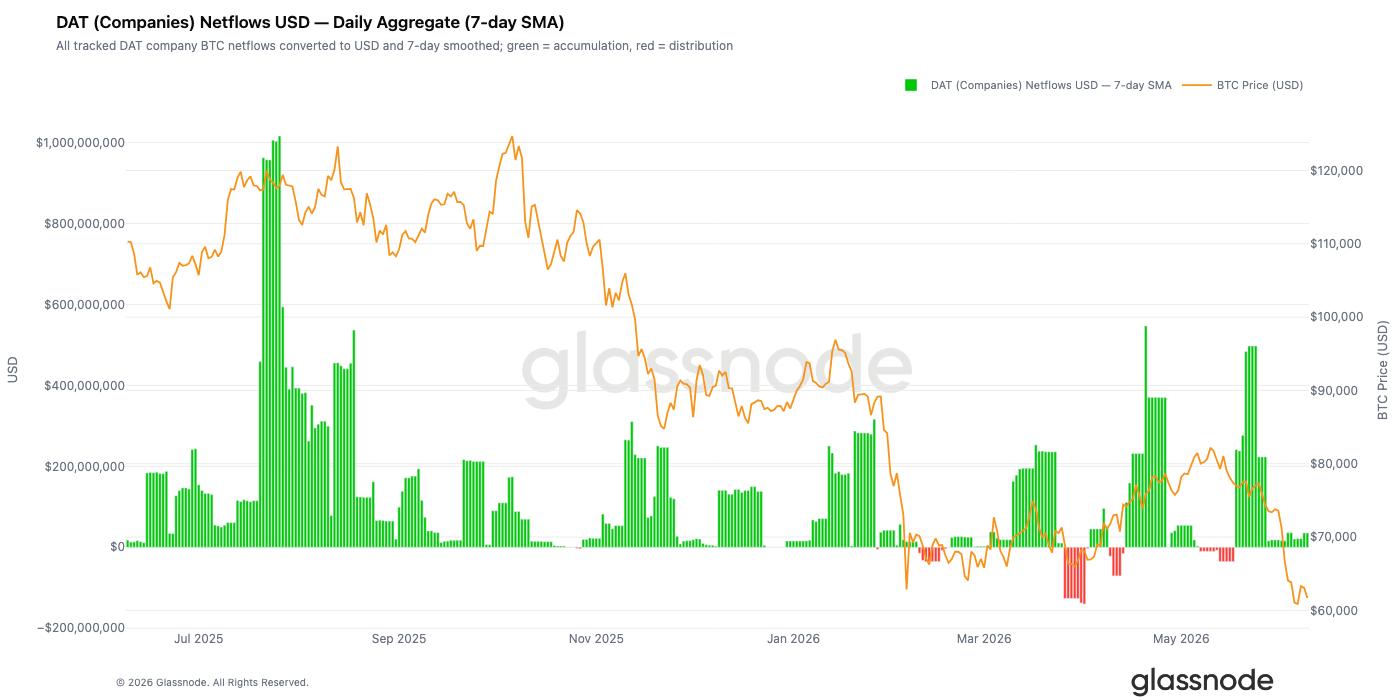
- Corporate treasuries have significantly slowed their pace of Bitcoin accumulation. Since June, net daily institutional buying has fallen from a peak of over $500 million to near zero, indicating the withdrawal of another major market support force.
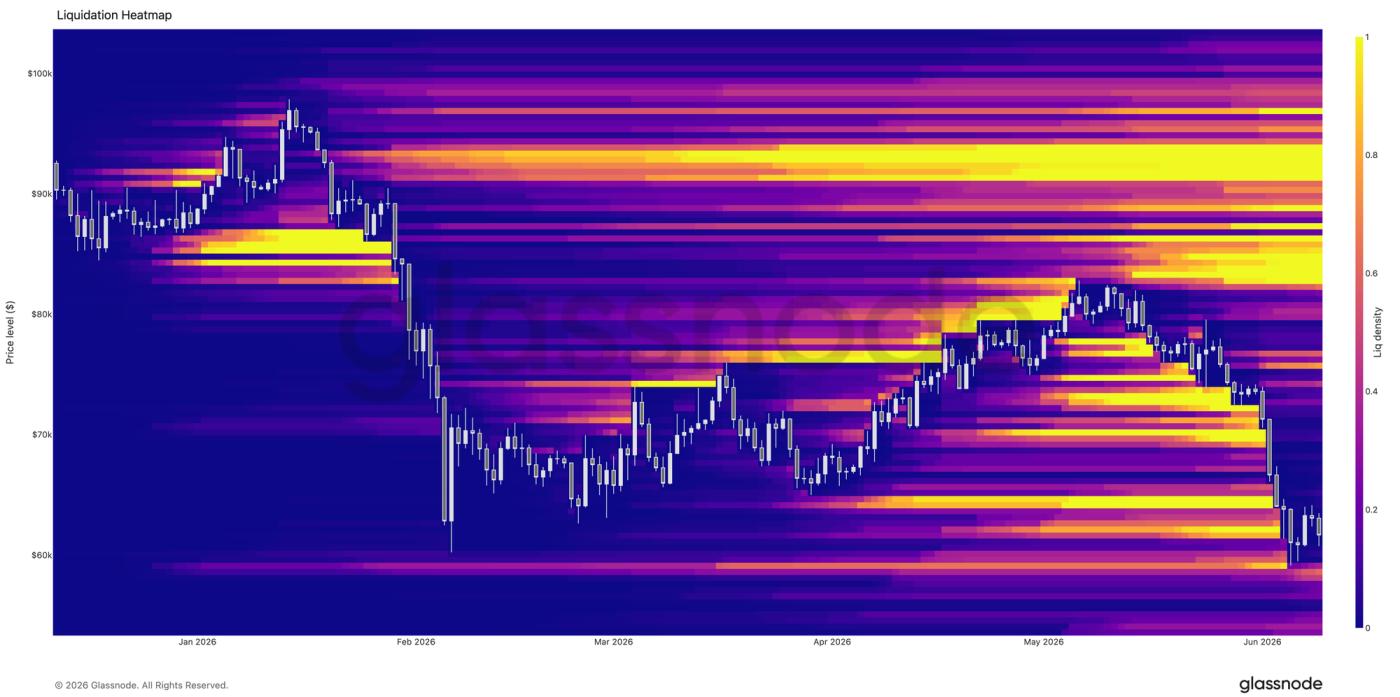
- After Bitcoin broke through a key support level, the market experienced a large-scale deleveraging process, with a large number of leveraged long positions being liquidated, clearing out excessive speculative positions in the market.
- After Bitcoin broke below its trading range, implied volatility surged. Volatility risk premiums continued to rise, and the uncertainty priced into the options market far exceeded the risk level corresponding to recent actual market volatility.
- Volatility skew indicators for options across all maturities surged, indicating a significant increase in market demand for downside protection tools, with traders paying higher premiums for put options.
- Market trading was predominantly defensive, with the largest negative gamma exposure concentrated around $65,000, a price level not far from the current spot price.
Macro Market Insights
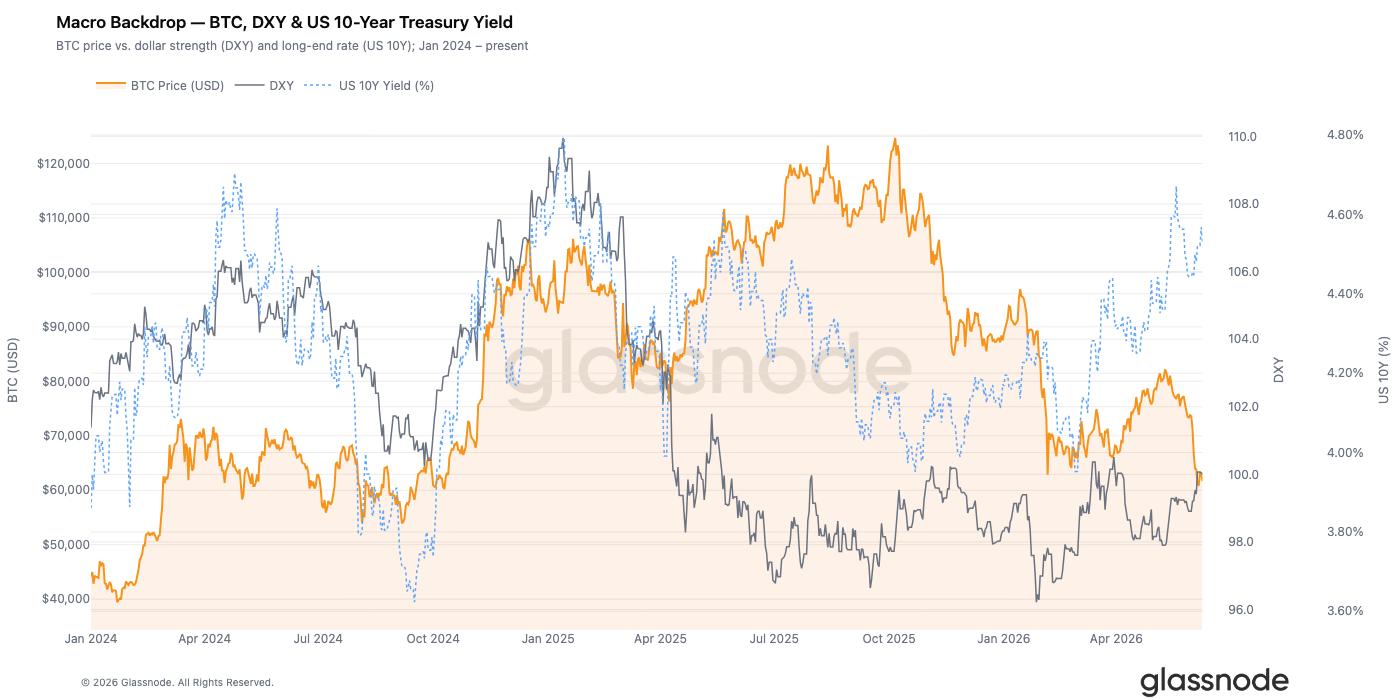
The US dollar index closed at 100.01, up 0.8% for the week and 2.1% over the past 30 days. The dollar continued to strengthen as global liquidity tightened over the past month. The yield on the 10-year US Treasury note remained at 4.53%, while the yield on the 2-year Treasury note was 4.14%, with a spread of 0.39% between the two. The yield curve suggests that the US economy is at the end of its cycle, and the Federal Reserve has not yet made any substantial adjustments to its monetary policy.
Bitcoin fell 7.5% this week, currently trading at $61,700, influenced by unfavorable macroeconomic factors. After a period of divergent price movements, the negative correlation between a stronger dollar and pressure on crypto assets, which emerged between 2022 and 2023, has reappeared. The US dollar index has stabilized above 100, coupled with the 10-year US Treasury yield exceeding 4.5%. Historically, such a combination of interest rates and the dollar typically compresses the speculative premium of risk assets.
For Bitcoin to experience a sustained rebound, one of two conditions needs to be met: the US dollar index needs to effectively fall below 99, or the 10-year US Treasury yield needs to fall back to around 4.2%. Neither condition has been met yet.
On-chain data analysis
Valuation is deeply oversold
As pointed out in the previous analysis, the rally in May was a bear market rebound. The short-term holders' cost basis has fallen below the true market average for the first time since January 2022, a signal that the market has entered the later stages of a bear market. This analysis will continue to examine the subsequent pullback, including the price dropping to $59,000 and the subsequent fragile sideways consolidation.
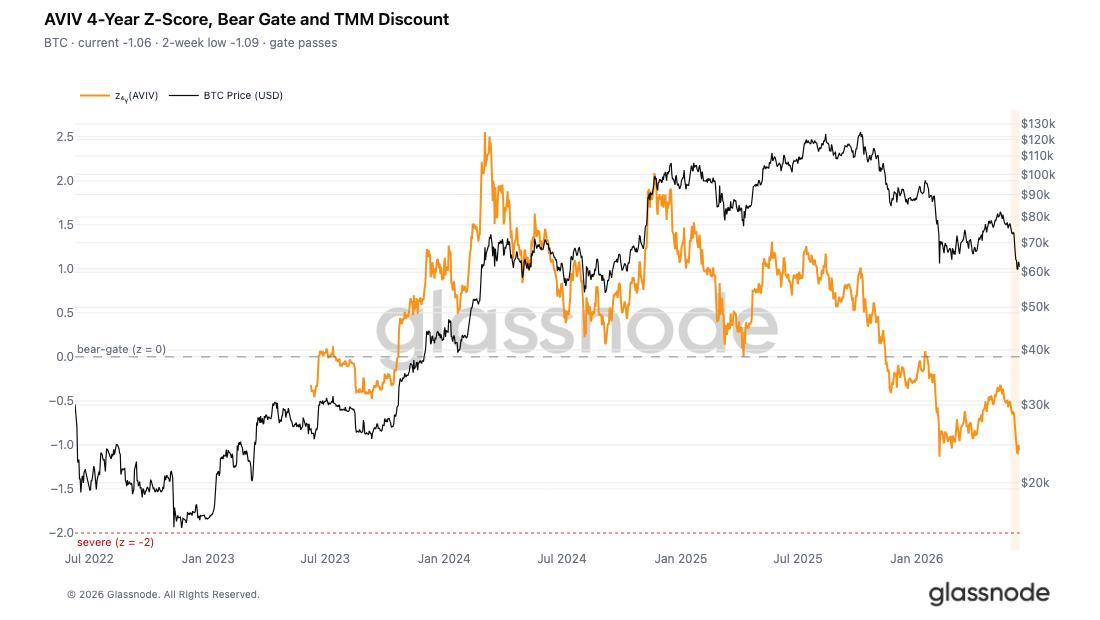
We use the AVIV (Active Investor Value Deviation) metric to determine the extent to which the current price is oversold relative to the cyclical average. This metric compares the spot price with the true market average (the combined cost of active investors' holdings excluding miners' positions). Its four-year Z-score measures the degree of price deviation from this benchmark, with a Z-score of 0 representing the dividing line between valuation premium and discount.
The current AVIV indicator is 0.80, corresponding to a Z-value of -1.06. It touched a low of -1.09 in the past two weeks, indicating that the current valuation is in a deep discount zone within its historical range. The fact that prices have failed to rebound effectively from their cyclical lows over the past week is sufficient proof that market panic has not subsided.
New investors are all trapped.
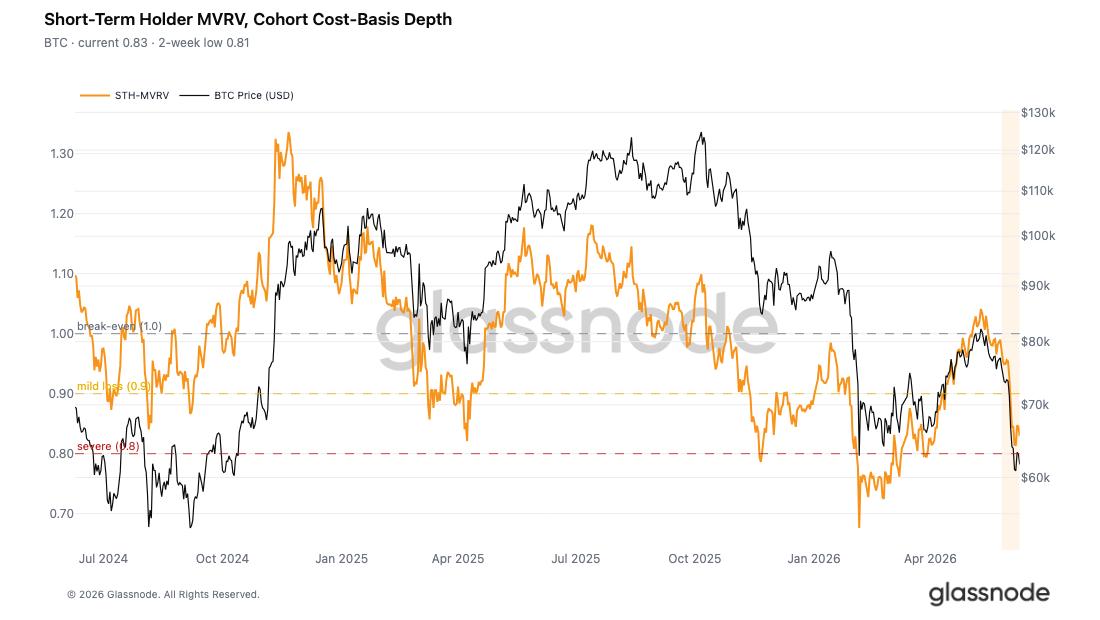
In light of the overall market discount, we analyze the situation of recently entered funds separately. The Short-Term Holders Market Value/Realized Market Value Ratio (STH-MVRV) compares the spot price with the holding cost of short-term holders. A value below 1 indicates that this group is generally in a state of unrealized loss.
The indicator recently fell to a low of 0.81, then rebounded slightly to 0.83, meaning that new investors are experiencing an average unrealized loss of 17% to 19%. This confirms that the densely held positions formed in the $78,000 to $82,000 range during May have now generally resulted in losses, consistent with the previous assessment that "new investors are under pressure."
A brief period of price stabilization at low levels is a common pattern in a downtrend. Once the investors who have suffered the most significant losses have completed their initial forced selling, the remaining market participants will enter a wait-and-see mode. Whether this sideways movement can ultimately form a valid bottom or is merely a consolidation phase within a downtrend depends on whether new buying interest emerges at the current price level.
95% of short-term holders incur losses.
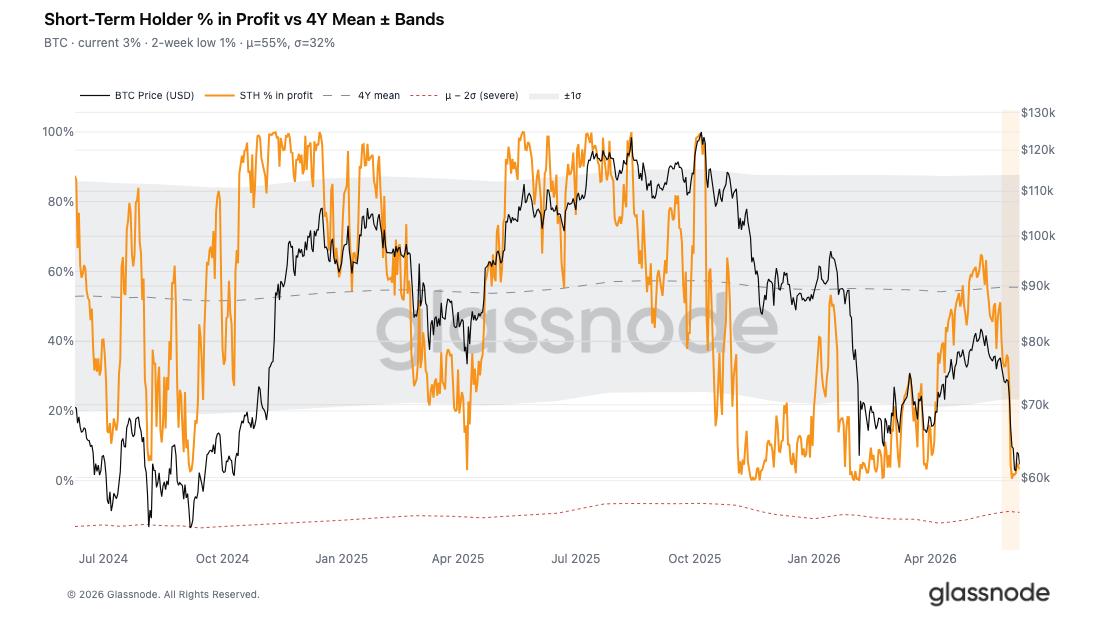
To further assess the pressure on short-term holders, we refer to the short-term holders' profitable position ratio indicator. This indicator counts the proportion of profitable short-term positions in total short-term positions, used to determine the extent of losses, and is different from indicators that simply measure the magnitude of unrealized losses.
This indicator recently hit a low of only 0.6%, before rebounding slightly to 3.3%, well below the four-year average of 55%. In reality, over 95% of short-term holders are currently operating at a loss. This level of loss historically falls within a significant capitulation range, where new investors are generally under pressure, leading to a fragile market structure highly susceptible to any negative external factors.
The market is almost entirely losing money, and related indicators have not shown any significant recovery, which is enough to show that the current sideways trend is just a temporary exhaustion of selling pressure, not the completion of the market bottoming out.
The market is nearing the point of panic selling.
In addition to unrealized losses, actual selling by investors further confirms the current severe market situation. Using a four-year average as a benchmark, we calculated the seven-day moving average realized profit/loss ratio (STH-SOPR) of short-term holders using the Z-score to measure the intensity of loss realization by new investors in this cycle.
The current Z-value of this indicator is -1.57, with the lowest point in the past two weeks being -1.86, which is only 0.14 standard deviations away from the historical deep panic selling threshold of -2.
Currently, short-term holders are increasingly frequently and rapidly cutting their losses, which corroborates the previous report of a total daily loss of $1.35 billion and the deep unrealized losses reflected by short-term holders MVRV mentioned earlier. However, the ultimate panic selling that historically triggers a medium- to long-term rebound has yet to materialize.
The market is currently in an awkward middle ground: the scale of losses realized is sufficient to confirm the depth of the bear market, but it has not yet reached the standard of completely clearing out selling pressure and building a solid bottom.
Off-chain market insights
Coinbase price spreads have completely disappeared.
The Coinbase spread metric tracks the difference between the Coinbase spot price and the Binance perpetual contract price, serving as an important indicator of institutional demand in the United States. When the Coinbase price shows a premium, it indicates that institutions are actively buying spot Bitcoin, pushing up the platform price and making it higher than the offshore contract market price.
The market landscape has completely reversed in recent weeks, with the price difference remaining at a discount. As Bitcoin fell towards $60,000, buying interest in the US spot market cooled across the board. The bargain hunting that typically occurs during pullbacks failed to materialize this time, with institutions generally choosing to remain on the sidelines, and another important support level disappearing from the market.
Corporate Treasury Demand Cools Down
From April to May, corporate treasuries continued to increase their Bitcoin holdings, becoming a core supporting force in the market, with several instances of net daily purchases exceeding $500 million. However, since June, this demand has weakened significantly.
During Bitcoin's pullback from above $75,000 to $60,000, net buying by corporate treasuries shrank significantly, with daily purchases falling to a fraction of previous levels. While companies are still net buyers overall, the reduced pace of purchases suggests that this group is becoming more cautious about risk. Marginal buying further decreased in the context of overall market pessimism.
Deleveraging is expected to begin below $70,000.
Liquidation heatmap data shows a large number of leveraged long positions concentrated in the $64,000 to $70,000 range. Last week, Bitcoin experienced a rapid decline, leading to a concentrated liquidation of these long positions within this range. This cascading liquidation pushed the price briefly below $60,000 before finding support.
The current long position liquidity in the recent trading range has been largely exhausted, and the market has completed a large-scale deleveraging process. Compared with the data from a week ago, the current leveraged position structure is healthier, and the large amount of excessive speculative leverage accumulated during the recent trading range has been largely cleared out by the market.
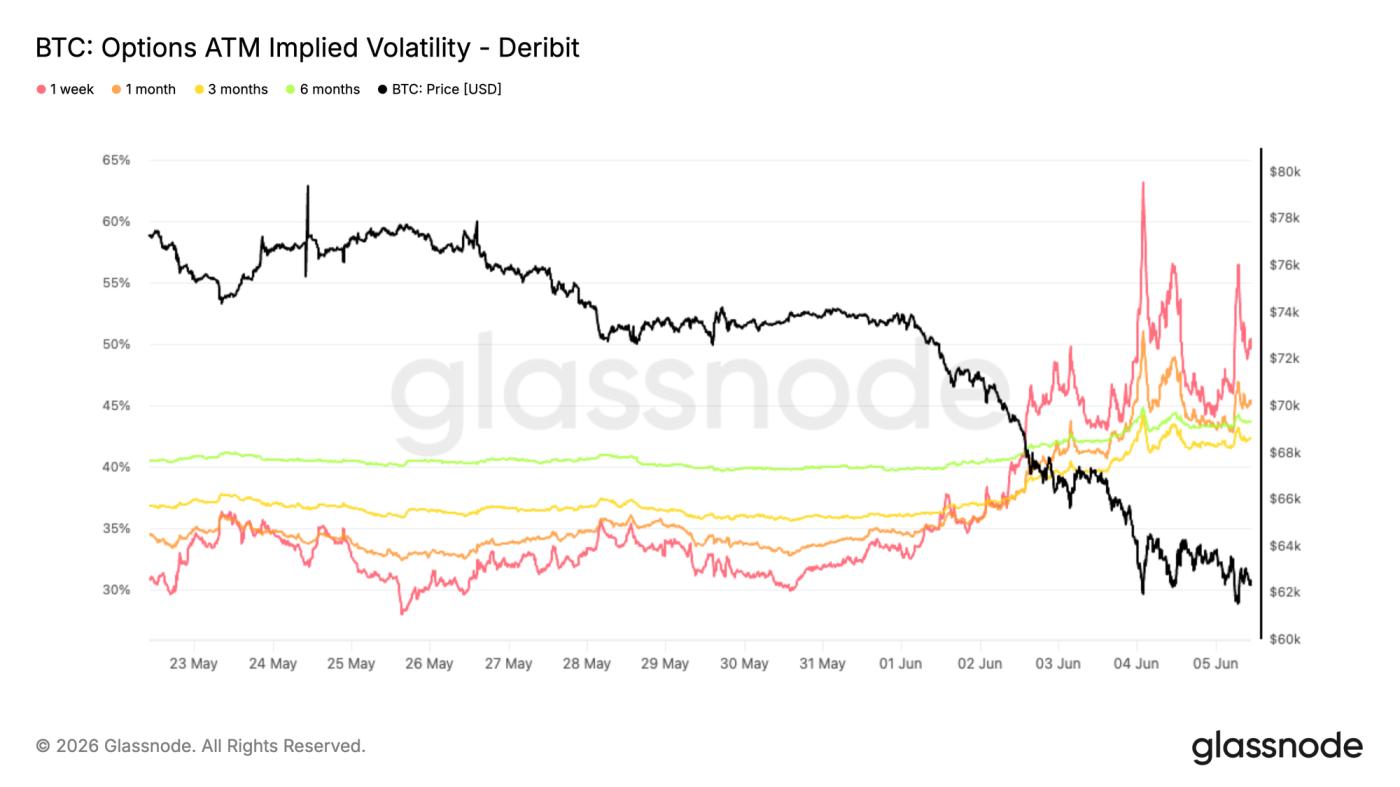
Implied volatility rose sharply
After Bitcoin broke out of its months-long trading range, the full-term volatility surface is undergoing repricing, and as spot prices approach February lows, demand for options instruments is rising across the board.
Short-term volatility reacted most sharply. The implied volatility of one-week at-the-money options surged to over 60% before falling back to around 50%; the implied volatility of one-month options rose from about 34% to 45%. Longer-term options rose in tandem, with the implied volatility of six-month options rising from around 40% to 44%.
This surge in volatility reflects a comprehensive reassessment of future uncertainties by the market, rather than a short-term emotional disturbance. Although volatility has fallen from its peak, demand for options hedging tools remains strong. Even with a brief stabilization in spot prices, traders are still willing to pay higher costs for risk protection. This round of decline has fundamentally altered market expectations for volatility, with hedging costs rising across all maturities, and market risk aversion remaining high.
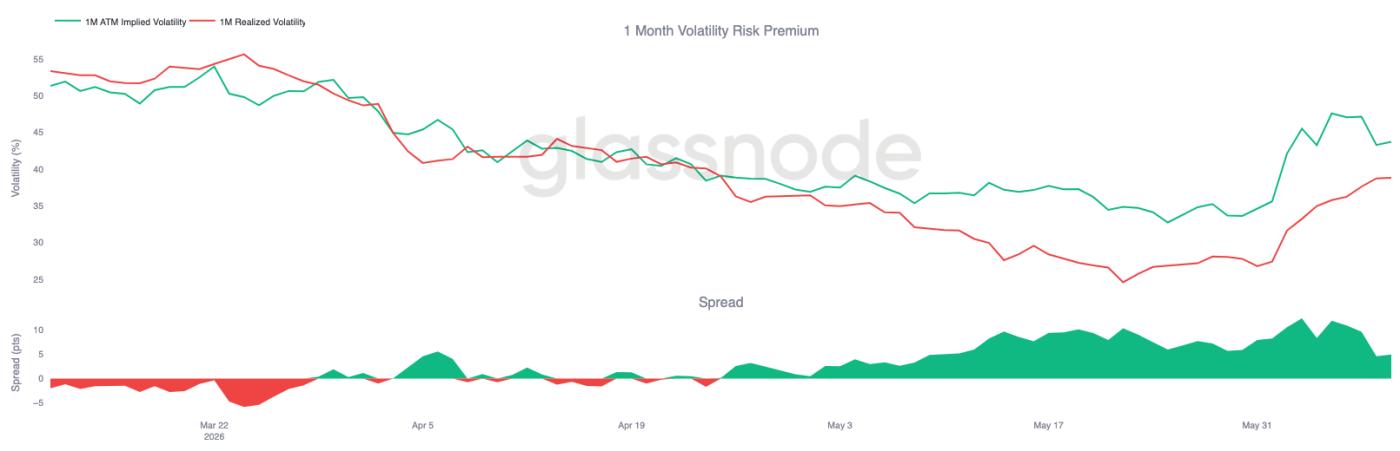
Volatility risk premium remains high
After a significant increase in implied volatility, a comparison between implied volatility and realized volatility reveals that the volatility of future market movements priced in by the options market is still higher than the recent actual volatility of the spot market.
The implied volatility for the one-month contract rose from around 35% to 44%, while realized volatility also increased from 27% to 39% during this round of decline. Both indicators rose in tandem, but the increase in implied volatility was more aggressive, and the volatility risk premium remained positive.
After prices broke through key support levels, the market urgently reassessed risks, and volatility spreads widened to as much as 10 volatility points. While the spreads have narrowed somewhat, option prices remain above the reasonable level corresponding to actual market volatility. This reflects the market's widespread expectation of continued sharp fluctuations in the future.
The uncertainty surrounding future pricing in the options market far exceeds the risks reflected in recent market movements, thus keeping volatility risk premiums at a persistently high level.
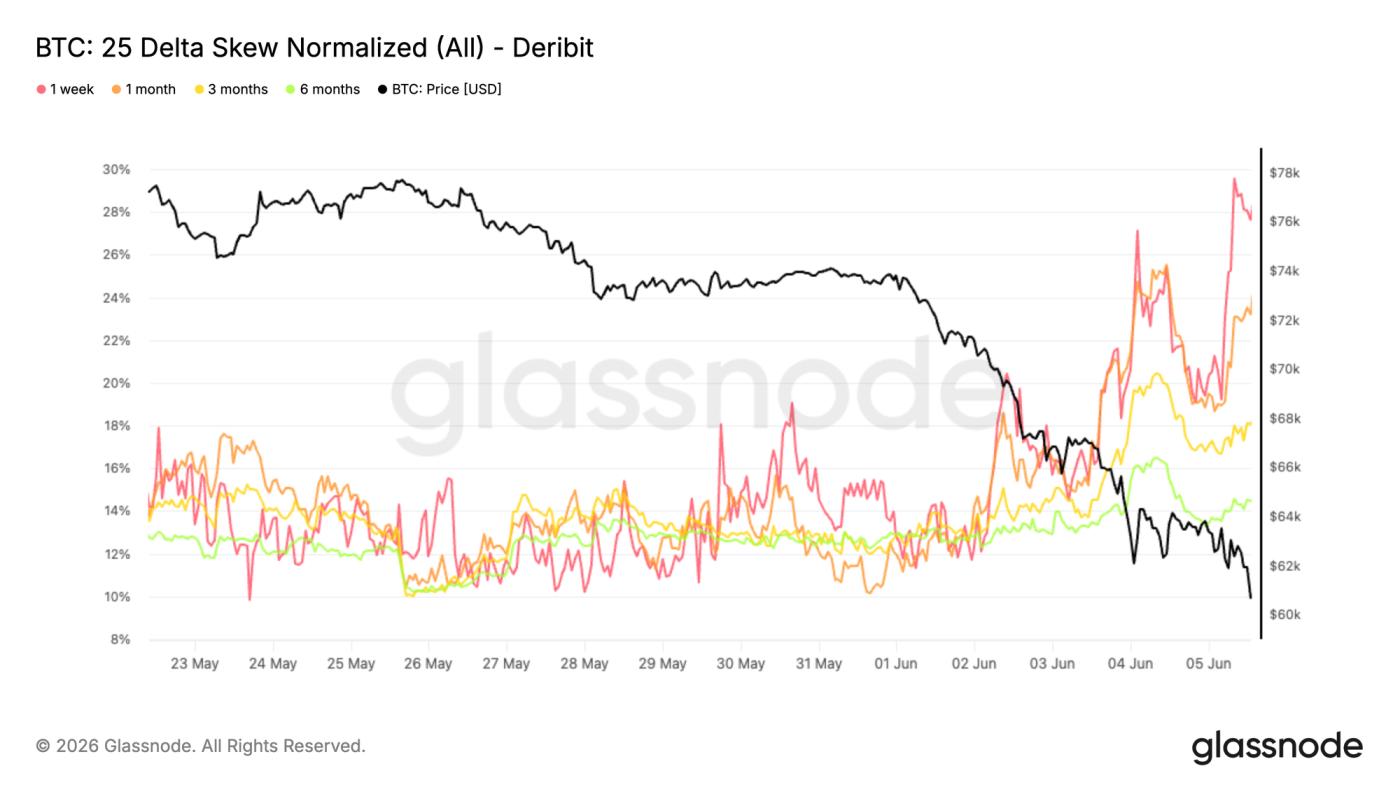
25-Delta volatility skew has increased significantly.
Against the backdrop of an overall increase in volatility premiums, volatility skew indicators can clearly reflect the direction of capital allocation. During Bitcoin's break below support and test of its February lows, traders concentrated on buying downside protection tools.
Volatility skew is calculated by subtracting call option volatility from put option volatility. A positive value indicates that the price of a put option is higher than that of a call option with equivalent conditions. This round of decline has led to a collective increase in skew indicators across all maturities: the one-month skew rose from around 11% to 24%, while the three-month and six-month skew climbed to 18% and 14%, respectively.
Short-term indicators reacted most strongly, with one-cycle skew approaching 30% at one point. During a downtrend, the market's demand for short-term downside hedging surged. If rising implied volatility indicates market-wide risk aversion, then volatility skew clearly points to a single direction—a concentrated deployment of funds to hedge against downside.
As market conditions continue to weaken, the demand for downside protection has increased significantly, and traders are paying higher premiums for put options.
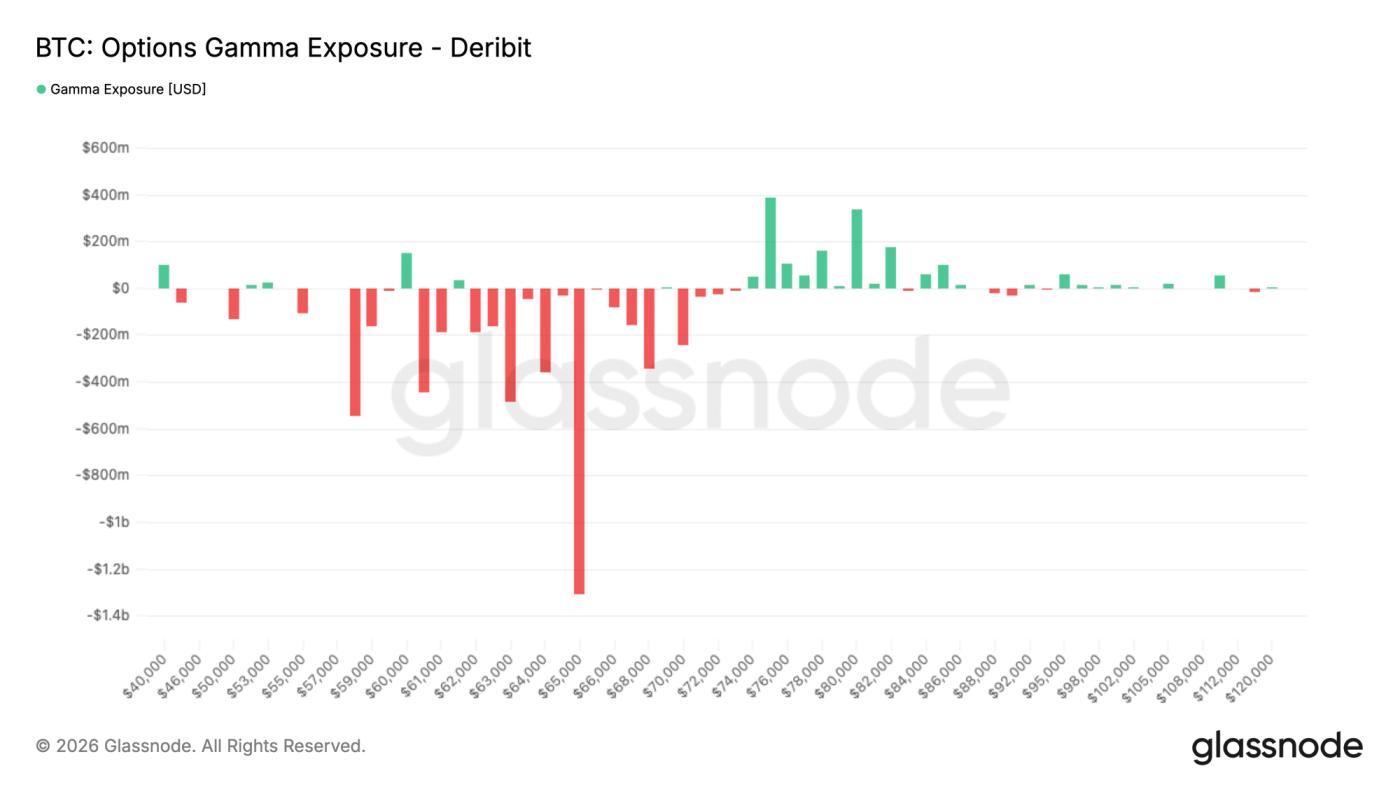
A large amount of gamma exposure has accumulated around $65,000.
Besides option prices, gamma exposure can determine the strike price at which option market makers' hedging behavior has the greatest impact on market conditions.
The current market trading style is generally defensive. Over the past seven days, put option trading volume accounted for 32.4% of total options trading volume; in the last 24 hours, this proportion further increased to 35.9%. Even after a sharp decline, market trading remains dominated by buying downside protection.
Trading activity is directly reflected in the gamma exposure structure: currently, the largest negative gamma exposure is concentrated at $65,000, with a significant amount of negative gamma exposure also distributed in the $59,000 to $70,000 range. Bitcoin's current price is around $62,000, and the spot price is just below the largest short-term negative gamma range. Positive gamma exposure, on the other hand, is mainly concentrated in the higher $76,000 to $82,000 range.
Defensive trading dominated the market makers' position structure, with the market's largest negative gamma area located around $65,000, very close to the current spot price.
Summarize
The current market exhibits typical characteristics of a late-stage bear market correction: recent investors are deeply trapped, the market has already incurred substantial losses, and multiple core buying forces are weakening.
Bitcoin's pullback to $60,000 triggered a massive deleveraging process, resulting in a concentrated clearing of speculative positions in the market. Leverage levels returned to reasonable levels, but the spot market has consistently failed to attract any significant new buying interest.
The options market maintained a defensive stance overall, with high implied volatility and strong demand for downside hedging. Market makers' key exposures were also closely tied to current spot prices. Coupled with declining institutional participation and reduced corporate treasury spending, this clearly indicates a persistently low market risk appetite.
Based on various data points, the market is gradually entering a phase of deep panic selling. Although market leverage has been largely cleared and valuation indicators have fallen to historically deep discount ranges, the incremental buying that historically corresponds to the formation of a solid bottom has yet to materialize.