According to data from CryptoQuant, Bitcoin (BTC) demand has fallen to levels seen only three times since 2019. Over the past 30 days, total demand from the spot and perpetual Futures Contract markets has dropped to a negative 650,000 BTC.
Another indicator from Capriole Investments also shows a similar trend. The Apparent Demand indicator is near the Dip of its 4-year range, while the price of BTC is currently trading near $62,800.
CryptoQuant records a rare contraction in Bitcoin demand.
There are only two similar levels recorded on the chart, appearing before the COVID-induced decline in early 2020 and during the bear market period in 2022.
The manner of the decline is equally important in terms of depth. Demand from both the spot and perpetual Futures Contract markets is falling simultaneously. Thus, the weakness doesn't just come from leveraged speculators, as mentioned inCryptoQuant's previous warning about demand imbalances.
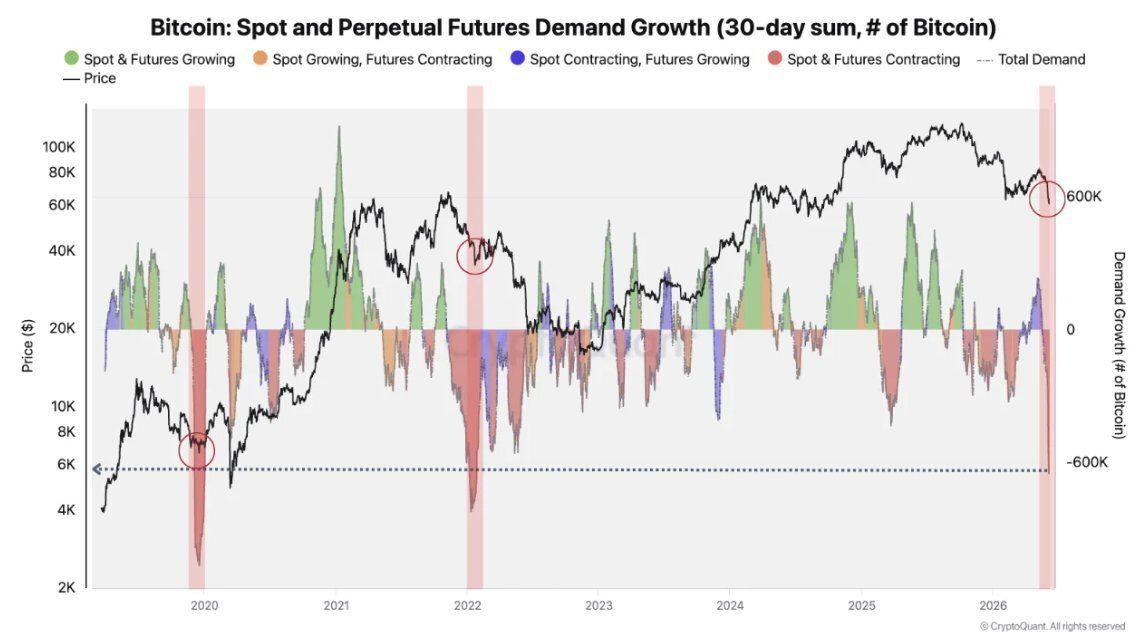 Increased demand for spot and perpetual BTC Futures Contract . Source: CryptoQuant
In a QuickTake post, CryptoQuant expert MoneroDV_ argues that this indicator signals the beginning of a new, unpredictable period of volatility, rather than the end of a correction. He Chia on the CryptoQuant website:
“The most likely scenario is that the market will experience significant volatility, followed by a price ‘paradox’: weak momentum, reduced trading activity, and prolonged price stagnation. This phase could demoralize retail investors even more than a sharp sell-off.”
History also points to a very noteworthy point. At a deeper level, the area below -650,000 BTC often marks the beginning of a period of instability, not a true Dip . The rallies to higher support zones coincide with the Dip periods in March 2020 and late 2022. If similar developments occur, it would be the first signal of a trend reversal.
Capriole data confirms the weakness but has noteworthy points.
Charles Edwards, CEO of Capriole Investments, also highlighted another negative signal this week. The Apparent Demand Index assesses whether new buying volume is sufficient to absorb newly issued coins and the amount of older coins being sold back into the market.
This indicator currently shows a negative level of 8,761 BTC. This is the lowest level in the last 4 years, down 2.6%. Meanwhile, the 30-day trend is almost always negative, signaling that the weak situation could continue for the next 7 to 30 days. Edwards commented on X :
"Wow. Bitcoin rarely performs positively when the Apparent Demand index drops."
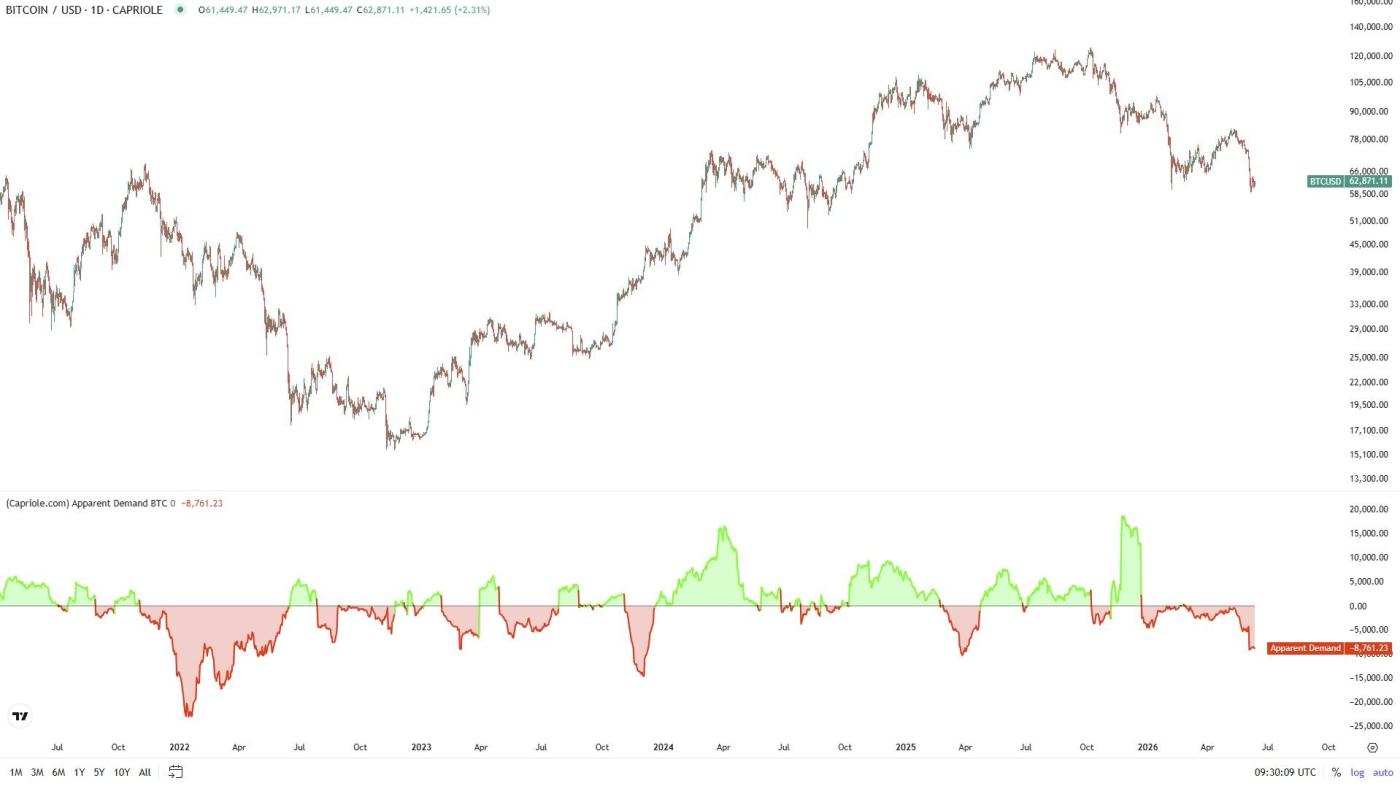 BTC Apparent Demand Index / Source: Capriole
However, this indicator also has its own caveats, complicating the bearish argument. Capriole's analysis indicates that the direct predictive statistics from this indicator are quite weak, showing almost no strong correlation with future price trends.
Therefore, this indicator should be XEM as a secondary factor reinforcing the bearish view rather than a primary driver of price. This sets it apart from the clearer signal from CryptoQuant, which is currently leading the bear market discussion.
The BTC price forecast depends on the support level of $59,000.
According to market data, BTC is currently trading around $62,833 at the time of writing, up 2.7% from 24 hours ago. This price is still nearly 50% lower than the cycle peak of over $120,000 reached at the end of 2025.
The continuous outflow of Capital from Bitcoin ETFs in the spot market during May and June reduced the primary buying interest. With demand growth deeply negative, there is little new buying power available should another sell-off occur.
The June Dip near $59,000 is now a crucial support level, approximately 6% above the current price. A breach of this level could send prices plummeting to around $53,600, a drop of about 15%. Previous studies have also identified this as a historical Dip for the market.
Conversely, if the BTC price closes above $66,000 each day, the bearish outlook weakens, indicating signs of recovering demand. This reversal in Capital flows into Bitcoin ETFs is likely to be the impetus for a new bull run.
Until then, both sets of data point in the same direction: BTC will either successfully hold the $59,000 level during the price consolidation phase, or return to the levels seen at the beginning of the bull cycle.