Bitcoin (BTC) has recovered to around $67,000 after a sharp drop to the $60,000 region in early June, and on-chain data suggests that many buyers have indeed entered the market. However, this Bitcoin price recovery falls within the framework of Capital contracts, which typically lead to greater volatility rather than market stabilization.
The argument for the bottoming- Dip scenario relies on a return of buying demand. Conversely, the skeptical view focuses on where that demand will emerge. Currently, the second scenario has more compelling evidence.
On- chain investors returned to buying Bitcoin when BTC dropped close to $60,000.
The Accumulation Trend Score is an indicator that measures the size of wallets that are continuously buying. A reading close to 1 means the overall market is strongly accumulating. Conversely, a reading close to 0 signals that investors are selling off.
When the price approached the $60,000 mark in early June 2024, the index began to strongly lean towards accumulation across a range of different wallet groups. Prices fell, but on chain buying demand increased, preventing a new panic sell-off.
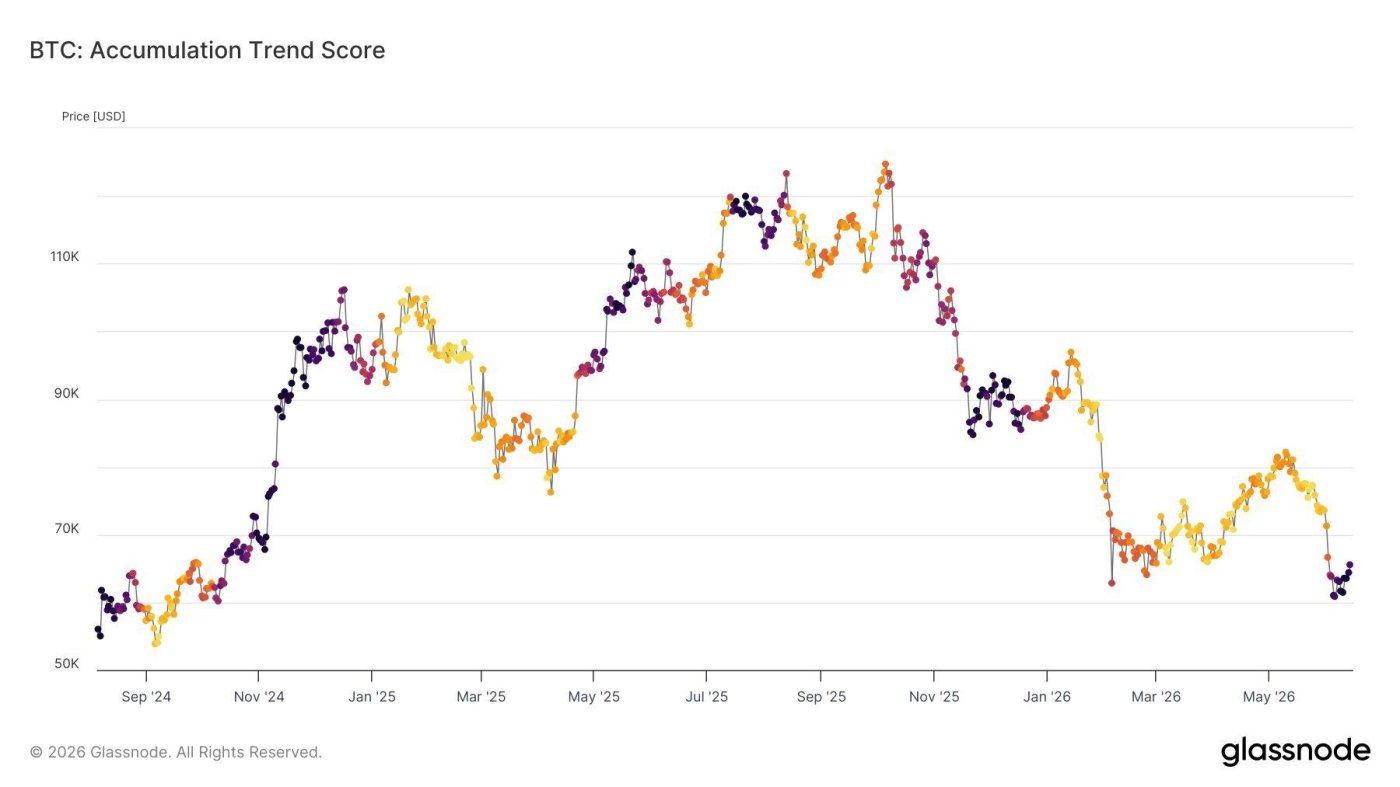 BTC accumulation trend indicator. Source: Glassnode
Since then, the price has recovered quite strongly. Bitcoin saw a surge of several percent in just one day after hitting Dip – having previously fallen by about 15% in a month. This rapid rebound makes the recovery look very solid.
This is a familiar "buy low" pattern. Both large and small wallets are taking advantage of low prices to accumulate coins. Simultaneously, the amount of coins onexchanges continues to decrease, indicating that those who bought are transferring their coins to storage wallets rather than preparing to sell.
Why the return of buying demand has Unconfirmed a Dip.
A renewed increase in buying demand is a necessary condition for creating a sustainable Dip . However, this factor alone is not enough to determine the true Dip . In fact, this accumulation indicator has also signaled buying activity many times during the recent decline.
The index only reflects who is buying, but doesn't indicate whether they are buying early or late. During the previous rally to the peak, the selling pressure continued. However, the selling pressure during the price increase did not prevent the subsequent sharp decline.
Mandatory liquidation orders also contributed to the stronger downward wave in early June 2024. When stop-loss orders were triggered en masse, prices would fall sharply before rebounding strongly, meaning that part of the recovery was merely short-covering orders rather than renewed confidence in the upward trend.
Indicators that call for Dip based on actual on-chain data have been misleading in this cycle, as recent signal-based analyses have shown. The scenario of investors continuously "buying on dips" can last for weeks, while prices continue to slowly decline. A return of demand rarely accurately signals a major reversal.
The options contract position on Deribit is currently in an unfavorable zone.
Gamma represents how options market makers must hedge against price volatility. If gamma is positive, they will buy when prices fall and sell when prices rise, thus reducing market volatility. If gamma is negative, they do the opposite, causing prices to fluctuate more sharply in both directions.
On the Deribit heat map, the area around $67,000 exhibits negative gamma signals. Market makers here typically sell when the market falls and buy when prices rise. For this reason, a stable market recovery is unlikely when prices are within this "sensitive zone."
The positive gamma zone, or the "calmer" zone, is located higher up, around $80,000 to $85,000. In other words, Bitcoin is recovering right in the pocket of volatility, while the stable zone remains much higher than the current price.
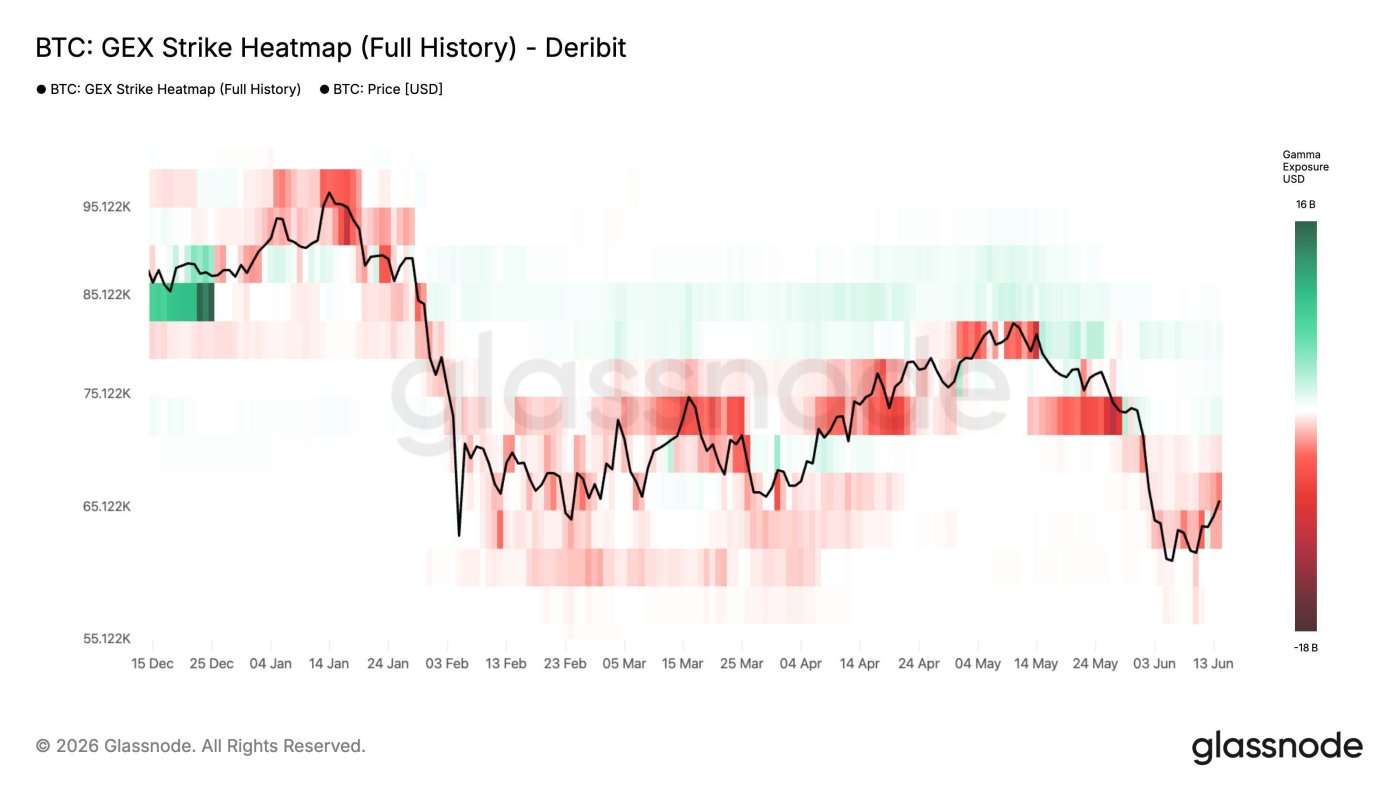 Heat map of BTC option prices on Deribit. Source: Glassnode
The high density of option prices may cause prices to be "pinned" near the expiration date, but overall, the negative gamma signal suggests that the likelihood of sudden price swings is higher than a Dip out.
The same positive gamma zone above can also Vai as resistance when prices rise sharply. Market makers in this zone will sell when the market approaches $80,000, thereby creating pressure to stop prices from rising further. Thus, the zone that provides stability is also a strong resistance zone for the market.
Key price levels will determine Bitcoin's next direction.
There are three main price zones to watch. The $60,000 area (green zone) is the nearest Dip , and also the accumulation zone that needs to be defended. If Bitcoin breaks through this zone significantly, it will break the buying momentum narrative and shake expectations of money flow supporting the price.
The area around $67,000 is the "equilibrium point of volatility" (the lower red zone). As long as the price continues to fluctuate within this range, the likelihood of a two-way market movement is greater than a strong uptrend.
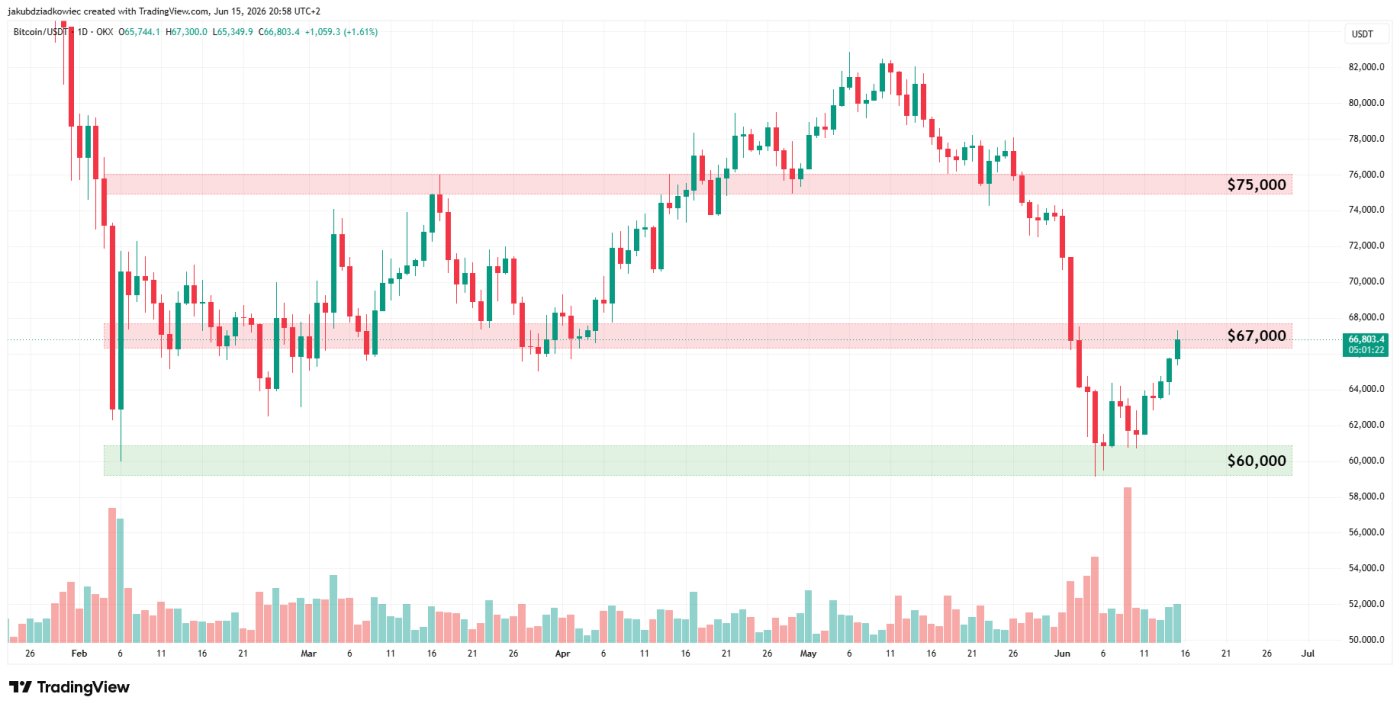 BTC daily chart. Source: Tradingview
Breaking above the $75,000-$80,000 range (the red zone above) would truly represent a major trend shift. This is because it represents a positive gamma zone, helping the market become more stable against price fluctuations.
Once Bitcoin regains this zone, the pessimists will have reason to be less cautious, aligning with the positive forecast scenarios for June 2024 in recent predictions .
Summary for Bitcoin investors
The demand is real, but that doesn't mean the market has a definitive "buy" signal. on-chain accumulation only shows that buyers have appeared, but it Unconfirmed this is the Dip.
Until Bitcoin trades back above a zone that could calm volatility, the safe approach is to view this rebound as fragile. The market may continue to rise, but current Derivative data encourages patience rather than overconfidence.