Guojin Securities believes that in the digital economy era, the traditional "three-pronged" analytical framework is becoming increasingly distorted due to limitations in statistical methods.
Article author and source: Wall Street News
The traditional "three-pronged" analytical framework is becoming increasingly distorted due to insufficient statistical methods, especially given the rapid expansion of AI investment and its profound impact on economic data.
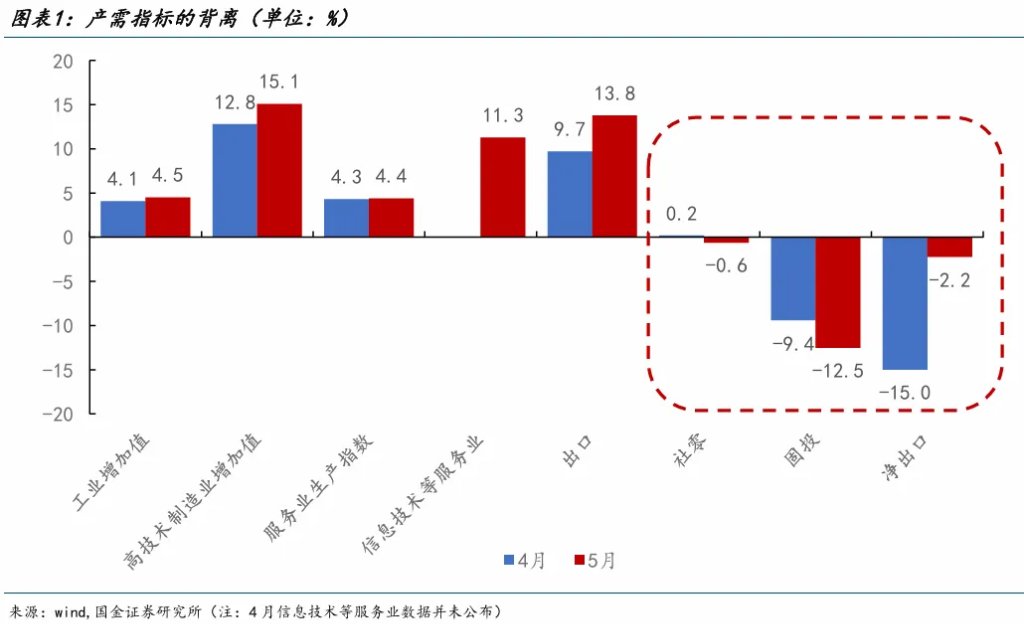
In May of this year, demand data accelerated its decline, but production data bucked the trend and surged, exacerbating the divergence between supply and demand.
On the one hand, fixed asset investment in May fell sharply to -12.5% year-on-year, and retail sales fell to -0.6% year-on-year, hitting a new low since 2023. Although export growth was high, high import growth led to a year-on-year decline in net exports to -2.2%. If we measure the economy simply by retail sales, fixed asset investment, and net exports, the economic growth rate in May undoubtedly faced enormous pressure.
On the other hand, both industrial and service sector production rose in May, with industrial production increasing by 0.4 percentage points year-on-year to 4.5% and service sector production increasing by 0.1 percentage points year-on-year to 4.4%. Based on this estimate, the economic performance in May was better than in April, with GDP growth at constant prices rising to 4.3% year-on-year.
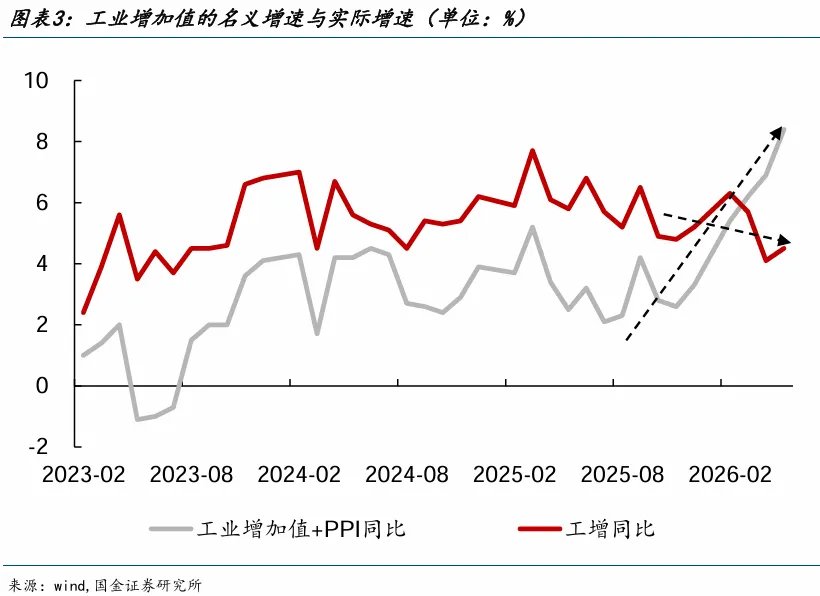
In fact, the divergence between production and demand has a long history. For example, fixed asset investment turned negative in the second half of 2025, but industrial value added remained stable at around 5.4% (constant prices). At that time, declining prices and resilient exports could explain part of the data deviation. However, as prices rebounded, the divergence between production and demand data not only failed to converge but widened significantly.
After accounting for industry inflation, nominal industrial value-added rose to 8.4% year-on-year in May, hitting a new high in recent years. The year-on-year growth rate of current-price GDP in the second quarter is likely to be significantly higher than 5%, creating a stark contrast with the negative growth rates of fixed asset investment and retail sales.
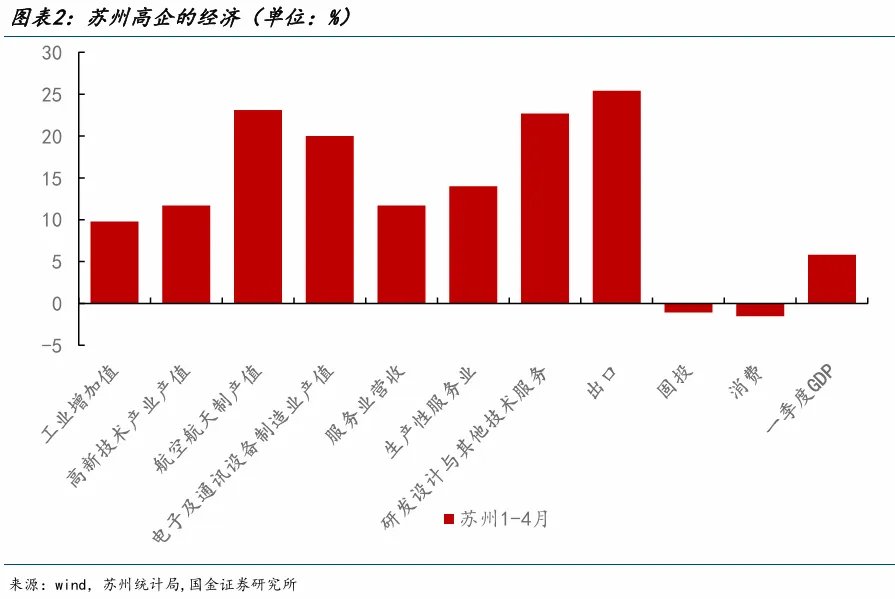
The example of Suzhou, China's "City of Lights," illustrates the stark contrast in current statistical data. Whether looking at manufacturing transformation, listed company revenue, or the real estate market, Suzhou is a leader in economic transformation. However, the production and demand data within Suzhou's economic data depict a completely different economic situation.
Suzhou supply and demand data comparison
From the demand side, one might even think Suzhou's economy is in recession. From January to April this year, Suzhou's fixed asset investment, real estate investment, and retail sales decreased by 1.1%, 9.1%, and 1.5% year-on-year, respectively. Meanwhile, industrial output increased by 9.8% year-on-year, high-tech industry output increased by 11.7% year-on-year, optoelectronic device output increased by 18.2% year-on-year, service sector revenue increased by 11.7% year-on-year, producer services revenue increased by 14% year-on-year, and scientific research and technical services revenue increased by 22.6% year-on-year. The real estate sales market has also shown marginal improvement, with Suzhou's combined sales of existing and new homes increasing by 23.2% year-on-year in May.
The economy is a cycle, and the quality of this cycle can be verified through multiple stages in the production-distribution-income-demand process. In addition to production and demand data, data such as electricity consumption, unemployment rate, and corporate profits can also verify the current economic state.
For example, in May, total electricity consumption rose 0.9 percentage points year-on-year to 6.9%, with electricity consumption in the tertiary sector rising to 9.7%; the urban surveyed unemployment rate fell slightly to 5.1%; the cumulative growth rates of industrial enterprise revenue and profits rose to 5.2% and 18.2% respectively from January to April; the cumulative growth rate of personal income tax rose to 12.2%; and the growth rate of residents' disposable income in the first quarter was 4.9%.
It can be said that the recovery of the Chinese economy under transformation is differentiated, even K-shaped, but the demand-side data is even less likely to show a K-shape. The demand-side data is significantly weaker than the production-side and other data, which is related to the statistical methods used.
Differences in statistical methods
Even under the demand-based GDP calculation method, there are significant differences between retail sales and fixed asset investment and final consumption and gross capital formation.
Final consumption includes physical goods consumption, all service consumption, and virtual consumption (such as virtual rent for owner-occupied housing), and also covers government consumption (administrative, defense, etc.), while retail sales only include physical goods consumption and catering consumption. While the growth rate of retail sales has continued to decline due to overspending on trade-in programs, the growth rate of service consumption has remained stable above 5%. If virtual consumption is taken into account, final consumption under the GDP calculation may not be low. For example, in 2024 and 2025, final consumption under the GDP calculation was more than 0.5 percentage points higher than retail sales.
Fixed asset investment and gross capital formation are the areas where the data differ most significantly. Fixed asset investment requires deducting land acquisition costs, purchases of old equipment, etc., and then adding items such as fixed asset investment below a certain scale, intangible asset investment (software, etc.), and inventory to arrive at gross capital formation.
In other words, the slowdown in land acquisition costs for fixed asset investment does not drag down gross capital formation. In 2025, land acquisition costs decreased by 13.9% year-on-year, dragging down fixed asset investment by 0.8 percentage points. Local government land transfer revenue is expected to continue declining in 2026, and land acquisition costs are projected to maintain low growth. Furthermore, the high growth in inventory and intangible assets has widened the discrepancy between fixed asset investment and gross capital formation data. Specifically, in 2025, inventory increased significantly by 37.4% year-on-year under GDP accounting standards, while investment in intangible assets and other assets increased significantly by 36.1% year-on-year.
In 2025, investment in intangible assets accounted for 14% of gross fixed capital formation in GDP. Intangible assets mainly refer to patented technologies, computer software, and data. Their high growth may be related to AI investment (such as large-scale model development, purchasing training data, and AI team employee salaries, excluding GPU purchases and factory construction). Intangible asset investment is not included in monthly statistics but is directly reflected in gross capital formation; monthly data may underestimate the growth rate of this portion. In 2026, Alibaba, ByteDance, and others significantly increased their capital expenditure growth rates, and it is expected that the support of intangible asset investment for the economy may further increase this year.
Production-side data provides a closer look at the overall economy.
Currently, economic growth accounting is based on the production-based GDP statistical method. Compared with retail sales and fixed asset investment data, which have distorted economic figures due to limitations in their statistical methods, production-based data provides a more complete picture of China's economy under transformation.
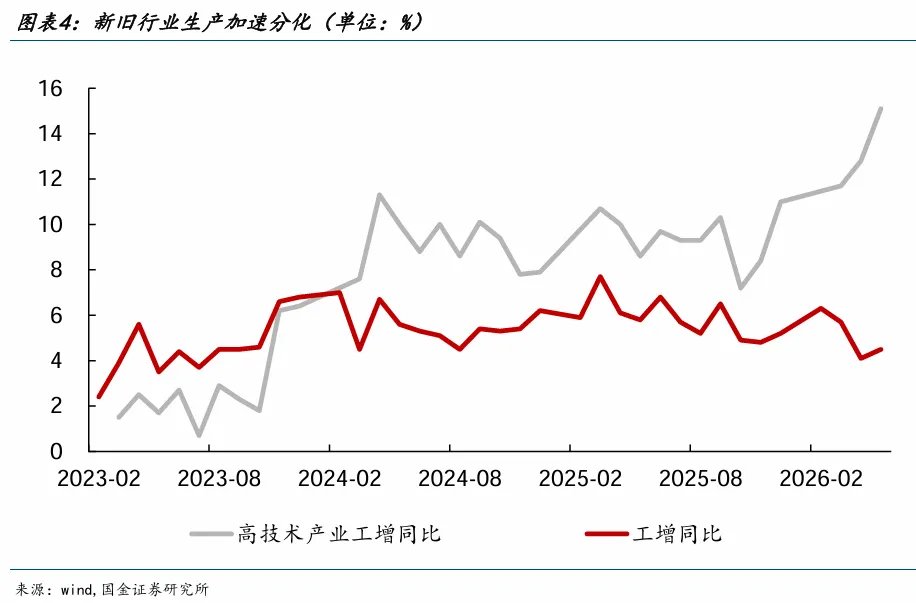
For example, on the industrial production side, the large-scale AI infrastructure investment in the United States is currently the engine of the global economy. Its boost to China's exports and related goods production is reflected in the 4.5% year-on-year increase in industrial added value in May, the 15.1% year-on-year increase in high-tech manufacturing, and the 17% year-on-year increase in computer and other electronic equipment manufacturing. The contribution rate of electronic equipment manufacturing to industrial added value reached 39.2%. Coupled with the export-driven surge in production in industries such as specialized equipment and automobiles, industrial production growth remained resilient even when industries such as non-metallic mineral products manufacturing turned negative.
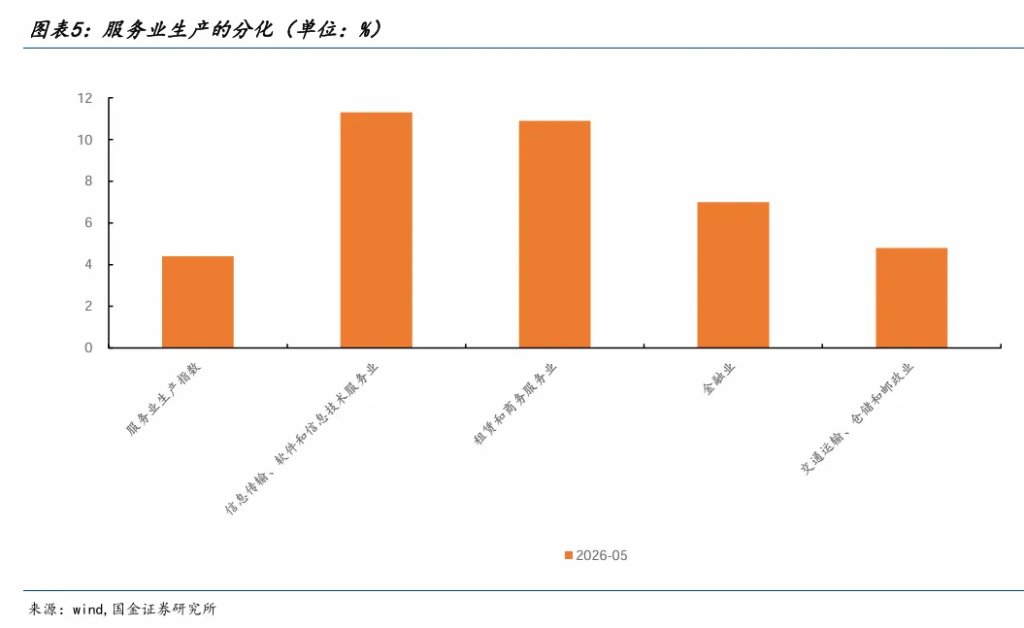
On the other hand, AI investment has also boosted service sector production, reflected in a significant increase in the growth rate of value added in the information transmission, software, and information technology services industry. In May, the information transmission, software, and information technology services industry grew by 11.3% year-on-year, accounting for over 10% of the tertiary sector's GDP. The leasing and business services industry grew by 10.9% year-on-year, significantly higher than other service sectors. Therefore, even with the drag from the retail and wholesale industry's growth on retail sales, the service sector production index remained stable at around 4.4% year-on-year. It is worth noting that in the current competitive landscape, leading AI companies are providing a large number of services for free or at low prices, which may lead to an underestimation of the current value added of AI-related industries.
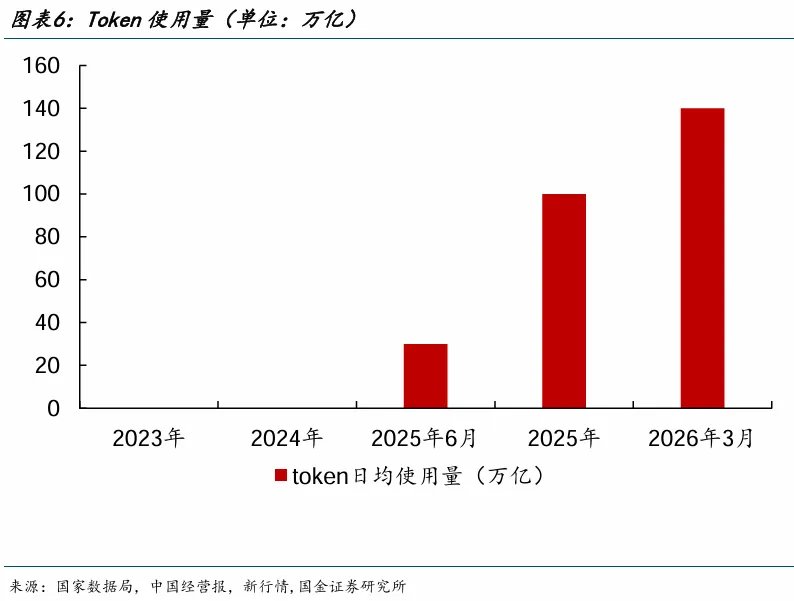
In the digital economy era, in addition to conventional data such as the three drivers of growth (consumption, investment, and net exports), industrial and service sector production, electricity consumption, employment, income, and industrial enterprise profits, we may need to shift our focus in tracking current economic changes to other areas, such as per capita token usage.
Even earlier, due to the de-emphasis on real estate in the economy, credit growth had already become decoupled from economic growth. Today, with the increasing proportion of the digital economy, demand-side data has also begun to show distortion.
Traditional indicators such as retail sales and fixed asset investment are less effective at tracking the economy. While retail sales still raise questions about wealth K-shaped differentiation and redistribution mechanisms, the problems with fixed asset investment are more prominent. Weak fixed asset investment does not necessarily mean a decline in gross capital formation, nor does it indicate a weakening economy. Beyond the shadow of negative demand data, production-side data, though not perfect, provides a more complete picture of the economic situation.
Ultimately, production and demand data will inevitably converge, and the United Nations is promoting the inclusion of data assets in national accounting (SNA2025) and the inclusion of leasing computing power as an intangible asset investment rather than an intermediate input.
As for whether AI will lead to "ghost GDP" (where a large amount of investment and profits are concentrated in leading technology companies, sacrificing employment, income, consumption, and government income tax for the whole society), this is a big question about the future of humanity, but at least in China's employment, income, and income tax data today, we do not see it.
AI is profoundly changing the logic of economic statistics. The divergence between production and demand in China in May 2025 reveals a difference between traditional indicators and GDP calculation methods: retail sales exclude service consumption, fixed asset investment excludes intangible asset investment, while investment in AI-related data assets, patented technologies, software, and other intangible assets surged by 36.1% year-on-year—a portion completely absent from monthly statistics. Production-side data provides a more complete picture of China's economy during its transformation; the digital economy era demands a new analytical perspective.