

What other lesser known features of the MVRV indicator?
Original title: " Mastering the MVRV Ratio "
Written by: Checkmate, Glassnode
Compiler: Anthony
The MVRV ratio is one of the most popular and widely used chain indicators, however, MVRV has many features that are rarely used. In this article, we will explore how to empower MVRV to find extreme cycles, identify market trends and get early warning of sell-offs.
It was first conceived in a paper published in October 2018 by on-chain pioneers Murad Mahmudov and David Puell, and has since become a major Bitcoin analysis tool.
The MVRV ratio is often used to observe macro shocks and can be used to explore Bitcoin market cycles, especially to find highs and lows. But in reality, the MVRV metric is more nuanced and information-dense than many analysts think.

Figure 1: The magic MVRV ratio
In this article we'll explore the MVRV ratio, starting from the very basics to more advanced studies. Our goal is to show the mechanics that make MVRV work and explore what makes this indicator such a powerful tool. We will cover three topics:
1. Explore the extremes of MVRV to find cycle tops and lows.
2. MVRV momentum and how to use the indicator to track macro bull/bear trends.
3. Distribution divergence shows how MVRV warns of the apex of a sell-off cycle.
Introducing MVRV again
MVRV, short for market value (MV) and realized value (RV), is the ratio between market price and realized price. Since realized price is the average price at which each bitcoin was last traded on-chain, MVRV can be thought of as a measure of "unrealized profit" in supply.
- An MVRV of 2.2 means that the market price is 2.2 times the actual price (120% profit)
- An MVRV of 1.0 means the market price equals the actual price (break even)
- An MVRV of 0.8 means the market price is 0.8 times the actual price (20% loss)
The chart below shows the MVRV ratio, roughly showing the largest unrealized profits for bulls in bull markets and the largest unrealized losses for bears in bear markets.
- A high MVRV value (> 2.4) indicates that the market is holding large unrealized profits.
- A low MVRV value (< 1.0) indicates that the market is facing unrealized losses.
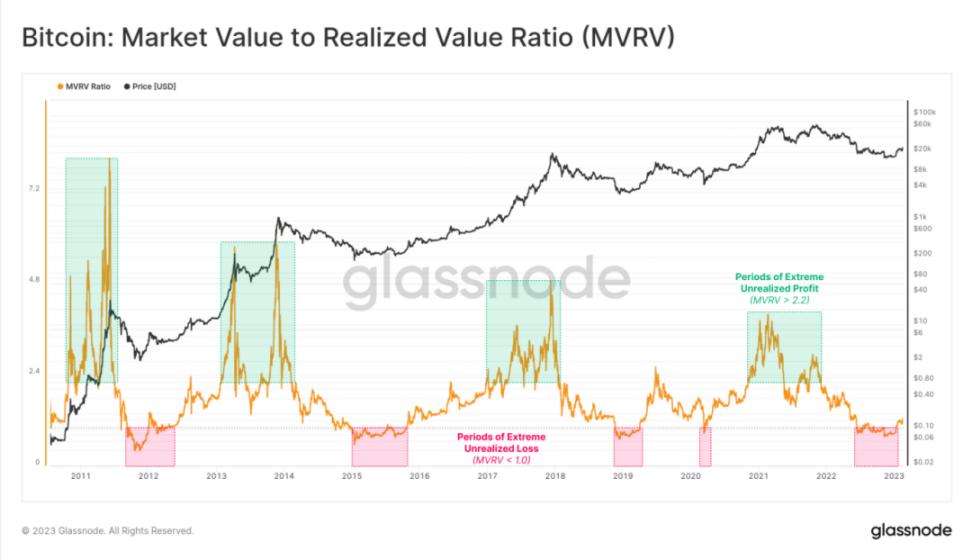
Figure 2: Market Value to Unrealized Value Ratio (MVRV)
The average profit percentage held by the market can be calculated as MVRV - 1.
The chart below shows this oscillator, highlighting that the MVRV is below 1, that the average Bitcoin holder is in a shrinking state of Bitcoin, and that the average Bitcoin acquisition cost is higher than the current spot price.
Such events are relatively rare and usually occur late in a prolonged bear market. These large unrealized losses often trigger massive selling events that can form cycle lows.

Figure 2: Realized Price vs. MVRV
Exploring the limit of value
The next question is, what are the high and low values of MVRV? How do we measure extreme deviations relative to cycle tops and bottoms?
First, we'll look at it from a visual standpoint, where we label the MVRV levels as 0.8 (blue), 1.0 (green), 2.4 (orange), and 3.2 (red). From the marks it looks like the top and bottom line up nicely, at least initially. However, if we want to properly grasp MVRV, we will need to make this analysis a little more robust than visual inspection.

Figure 3: MVRV Value Limits
A simple way to do this is to calculate the percentage of days that historically MVRV has traded below or above a certain level. We can calculate and display this using the Workbench tool and only consider dates since 2017, in line with the more mature Bitcoin market. If MVRV is below a certain level on only 10% of the trading days, it means that it is above that level on the other 90% of the trading days.
Now we can better quantify the likelihood of these MVRV levels:
- Blue Extreme Lows: MVRV is below 0.8 on about 5% of trading days.
- Continued lower green: MVRV has been below 1.0 for about 15% of the session.
- Orange continues to move higher: MVRV has been above 2.4 for about 20% of the session.
- RED EXTREME POINTS: MVRV has been above 3.2 for about 6% of trading days.
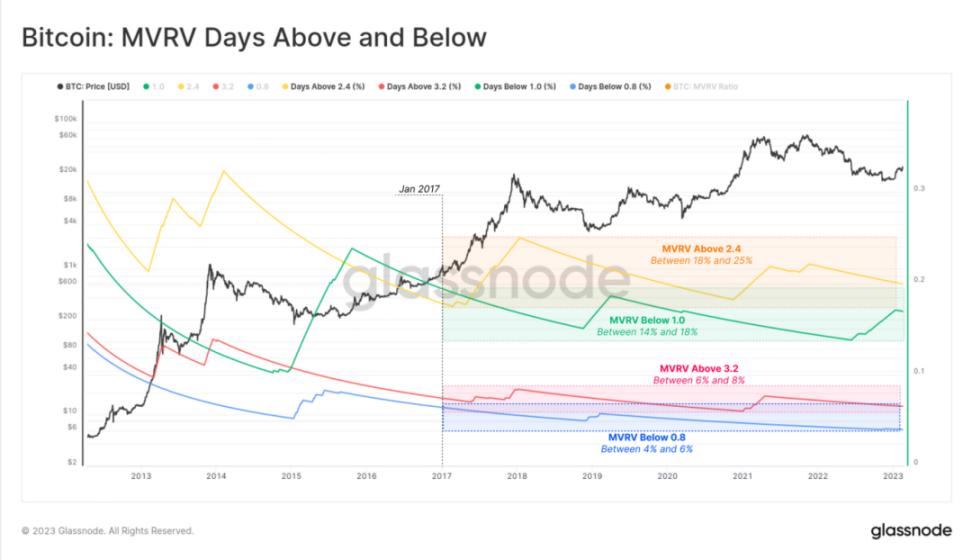
Figure 4: Number of days with MVRV above/below the key level
If we map the periods when the MVRV was above/below these key levels, we can start to spot cycle tops and bottoms.
- Blue: A cycle low is usually formed if the MVRV is below 0.8 (approximately below 5% of the trading days)
- Green: Sell-off begins when MVRV is below 1.0 (below 15% of trading days)
- Orange: When the MVRV is above 2.4 (approximately 20% of the trading days), the market starts to recover
- Red: If the MVRV is above 3.2 (~6% above the trading day), the cycle usually peaks
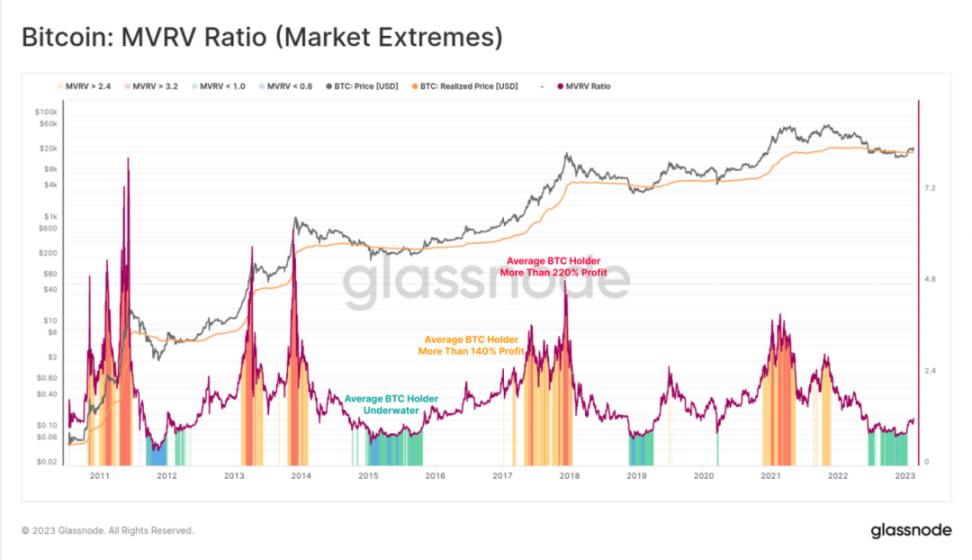
Figure 5: MVRV Ratio (Market Limit)
Now that we have defined a set of "extreme tiers" for MVRV, we can visualize them as pricing intervals. If the MVRV ratio equals 2.4, it means that the corresponding profitable pricing range is 2.4 times the realized price.
This tool now allows us to estimate the price level at which the market will reach extreme unrealized profits (high values) or unrealized losses (low values). Reaching these prices may increase the likelihood of triggering investor actions such as profit-taking or selling, which is ultimately the basis for the cycle tops/bottoms we are looking for.

Figure 6: MVRV pricing range
For a more advanced robust statistical approach, we can also calculate the historical average MVRV and use +/- 1 standard deviation to spot extreme values. This provides a more robust and statistically significant method.
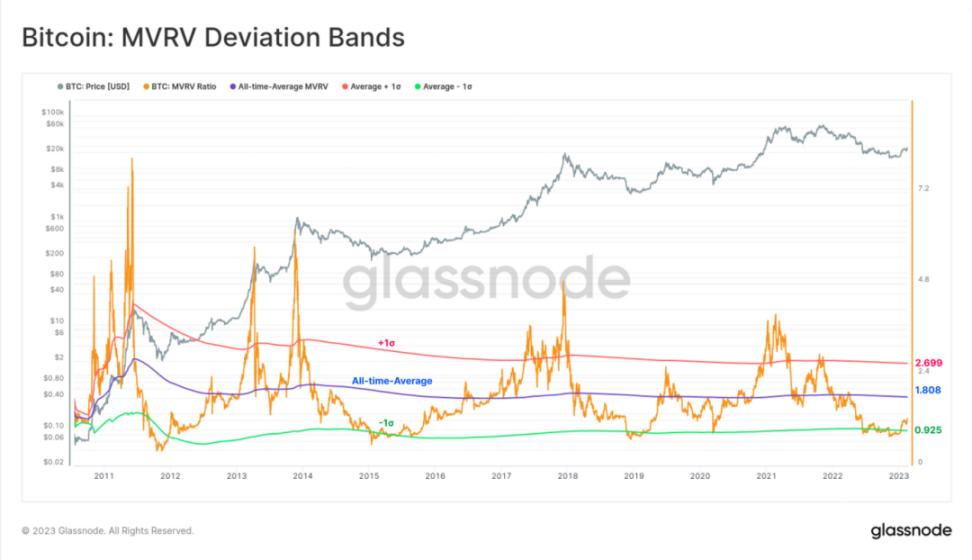
Figure 7: MVRV Deviation Range
MVRV Momentum
The previous section explored the use of MVRV to identify periodic extrema. Next we will use MVRV as a tool for judging macro market trends.
The chart below shows the MVRV ratio (orange) moving along the 1-year moving average (blue). Note that periods when MVRV trades above the 1-year moving average generally describe a bull market, while periods below the 1-year moving average describe a bear market. A strong MVRV break above the 1-year moving average threshold is often characteristic of cycle transition points.
- A strong breakout (green) indicates the underlying cost of a large amount of Bitcoin
- Below current price, now in profit (lots of BTC accumulating near lows)
- A strong break (red) indicates the underlying cost of a large number of bitcoins
- Higher than current price, now in the red (lots of BTC accumulating near highs)
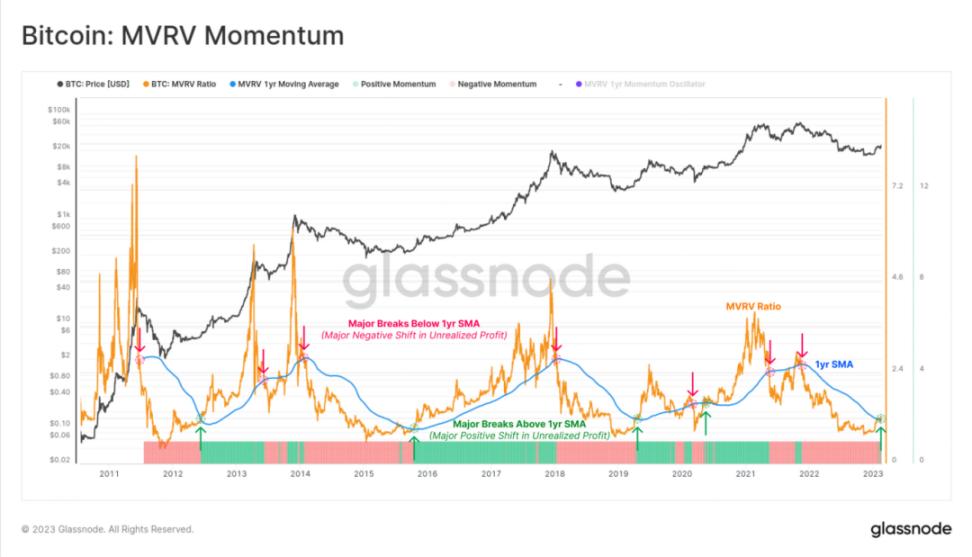
Figure 8: MVRV Impulse
We can convert this observation into an oscillating range by picking the ratio between the MVRV and the 1-year SMA. This tool is especially useful for spotting sharp shifts that occur at cycle turning points.
- The beginning of a bear market: a sharp drop (negative value (red)) means that the underlying cost of most bitcoins is high, and the bitcoin market is in the red. This suggests that a "top-heavy" market may be sensitive to falling prices.
- The beginning of a bull market: A sharp increase (positive value (green)) means that the underlying cost of most bitcoins is low, and the bitcoin market is back in profit. This points to a "top-heavy" market entering an accumulation phase after a massive sell-off.
Key transition points in past cycles are shown as a measure of how responsive MVRV momentum shocks are to changes in the macro cycle.
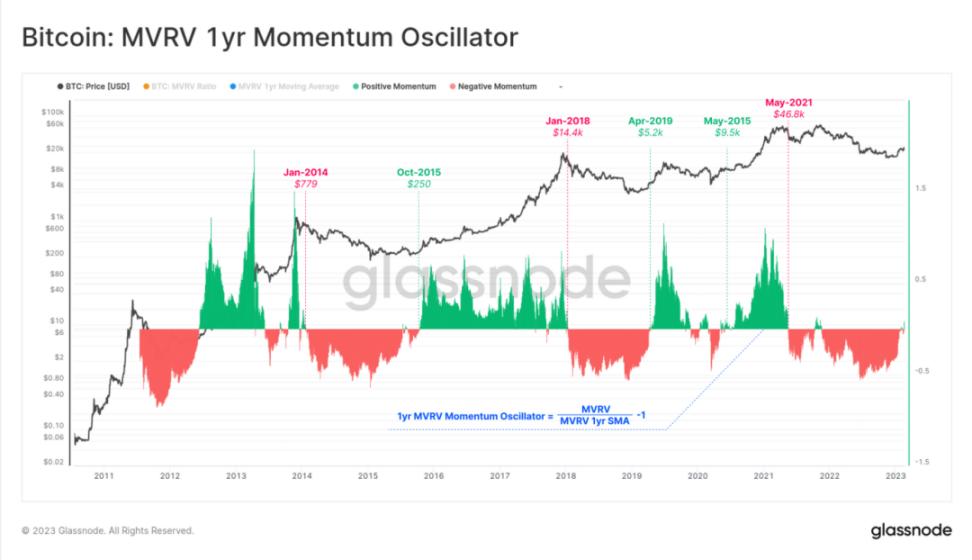
Figure 9: One-year momentum shock of MVRV
distribution difference
In the final section, we explore how to give early warning of large MVRV allocations, which typically occur near market cycle tops. This happens both macroscopically and microscopically.
The graph below shows the MVRV ratio for the full 2020-23 period. We can clearly see how prices in October-November 2021 set new all-time records compared to April, but with significantly lower MVRV peaks.
Why is the price higher but the overall unrealized profit multiple lower? The answer is that Bitcoin was more expensive to collect on average in November compared to April.
This creates a negative divergence in the MVRV ratio on a macro scale.
During the second July-November rally, large amounts of Bitcoin previously acquired at low prices (such as during the May-July sell-off) seized the opportunity to exit liquidity and transfer them to new inexperienced "Top Buyers". Bitcoin has been revalued from a lower real price and moved into the hands of speculators and price sensitive buyers who now have a much higher base cost (closer to ATH).
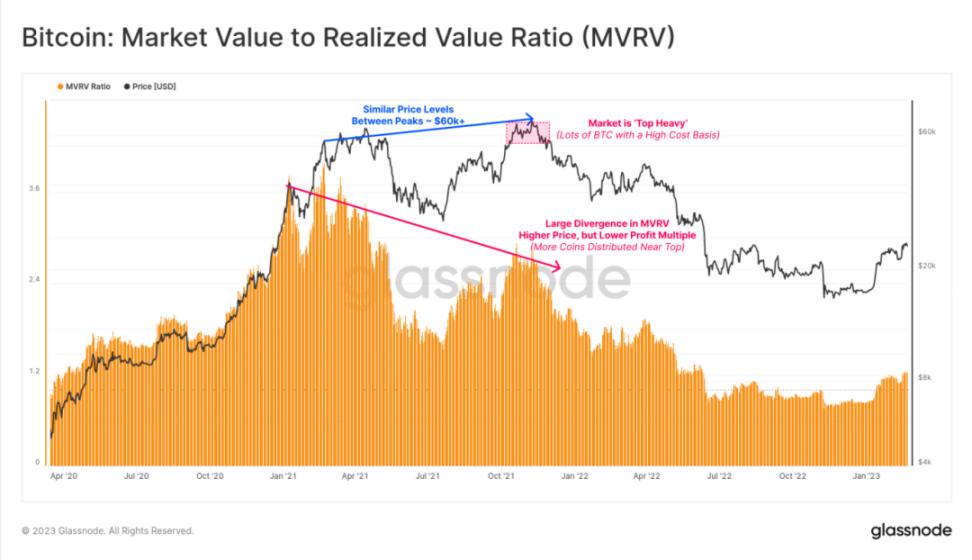
Figure 10: Market Cap to Realized Value Ratio (MVRV)
The graph below shows how this phenomenon plays out in two metrics:
- Realized profits peaked at around $1.5B per day in October-November as Bitcoins were acquired at a cheaper price
- Transferred to a new buyer at a more expensive price.
- As a result of this profit-taking behavior, realized market capitalization experienced a second move higher.
We can see that the 2022 bear market has resulted in a downward trend in the realized ceiling as the losses are realized and the indicator returns to July levels. This represents a write-off of all speculative premium increases between July 2021 and November 2021.
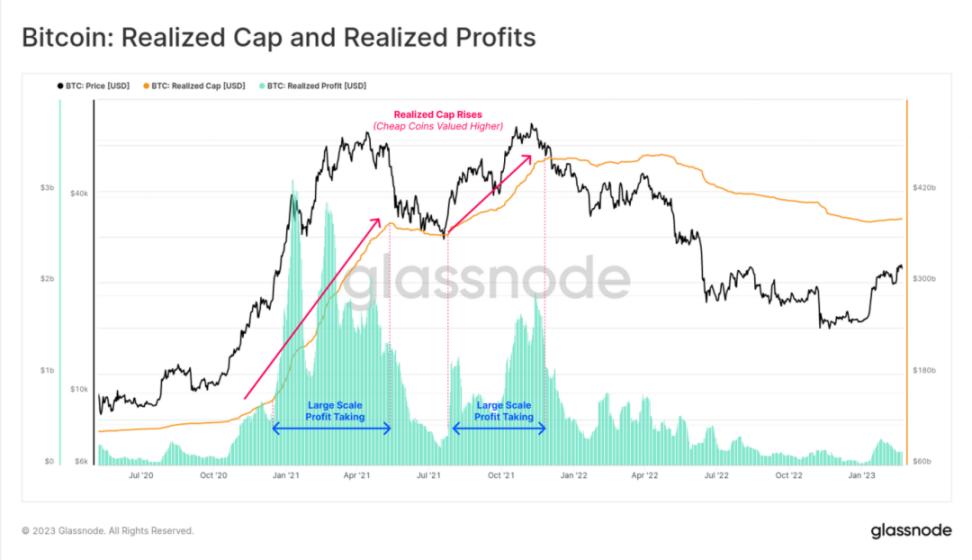
Figure 11: Realized Caps and Realized Gains
If we zoom in on the January-May 2021 peak, we can actually see a similar negative divergence in the MVRV ratio on a smaller scale. Prices make consecutive new highs, but MVRV quickly falls to lower highs.
Unrealized profits in supply are dwindling as a result of massive sell-offs, profits that are never realized (book gains) become realized (locked in).
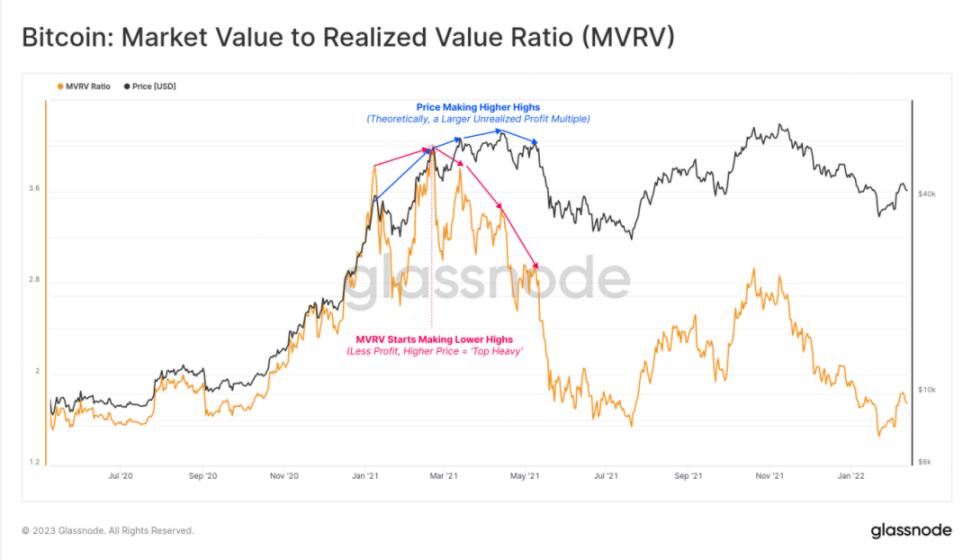
Figure 12: Market Cap to Realized Value Ratio (MVRV)
We can see a similar event in 2013 between the two peaks, where prices increased by 392%, but the MVRV ratio was actually lower, falling from 5.74 to 5.43. We can see in the green marker below that a similar decay occurred before the final peak at $1,133.
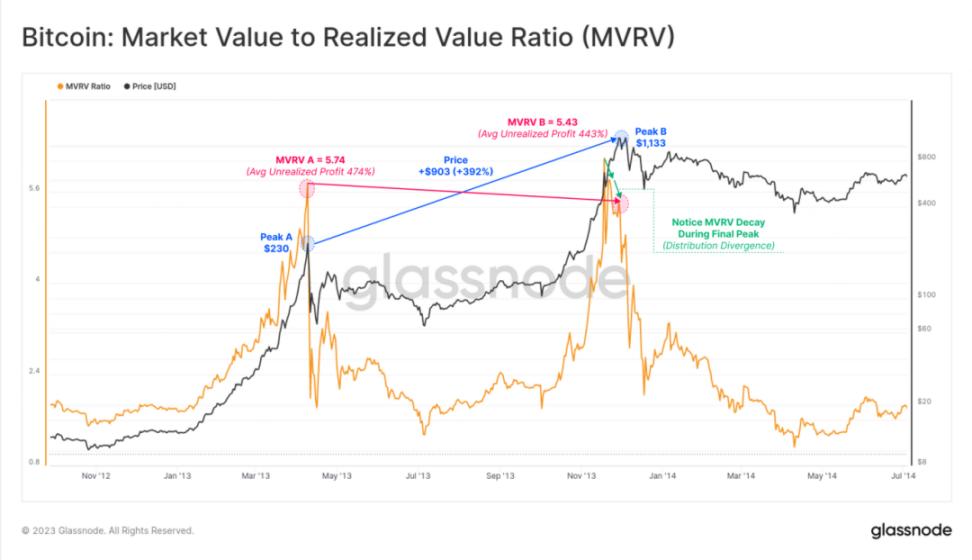
Figure 13: Market Cap to Realized Value Ratio (MVRV)
This was also the case during the bull cycle in late 2017. As MVRV exceeds our defined extreme level of 2.4, we start to see higher price spikes, but the growth in the MVRV ratio tapers off.
Note that in August 2017, the SegWit upgrade soft-forked into Bitcoin, and many locked Bitcoins were transferred to utilize BCH for the Hard fork, which will partially affect this cycle observation.
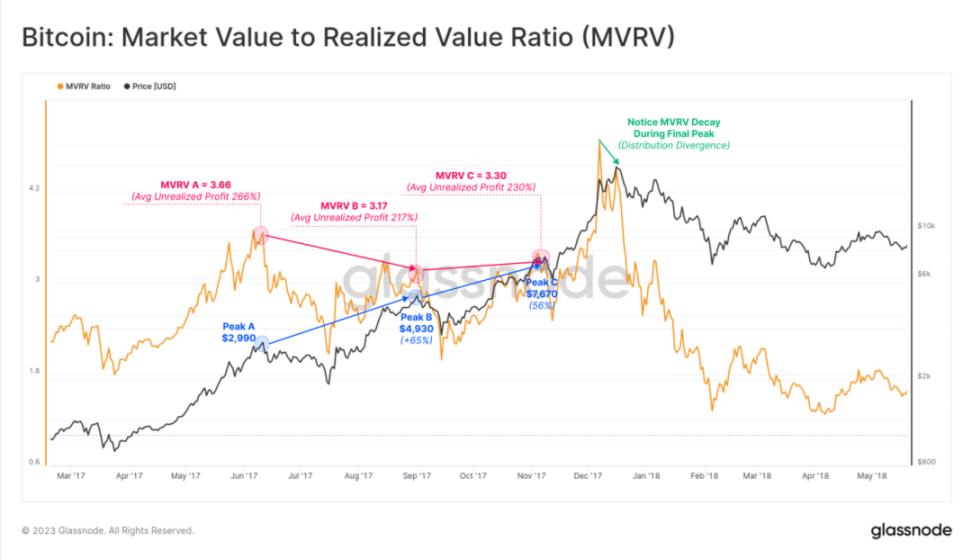
Figure 13: Market Cap to Realized Value Ratio (MVRV)
What should I do if my bitcoins are lost?
MVRV does have a net upward bias due to Satoshi, early miners holding huge unrealized profits and lost bitcoins. There are several ways to calculate lost bitcoins, one simple way is to discount bitcoins that have not been used for at least 7 years.
The chart below calculates adjusted MVRV, minus unrealized profits from long-dormant bitcoins, all of which ended up flowing at very low prices. The result is that we have an adjusted higher realized price that more accurately reflects the average purchase price of "active supply." This in turn results in a lower MVRV ratio (smaller profit multiple), providing a better perspective on liquidity and circulating Bitcoin supply.

Figure 14: Adjusted MVRV Ratio
Summary and Conclusion
The MVRV ratio is a very complex indicator that contains information about Bitcoin market dynamics and investor behavior patterns. MVRV is much more than a long-term periodic oscillator, and the list of derivatives and methods above only scratches the surface of this simple structure.
Mastering the MVRV ratio is an essential step in analyzing Bitcoin, and once understood, opens doors of opportunity for new iterations, Derivatives, and variants.


