

This article is from Twitter , the original author: encryption KOL @BCBacker
Translator for Odaily Planet Daily | Moni
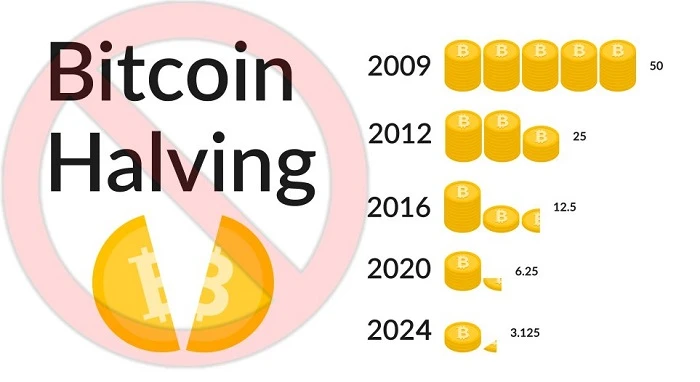
As Bitcoin’s block reward nears its fourth halving, investors are trying to “snap up” the historically Bullish event, but are Bitcoin’s price gains really tied to the magic “4-year cycle”? ? If you really believe in this so-called cycle, then please be prepared that this concept will be subverted, because this article will prove that the Bitcoin halving bull market cycle is actually just a "legend " .
People who believe that "Bitcoin's block reward halving every 4 years is the main reason for the bull market" may consider the inflationary pressure on the price of Bitcoin to gradually decrease - which makes sense conceptually, because the miners are provided The less Bitcoin rewards, the less selling pressure they will have. However, if you analyze it through the chart, you may find a hint of "different".
The most recent Bitcoin block reward halvings took place at:
May 11, 2020
July 9, 2016
November 12, 2012
And here are the number of days it will take for Bitcoin to “touch” its post-halving all-time high:
2012: 92 days
2016: 180 days
2020: 204 days
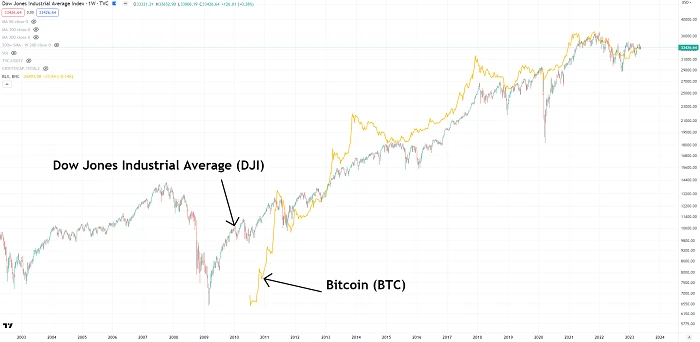
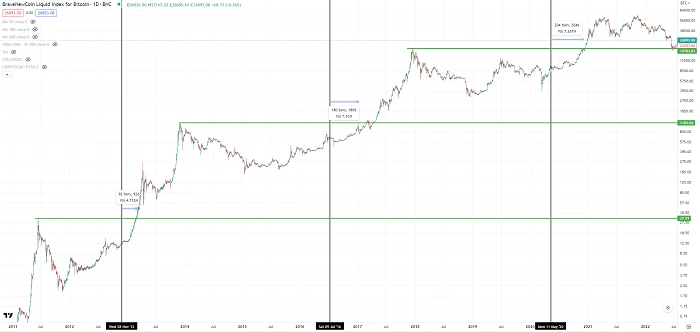 The first observation that can be drawn from the above data set is that the number of days after the Bitcoin block halving to reach new highs is increasing, 92 days, 180 days, and then 204 days. But in fact, according to years of data analysis, the timing of Bitcoin's price cycle is not convincing, but its price trend is relatively consistent with the Dow Jones Index (DJI).
Let's start from 2012, after the bitcoin block reward was halved, the price hit a ATH at that time 92 days later, this price increase was sent after the US subprime mortgage financial crisis, when the bitcoin price hit a Fifteen days after the new high, the Dow also hit a ATH. The bear market at the time lasted as long as 618 days, and the ATH in Bitcoin prices coincided with the period when the Dow Jones index broke through the peak of the financial crisis.
Many people still remember the bull market in 2013, but then Bitcoin entered a long bear market in 2014-2016. During this period, the Dow Jones index also fluctuated in the range between 15,400 and 18,300, and there were three relatively large declines (see the red box range in the figure below).
Next, let's look at the situation in 2016, when Bitcoin's block reward was halved, and it took 180 days for its price to hit a new high at the time. It is worth mentioning that the Dow Jones index also got rid of the downturn at that time and also hit a ATH. The time for Bitcoin to break through the ATH-All Time High this time was set within 57 days after the Dow Jones index left the 3-year bear market period.
A year later, in 2017, the parabolic trend of Bitcoin price and the Dow Jones Industrial Average became more and more similar, although this synchronous trend only lasted for about 42 days at the time.
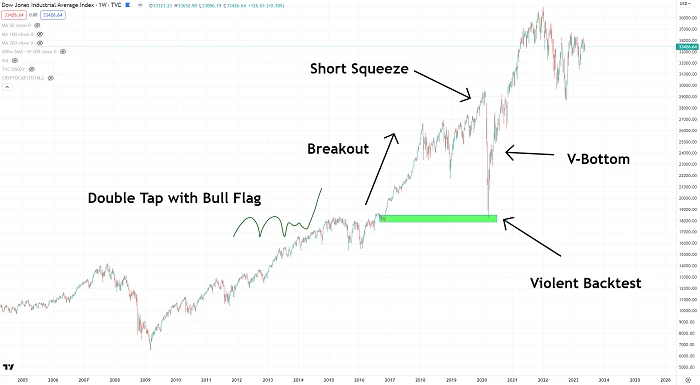
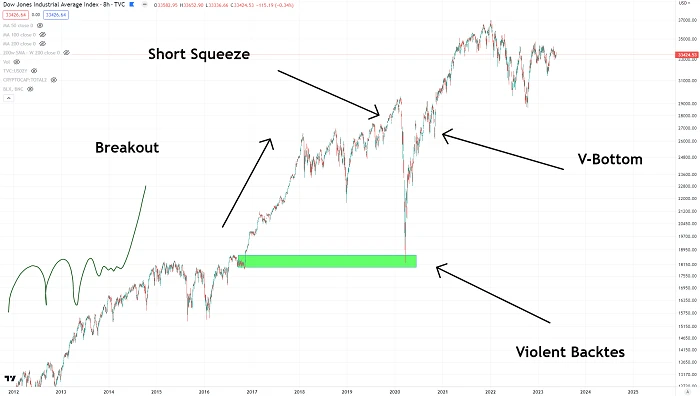
A more complex pattern emerged following the 2017 bull market, which many see as a correction "range" or market correction, and a widening wedge formed (note: a wedge is a common The price correction structure, the rising wedge refers to the strong technical rebound of the price after a sharp drop. The lows form a wave below the wave, and the rebound highs gradually move down.) Interestingly, at the time, this market situation seemed more like a "double-click bull flag breakout short squeeze backtest V-shaped bottom" .
Most people who believe in Bitcoin’s 4-year cycle would probably argue that it’s price action, “March 2020 would never have happened without Covid.”
But the problem is that the crypto market crash in March 2020 is an established fact, especially when we compare the data from 2013 and 2017-2021 (as shown in the figure below), even those who believe that the Bitcoin block Whoever rewarded the 4-year bull cycle will admit this too.
The following picture reflects the trend of Bitcoin price from 2017 to 2020, which will be disassembled and analyzed later.
The figure below shows the trend of Bitcoin in 2013. It can be seen that the price of Bitcoin at that time experienced four stages: plummeting, slight rebound, re-accumulation, and price rise.
During the period from 2017 to 2020, the market sell-off caused by Covid began to appear. At that time, some investors in the market also began to "capitulative reaccumulation (Capitulative Reaccumulation)" (Note: Capitulative reaccumulation is a term created by the author, you can see Doing is a case of market capitulation.)
Next let's briefly review what has changed in the Dow during the Covid period, in fact, some of the changes are common in bubbles, in other words, the Covid-induced market sell-off in March 2020 was actually normal.
As an example, if we look back at the price action of Ethereum in 2017, we can see a similar parabolic trend situation and the crypto market during Covid is also very similar.
On the other hand, during the same period, the Dow Jones Index is also undergoing a normal correction structure. For some "novice" who do not understand economic concepts, they may think that the market shock caused by Covid, but if you look back at the past historical trends It is not difficult to see that this is not the case. And this is why some people sold in panic during the period from March to October 2020, while others made a lot of money by "Bottom Fishing the bottom".
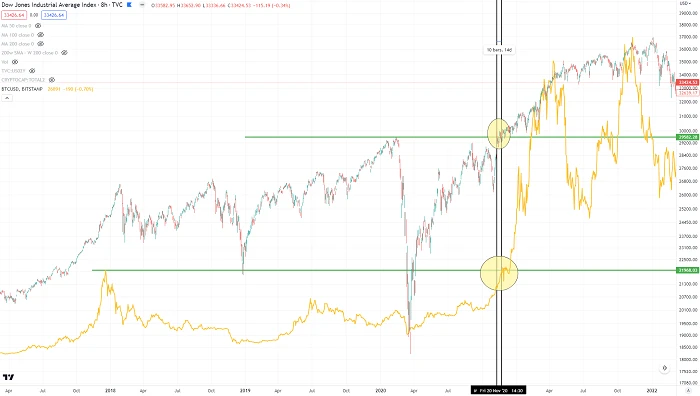
A key point here is the market correction during 2018-2020, when neither Bitcoin nor the Dow was ready for a "bounce". But while the Dow managed to pull out of the doldrums, Bitcoin followed suit 14 days later — in this case, 204 days after Bitcoin’s block reward halving.
Let’s revisit some of the key moments when Bitcoin’s price reached ATH:
2012:
- Day 92 after Bitcoin block reward halving
- 15 days from the Dow breakout high
2016:
- 180 days after Bitcoin block block reward halving
- 57 days from the Dow breakout high
2020:
- Day 204 after Bitcoin block reward halving
- 14 days from the Dow breakout high
Following the Bitcoin block reward halving, the time spans we have seen Bitcoin price reach highs are: +92 days, +180 days, then +204 days. And for the multi-year corrected/consolidated Dow Jones, we see the time spans in which the Bitcoin price reached its high: -15 days, +57 days, then +14 days. So, which one seems more relevant?
There is an unpopular opinion in the encryption market, that is: the record ATH-All Time High of Bitcoin price is not due to the halving of the block reward, but depends on the ATH-All Time High set by the stock market.
Remember the chart mentioned above? Is the trend of the Dow Jones Industrial Average similar to the "double-click to break through the short squeeze and test the V bottom" on Ethereum?

Technically speaking, the intense backtesting phase is actually Wave-4 in the Elliott Wave Theory.
When we look at the Dow Jones Industrial Average next to ethereum... oh my god... the movements are too similar.
Then, when we zoomed out further from the Dow, and further down from Ethereum... oh my god... a similar trend emerged again.
So where is the Dow right now? See the figure below.
Summarize
The point of this article is that the time span between Bitcoin’s block reward post-halving and hitting a new all-time price high is increasing, compared to the time between Bitcoin’s price high and the Dow’s high Faster and smaller. The reason why I don’t believe in the 4-year bull market cycle of Bitcoin’s halving is because the price trend is actually more closely integrated with the Dow Jones Index, and the halving of the Bitcoin block reward may be just a “lucky timing”.
Not only that, but the idea that "Bitcoin may not hit ATH" appears in the encryption community because the bull markets in 2013, 2017, and 2021 all occurred after the Dow Jones index broke out. So the question now is whether the Dow will break out again and hit new ATH-All Time High- and if not, well, as we've seen from past market cycles, Bitcoin probably won't start a bull run.


