

Neither bulls nor bears are dominating today, according to the CoinMarketCap ranking.
Top coins by CoinMarketCap
BNB/USD
The rate of Binance Coin (BNB) has fallen by 6.76% over the last day.
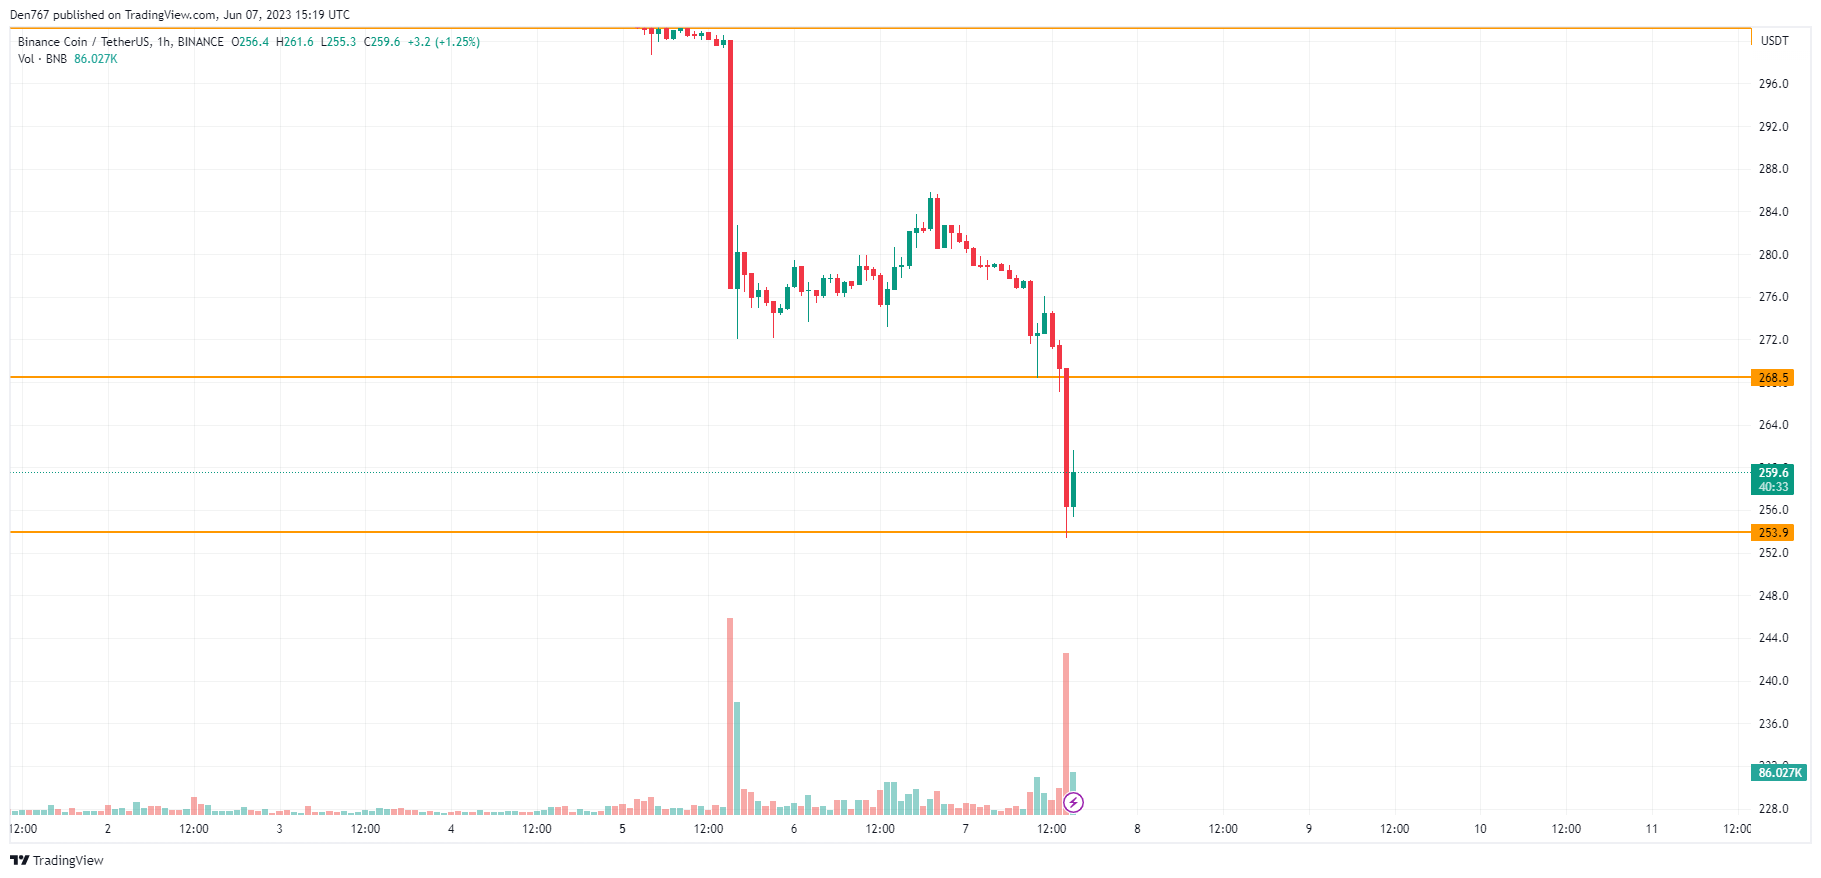
Image by TradingView
On the local chart, the rate of Binance Coin (BNB) has set the support level at $253.9. The volume remains high, which means that sellers might have started fixing their positions. If the price remains above the $250 zone, there is a chance to see a bounce back to the resistance at $268.5 tomorrow.
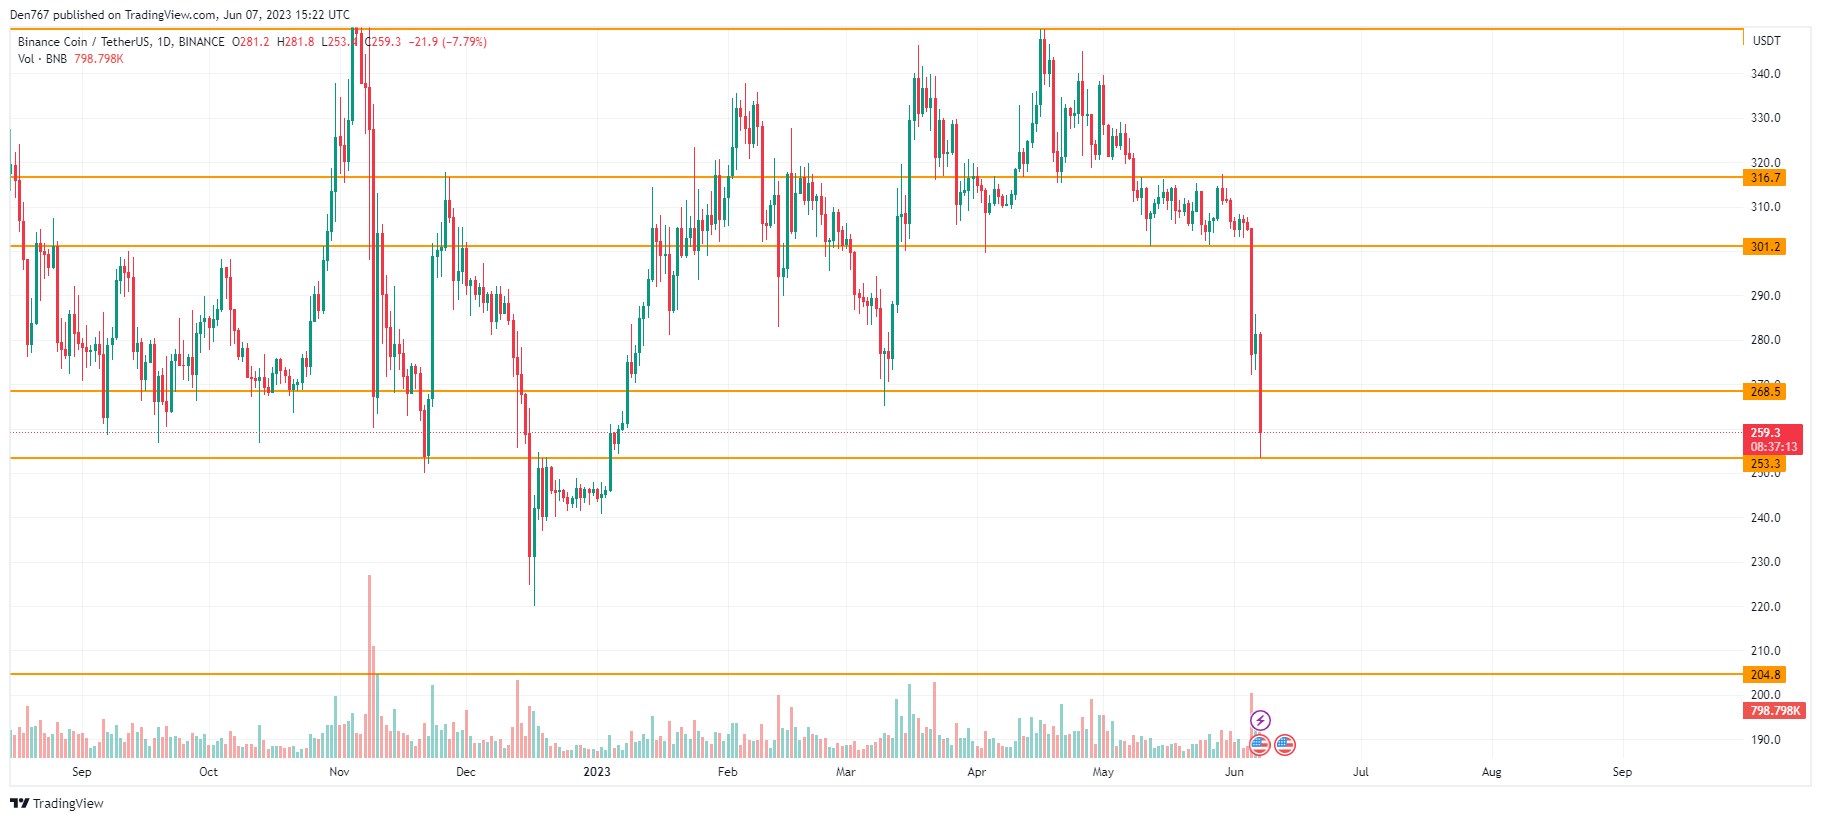
Image by TradingView
On the bigger time frame, the rate of BNB has tested the mirror level at $253.3. At the moment, traders should pay attention to the bar closure. If it happens with non-long wicks, the drop may continue to the $240-$250 area shortly.
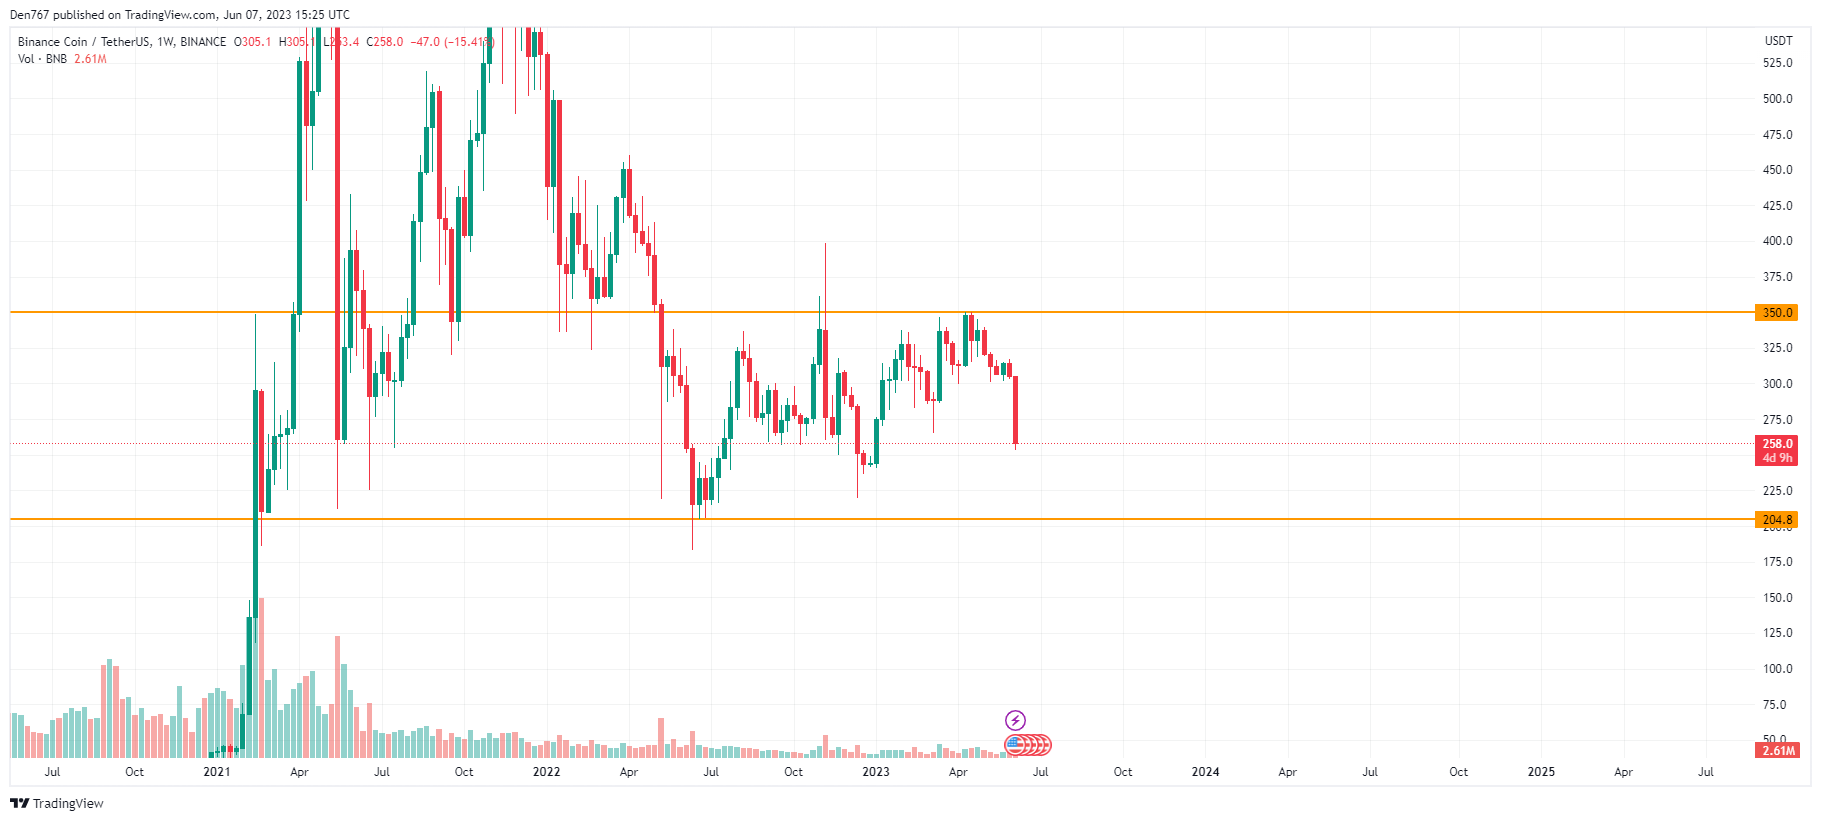
Image by TradingView
From the midterm point of view, bears have seized the initiative after a breakout of the $300 area.
Currently, an interim level of $240 plays a key role for buyers. If they lose it, nothing can stop the decline to the support level at $204.8.
BNB is trading at $258.2 at press time.


