

Click to watch the video: https://www.bilibili.com/video/BV1XC4y1K7Wf/?vd_source=04332ad6ecefd22ffa3d1b9032b40fb3
In today's video, let's talk about how to find the 100 times long buying point of Bitcoin. Yesterday, Bitcoin fell below the lifeline of our retail investors. The profits of spot and medium and long-term bulls are also retracing, but I have been there too. We plan to prevent the main force from doing so. If Bitcoin drops, we will look for a 100 times long position.
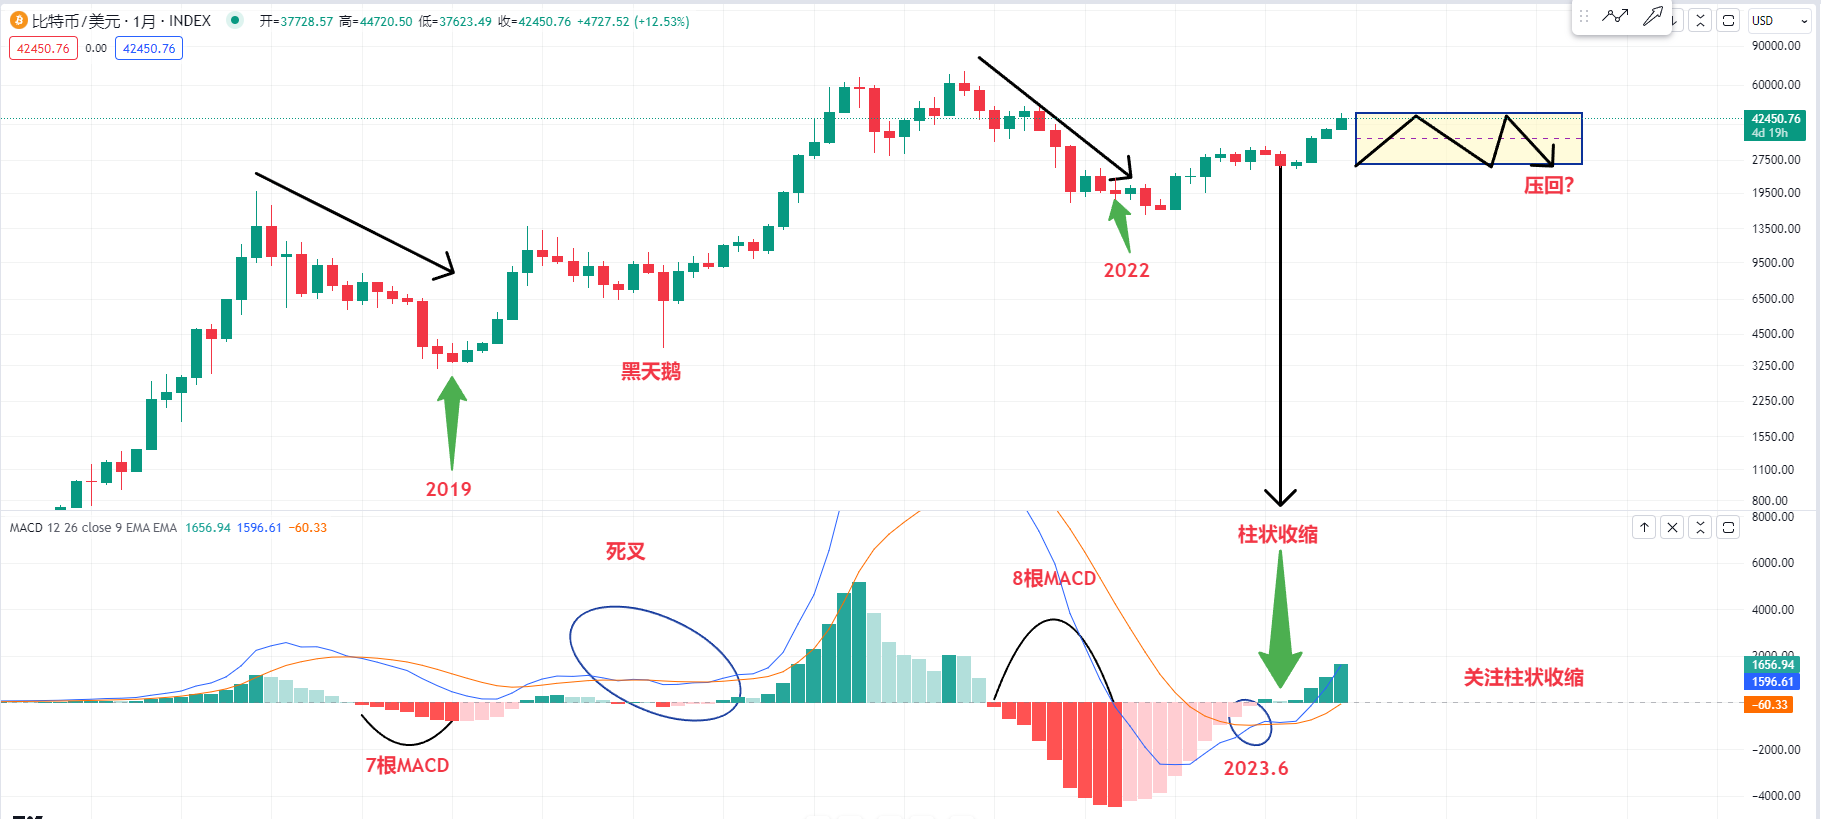
Let’s first take a look at Bitcoin’s monthly macd indicator. December is about to come to an end. Bitcoin’s monthly macd has risen for four months. Now, the macd indicators have all returned to above the zero axis. So my view is still unsustainable. It is still a bull market stage
Because the zero axis of the macd indicator at the monthly level is the balance zone of long and short, there will definitely be a larger rise in the future. Then we can look at the macd indicator in 2019 or 2020. The macd indicator is also above the zero axis, even if it has a death cross or In a black swan event, as long as there is a big drop, there will be funds to buy, and then there will be a big rise.
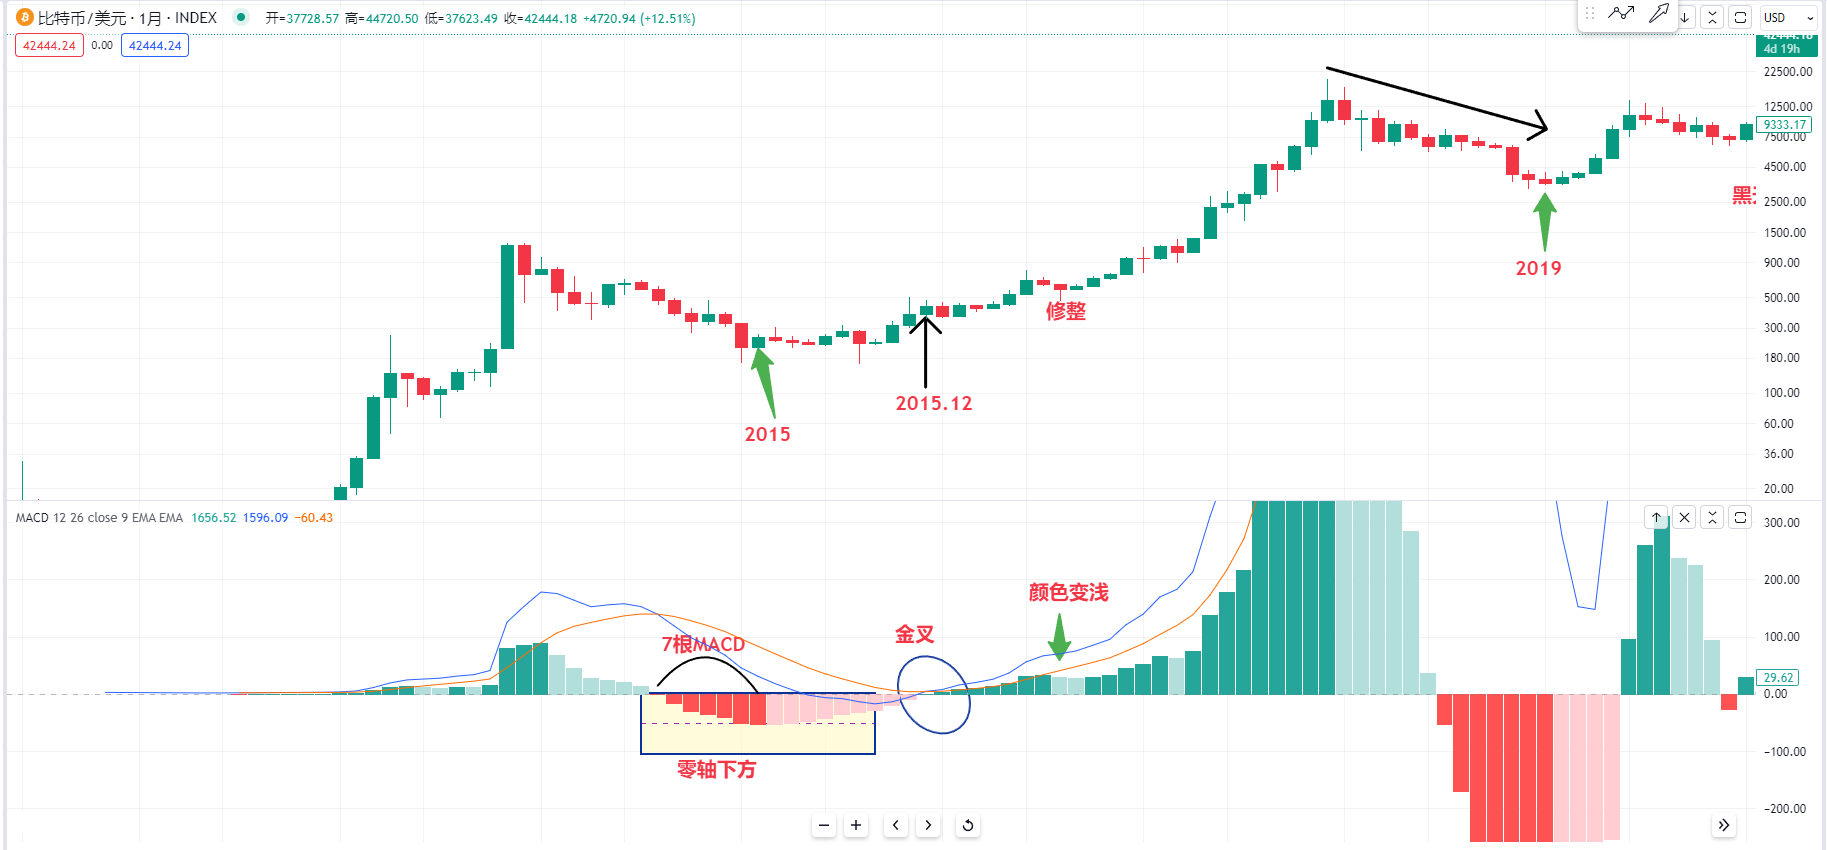
Including, we can take a look at the macd indicator that came below the zero axis in 2015, and then returned to above the zero axis after a golden cross. We can take a look at the subsequent rise, which is this kind of large-scale rise.
So let’s take a look at the method of buy the dips the monthly macd indicator. Last year I also said that if Bitcoin comes down from the top of the high point in history and the macd below falls and there are 7 to 8 macd red bars, it may be a very important bottom.
Last year, I said I could buy the dips the bottom when it was below 20,000, but I missed it because later there was a black swan event in which the FTX exchange collapsed. After it fell to 15,000, I continued to be firm because we have to follow the laws of history. The macd indicator fell. 7 to 8 may be a very important bottom range.
Because we can take a look at the bottom of Bitcoin in 2019. It came down from the high point and then fell to the bottom in 2019. The monthly macd indicator is also 7, so it is also very important here. The bottom should be bought at that monthly line. The level chart is different from the weekly or daily chart. It will not repeat death cross and golden cross.
So let’s observe that as long as there is such a crash in history, we should buy the buy the dips of the 7 to 8 macd lines, and then it will start to shrink the column or start a golden cross , but we have not seen a continuous collapse of 7 to 8 lines.
So let’s look at the bottom of Bitcoin in 2015. The macd indicator, which is also at the same monthly level, has 7 consecutive indicators, which is a very important bottom in 2015. After buying it, the indicator of Bitcoin has been shrinking at this position. From this position to the golden cross , I have also said that we should follow the laws of history. It is possible that Bitcoin may not rise in the next month or two after the golden cross.
Then we can take a look at the golden cross at this position in June. I also talked about the light-colored line here. You can’t chase long at the golden cross here. It may be at the monthly line level. You have to pay attention to it. There may be something behind it. There will be one to two months of adjustments
Then we have to observe the position of the real 100 times buying point. Why did we tell everyone to buy the dips when it was 25,000? We can look at it next if the column shrinks in the monthly line. This low point is very important to long 100 times. Bit
So let’s review the trend of Bitcoin at this position in December 2015. The macd below just started the golden cross position. It may not necessarily rise in the next month. A low like this is also an opportunity to long or Bitcoin later. continue to rise
Then let’s observe the position of 100 times long. You must pay attention to macd. If it is always increasing in volume, it may not always rise. It may need to be revised, especially the attacking side needs to be revised, so in the bull market, it is offensive. Bulls need funds
He has to keep selling high and buying low within the range, especially if the main force does some selling high and buying low, so that the funds on hand will snowball more and more. Then let's take a look at the macd column below his trimming position. If it is declining. Especially when the color of the first bar becomes lighter, we must pay attention to whether Bitcoin has a low point of sharp decline. If there are two bars, the low point may be our very important position of 100 times long.
So we observe the current market price of Bitcoin. After 4 months of rising, this bar has been enlarging. I believe it is possible. Bitcoin has risen too much. Bitcoin also needs to be corrected at this position. Is it going to consolidate in a box or should we prevent it? Let’s pay attention to when the column at this position will shrink when the box is arranged to be pushed back.
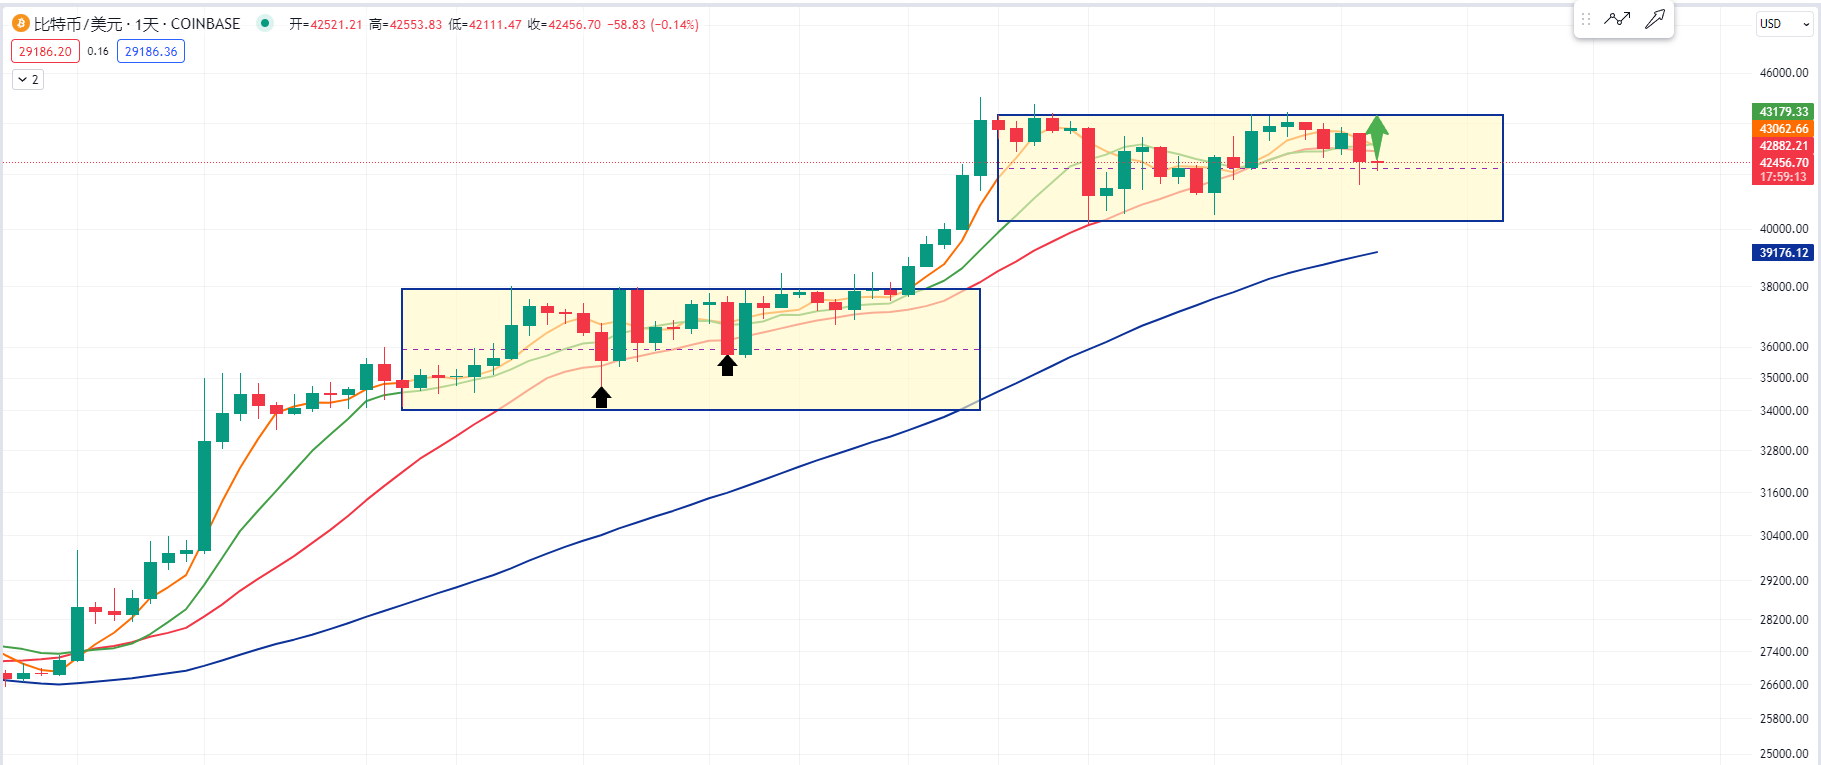
Then let’s take a look at the daily chart of Bitcoin, because yesterday’s K-line has already broken the red 20MA, our lifeline for retail investors. My point of view is that in the short term, since it has broken the 20-day moving average, our retail investors long. Try to find the lowest point
Or at this position, if the main force of Bitcoin wants to defend, it means that it will continue to attack strongly. Let’s observe it. Just like the previous positions, it also fell below the 20-day moving average, but the second one must rise immediately, so today we will try our best to observe The price should not fluctuate within the shadow line. If there is a strong situation, there must be another rising green K at this position, and then it is possible to break through this high point.
Otherwise, my view is to wait as long as possible. Since the 20-day moving average has been broken, or there is a 60-day moving average below, let's try to observe whether it will support this line.
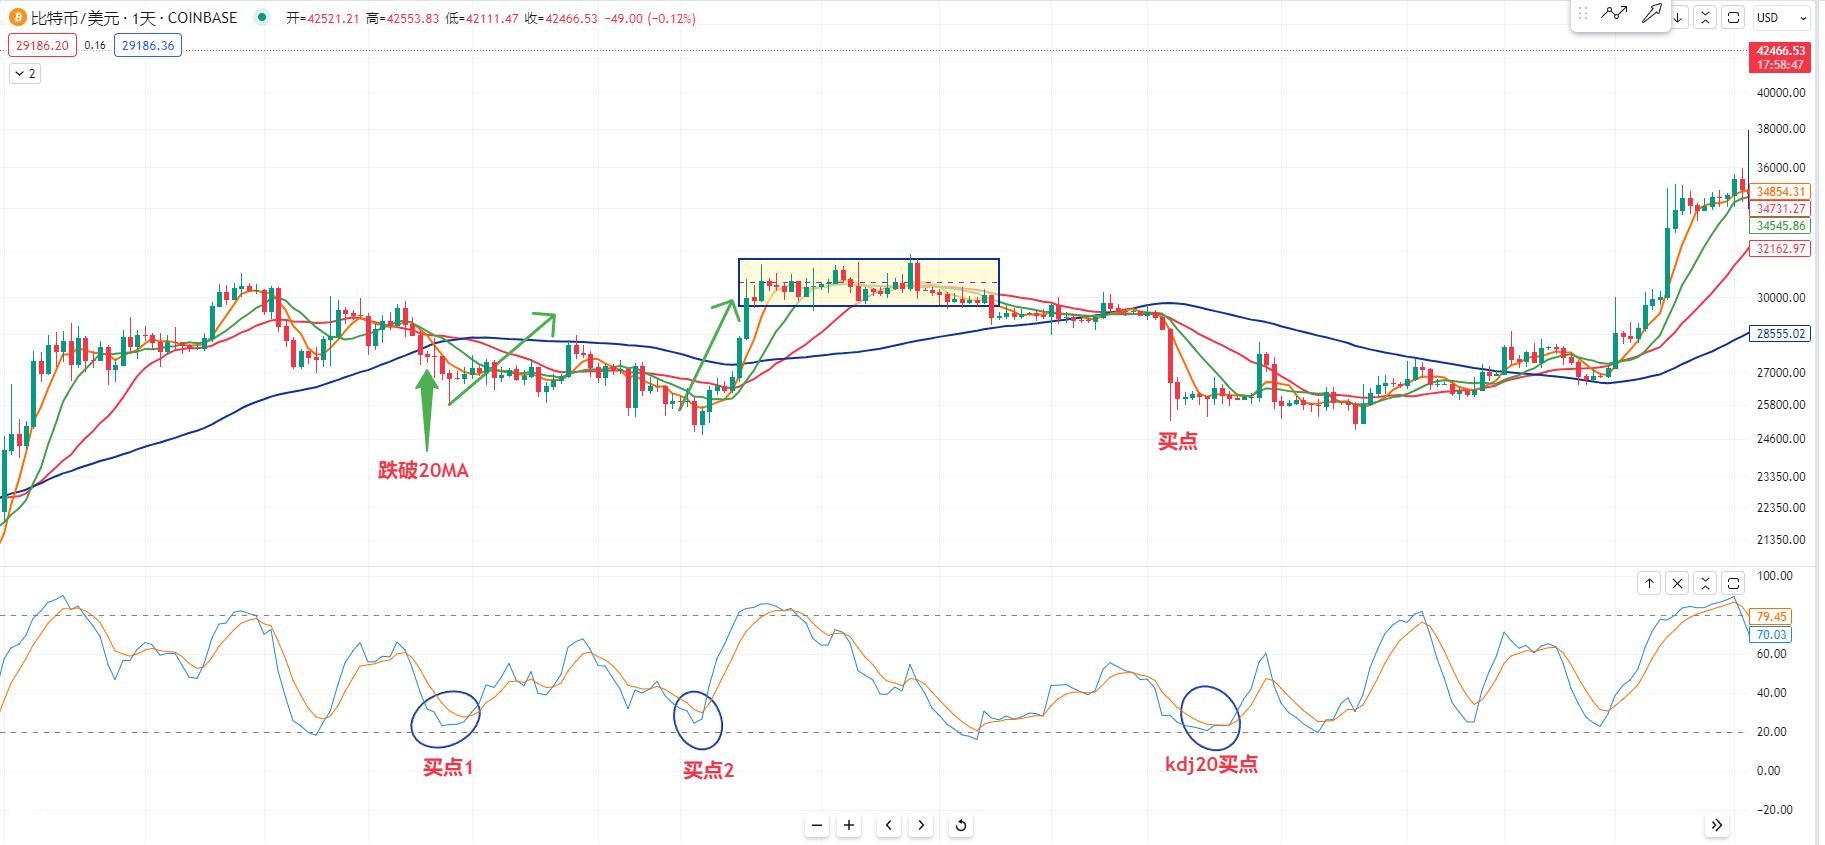
Or if we observe the previous positions, we have also told you that if this red 20-day moving average falls below, then we will observe the KDJ indicator below and may find a buying point around 20, such as the buying point in this range or The previous position fell below the 20-day moving average. The positions of these buying points are that the KDJ indicator is very close to 20, which is also a very important buying point. Some may be short-term and some may be mid-line buying points.
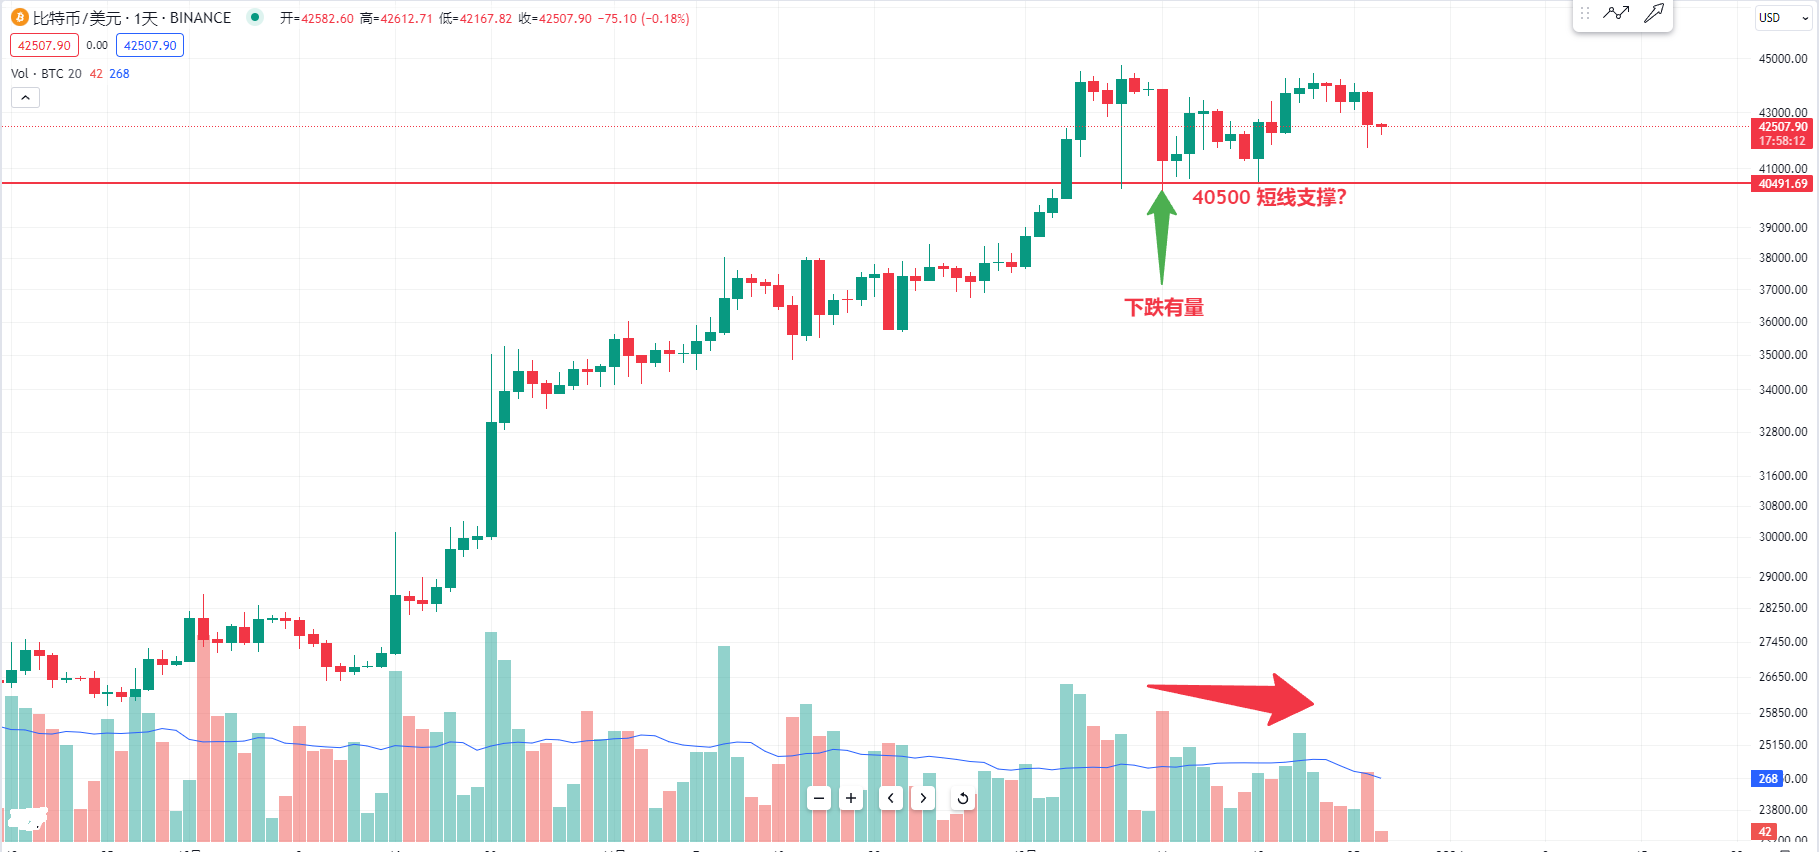
Then let's take a look at the daily level of Bitcoin. The volume energy below yesterday's decline has increased a lot, so there is volume when it starts to fall from here. However, there are several times when the volume energy rises and does not exceed the volume energy of this short K-line, so We try our best to observe that it is possible that the main force of Bitcoin is also correcting in this range. Then we also need to observe whether this 40500 will be a short-term support.
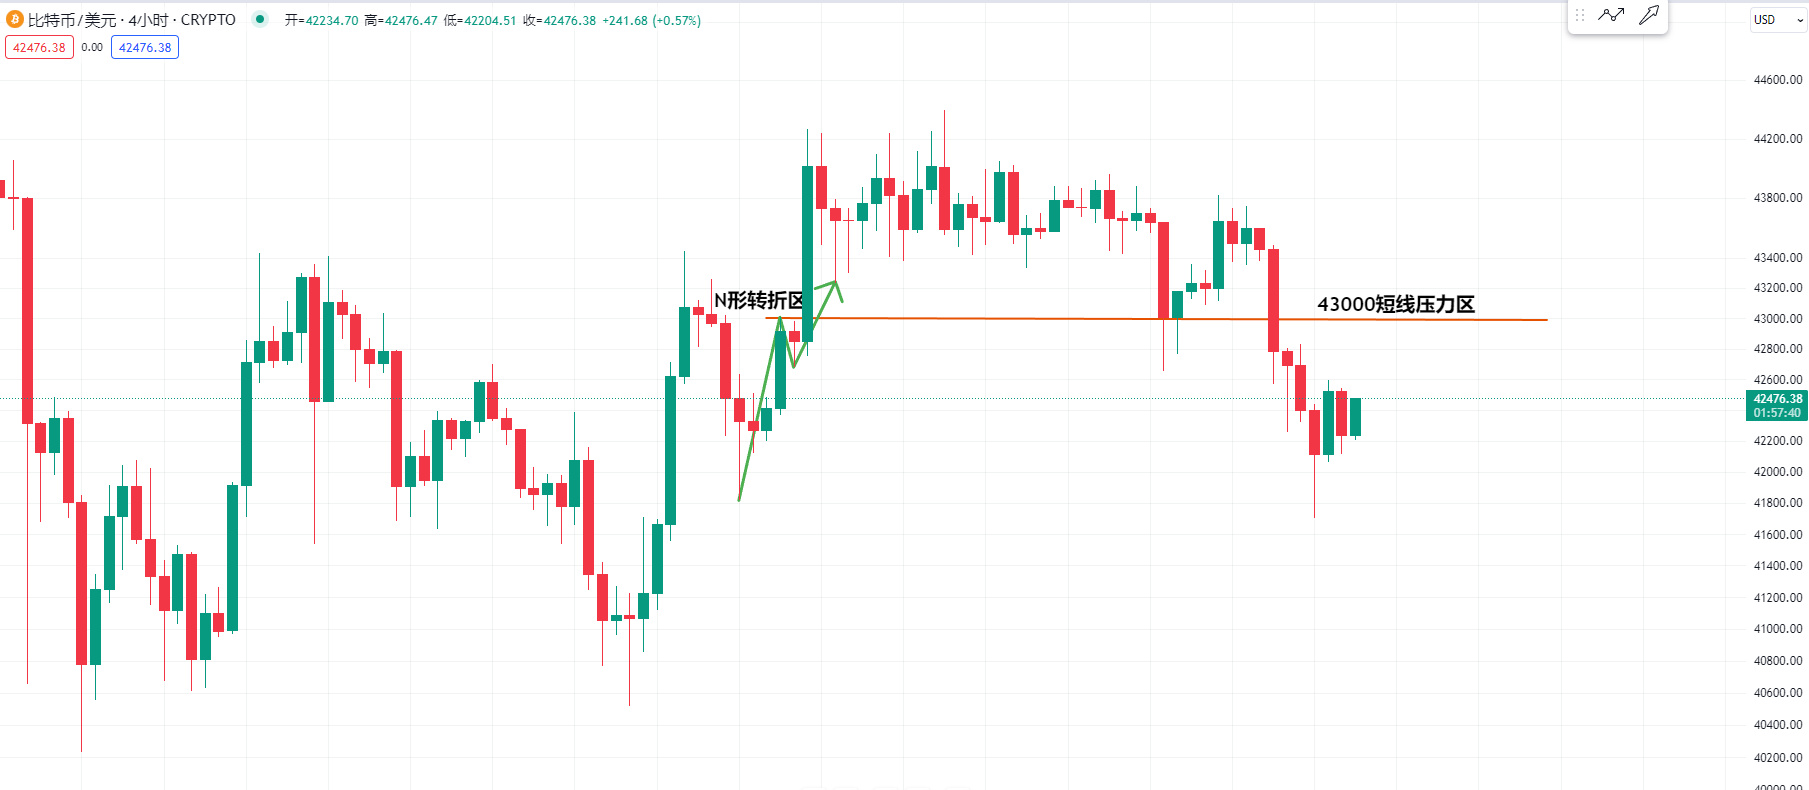
There is still a 4-hour pressure level, which is probably at this low point. There is an N-shaped turning area running through it. There will be a short-term pressure area around 43,000.
More strategies can be added to the real offer
The K-line is king and the trend is king. I am Master Chen. I have been focusing on BTC and ETH spot contracts for many years. There is no 100% method, only 100% following the trend. Macro analysis articles and technical reviews are updated on the entire network every day. Analyze videos.

Warm reminder: This article only has the official column account (pictured above) written by Master Chen. Other advertisements at the end of the article and in the comment area have nothing to do with the author himself! ! Please be careful to distinguish between true and false, thank you for reading.

