

Bitcoin’s (BTC) price was noted to have a considerable drawdown in the last three days, which brought BTC below $58,000. While many consider this to be the beginning of the bear market, it is simply a cool-down.
The mid to long-term outlook for the digital asset is still bullish and Bitcoin will likely validate this in the coming weeks.
Bitcoin Investors Are Still Focused on HODLing
Bitcoin’s price took a hit over the past 48 hours after exhibiting consolidation for the past couple of weeks. The drawdown across the crypto market wiped out nearly $600 million in two days, spooking investors.
However, looking at BTC on-chain metrics, it seems that this decline was expected, and it is nothing but a short pause in the long-term rally. The Coin Days Destroyed (CDD) over a period of 90 days shows that long-term holders (LTHs) are largely anticipating a further run-up in Bitcoin’s price.
Low levels of CDD recorded mean investors are more likely to either accumulate or be less eager to spend their holdings due to the lower Bitcoin price. This reinforces optimism toward recovery, confirming the recent correction to be merely a market cool-down and not the beginning of a bear market.
Read More: Bitcoin Halving History: Everything You Need To Know
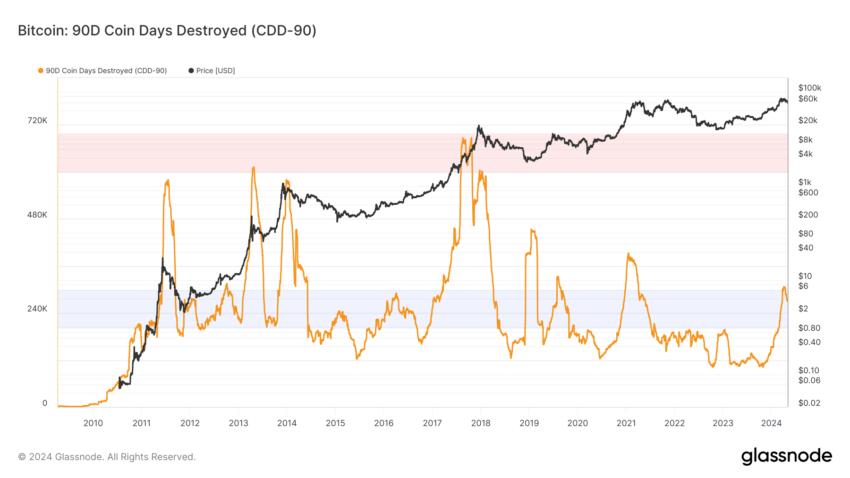 Bitcoin 90-day Coin Days Destroyed. Source: Glassnode
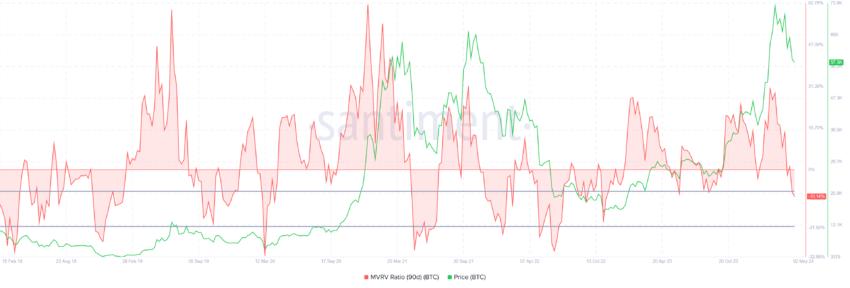
Further substantiating this is the Market Value to Realized Value (MVRV) ratio. The MVRV ratio gauges investor profit or loss. With Bitcoin’s 90-day MVRV at -9.5%, indicating losses, it is likely investors will hold off selling or move to accumulate BTC.
Historically, recovery happens within the -8% to -21% MVRV range, which often precedes rallies. Thus, this zone has been dubbed an accumulation opportunity zone.
If BTC holders act accordingly, Bitcoin’s price could soon see a recovery.
 Bitcoin 90-day MVRV Ratio. Source: Santiment
BTC Price Prediction: Bullish Flag Persists
Bitcoin’s price trading at $57,444 is reeling from the drawdown that pulled BTC below $60,000. However, the digital asset is still above the lower trend line of the flag that BTC has been moving in for the past two months.
The flag pattern is characterized by a sharp price movement followed by a consolidation period in the form of a rectangular flag. The breakout from the flag pattern indicates the continuation of the uptrend.
The target for Bitcoin’s price based on the pattern is still $92,505, which would mark a 45% rally above the breakout point. However, the more practical target is a rally above $73,700 to push BTC toward a new all-time high.
Read More: What Happened at the Last Bitcoin Halving? Predictions for 2024
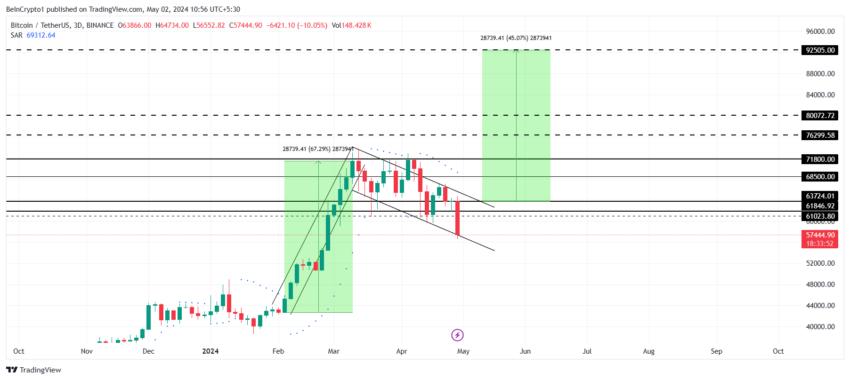 Bitcoin Price Analysis. Source: TradingView
This would require Bitcoin’s price to flip the $71,800 resistance into a support floor by first breaching the $68,500 barrier.
However, if BTC holders move to offset their losses and sell their holdings, the cryptocurrency could fall through the lower trend line. This would result in Bitcoin’s price falling below $52,000, effectively invalidating the bullish outlook.


