Today
Intel
Market
Earn
Settings
Account
Theme Selection
Light
Dark
Language
English
简体中文
繁體中文
Tiếng Việt
한국어
Followin APP
Mine Web3 Possibilities
App Store
Google Play
Log in
wdctll
32,773 Twitter followers
Follow
求其中得其上
Posts
Signal Clone Analysis
wdctll
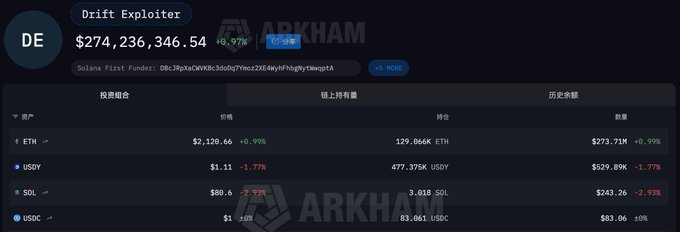
In such a bear market, I can't believe there's still so much money deposited in this lousy project. twitter.com/wdctlllltcdw/statu...
wdctll
04-01
BTC finally closed positive on the monthly chart, which wasn't easy.
wdctll
@wdctlllltcdw
03-30
明天不跌 就能收阳了 本月收阳概率挺大😂 x.com/hellosuoha/sta…
BTC
0.15%
Loading..