🚨 RAVE Market In-Depth Analysis: Textbook-Level "Spot Market Manipulation + Derivatives Meat Grinder" - The Killing Potential is Already Emerging!
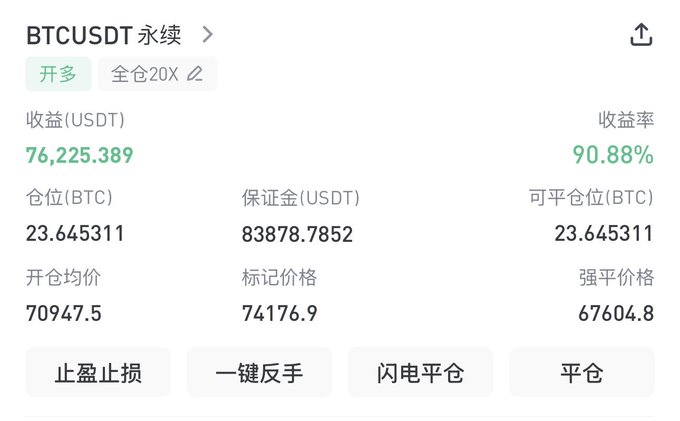
The collaboration and airdrop were just a cover. RAVE's true circulating market capitalization is extremely small and its shares are highly concentrated, while the contracts have gathered a massive amount of funds of nearly $500 million (the third largest in the world).
The market is currently showing an extremely unusual and potentially dangerous combination of signals: new price highs + declining open interest (OI) + extremely negative expense ratios.
The main players have revealed their hand; a killing spree is about to begin.
1️⃣ Strange Data Fluctuations: Major Players Are "Shedding Their Shells"
The current high OI (Online Index) continues to decline, indicating that funds in the market are withdrawing. The previous violent surge has wiped out the short sellers, and there is no fuel for further price increases.
At this moment, the major players are taking advantage of the liquidity of retail investors who are chasing the market due to FOMO (fear of missing out) to quietly close out the huge long positions at the bottom and cash out, using "low-volume support" to cover their retreat.
2️⃣ Vampire Logic: Why are the rates still extremely negative?
This is the most insidious trap in this situation. Although the major players are retreating, a large number of stubborn retail investors are still trying to short the market and sell at the short.
The major players don't need to fight it out in the contracts; they only need to use a very small amount of capital to lock the spot price at a high level, creating a huge premium.
The result? The big players do nothing all day but collect the "funding fees" paid by retail short sellers and make huge profits for free. The big players are withdrawing while sucking blood.
3️⃣ Where is the top? When will the guillotine fall?
For cryptocurrencies with strong market manipulation, never try to guess the specific "price peak," but keep an eye on the "data peak"!
There is only one sign: the short sellers are wiped out, and rates are recovering.
When retail investors who short sell are drained of funds or become completely desperate, and the funding rate rapidly approaches or even turns positive—the major players' ATM fails.
At this point, the major players will withdraw their spot orders and immediately short sell at higher prices. Due to the extreme lack of liquidity on the blockchain, what follows is a stampede-like plunge with a massive bearish candlestick!
❌ Absolutely forbidden: Short by touching the top on the left side.
Don't short on the left side; follow the trend! Blindly short not only risks being stopped out by the main players' "snapshot" tactics, but also leads to high capital costs during prolonged sideways trading. Before the crash, your margin will be wiped out.
✅ Right-side sniping: Closely monitor position data, wait for a significant rebound in funding rates + a break below the lower edge of the high-level trading range on the candlestick chart, then short the market in line, setting a stop-loss at the previous high to directly capture the main downward wave of the sharp drop!
At this stage, long positions must secure their profits. The big players are sharpening their knives at any moment, ready to overturn the table, just waiting for a signal of a change in fees.
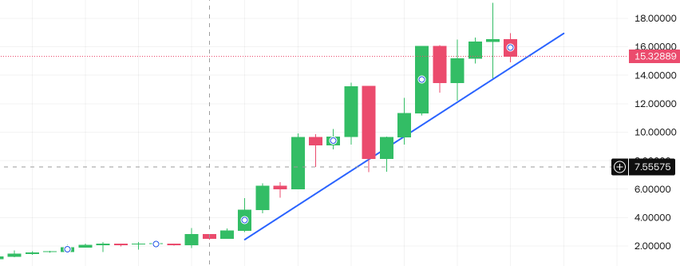
It's quite clear at this stage that we've reached the final decisive moment. The 15-20 range is a highly certain top, and it's just a matter of who can hold out until the end!
twitter.com/cloakmk/status/204...