Today
Intel
Market
Earn
Settings
Account
Theme Selection
Light
Dark
Language
English
简体中文
繁體中文
Tiếng Việt
한국어
Followin APP
Mine Web3 Possibilities
App Store
Google Play
Log in
Maartunn
Follow
Market Watcher 👀 || Founder @diveonchain 📈 || Community Manager @CryptoQuant_NL 👨💼 || Verified Author @cryptoquant_com 🏆 || Based in the Netherlands 🇳🇱
Posts
Maartunn
🚀 Traders using my @breakoutprop code have already withdrawn $413,244 💸 ✅ 48 traders 📈 $8,609 avg per trader If you’ve been asking what prop firm I use… here it is. Use code MAARTUN 👇
Maartunn
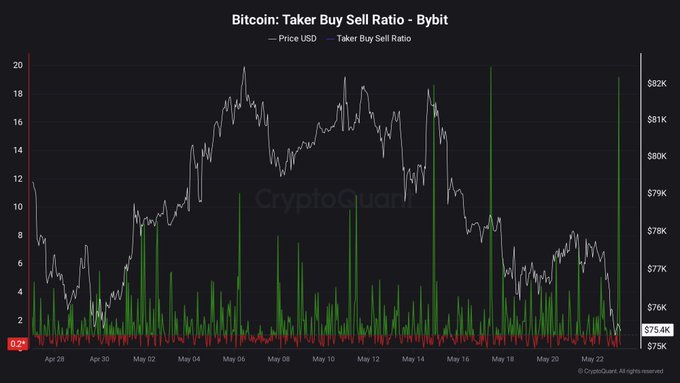
Bybit apes pushing massive longs again. Last two time, they got owned ☠️
APES
2.51%
Maartunn
05-22
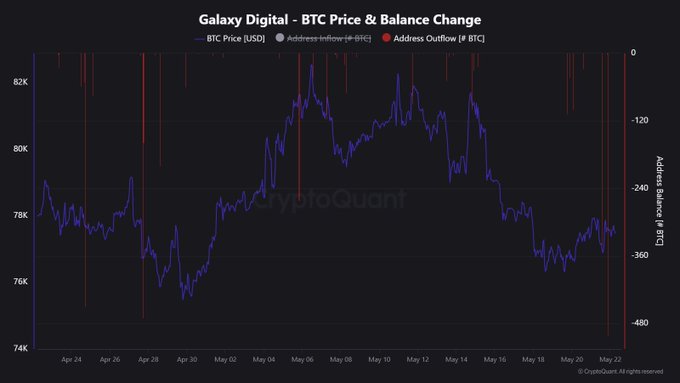
🚨 JUST IN: Galaxy Digital moved 860 BTC in the past 24 hours 👀
BTC
0.63%
Maartunn
05-21
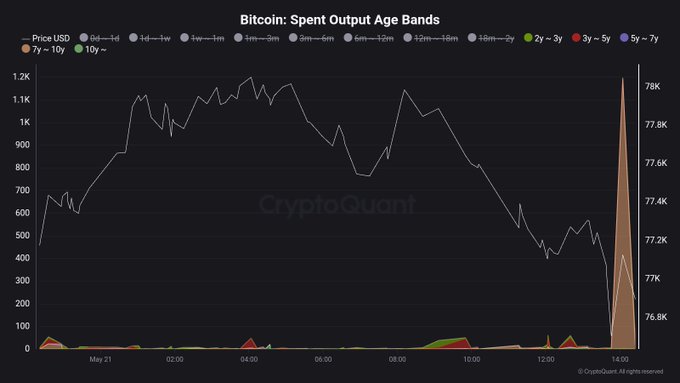
Old Bitcoin on the Move. [Current Value] • 7y ~ 10y: 1,191.13 BTC
BTC
0.63%
Maartunn
05-21
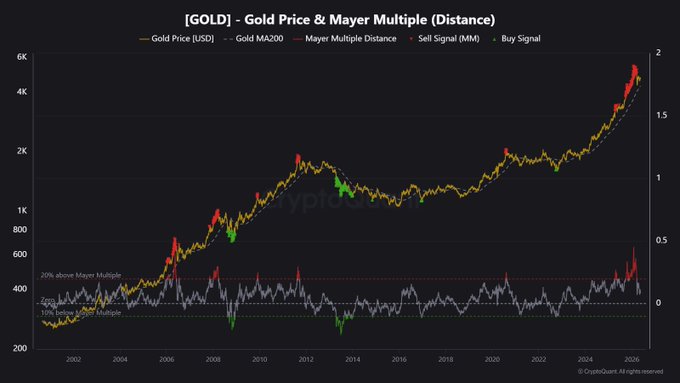
🥇 Gold is starting to cool off After becoming the most extended above the Mayer Multiple in over 20 years.
Maartunn
05-21
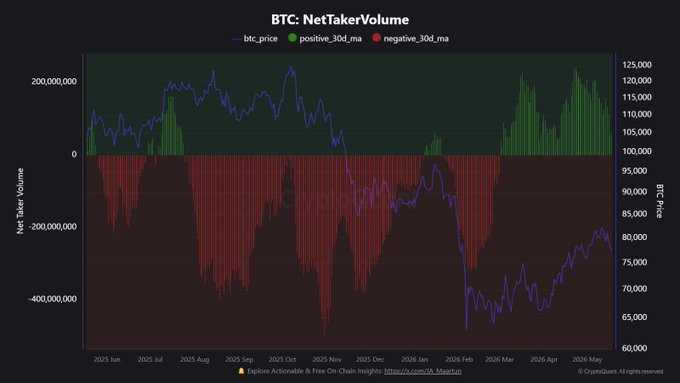
And it makes sense 😬 ETH Net Taker Volume has been negative for the past couple of days, while BTC Net Taker Volume is still positive, though clearly declining. twitter.com/JA_Maartun/status/...
ETH
0.42%
Maartunn
05-21
Breakout differs from your usual exchange: ⚡ Trade firm capital, not just your own 💸 Max risk = small eval fee 📈 Keep the profits Perfect for skilled traders with a proven track record — where talent > bankroll. You can get a discount on Evaluation using: Maartun
EVAL
0.81%
Maartunn
05-20
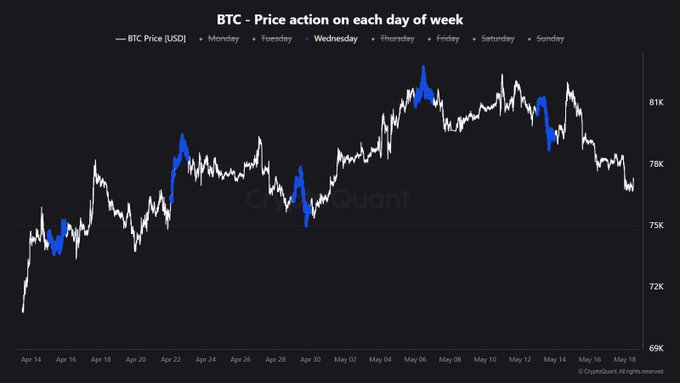
Beautiful day for trading. Love to see it on a Wednesday 📈
Loading..