The recent drop on $BTC, calculated over a 200-day retracement period, reached -5.65σ, representing an extreme fat-tailed event in the statistical distribution. Even considering the inherently high volatility of the crypto market, this level of price movement has only occurred four times since $BTC began trading, making it extremely rare.
We conducted a comprehensive review of this drop:
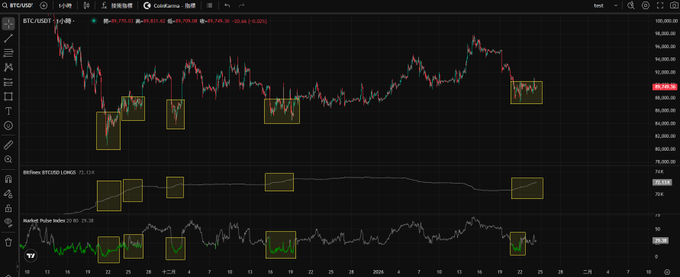
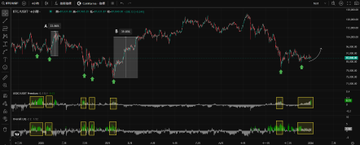
✳️ Perpetual Contract Data: In the past, when the market experienced significant long deleveraging and a rapid decline in OI (Open Interest), short covering typically led to a temporary rebound. However, after this drop below 80,000, even though perpetual contract open interest has clearly decreased, the market still faced unexpected and sustained selling pressure, and the anticipated rebound did not occur.
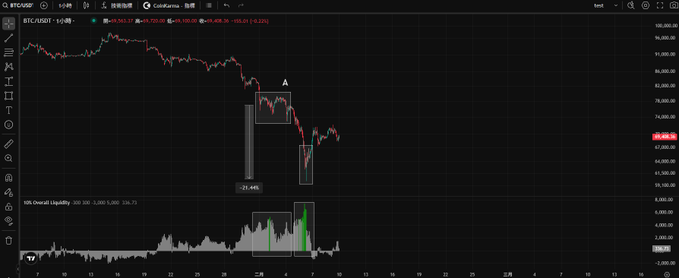
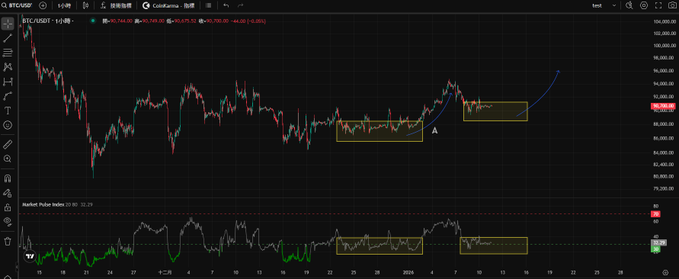
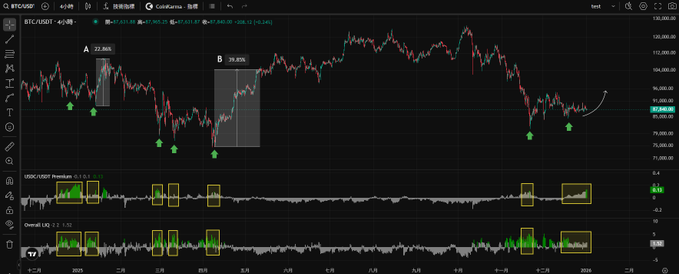
✳️ Overall Spot Liquidity: In past sharp declines, the market typically bottomed out when 10% Overall Liquidity (BTC) > 5,000 BTC. However, when this condition was first met (as shown in point A in the chart), the price subsequently fell by more than 20%, which is extremely rare historically.
✳️ Significant Divergence from US Stocks: It is worth noting that the S&P 500 only fell by about 3% from its high during the same period, a stark contrast to the more than 50% drop in the crypto market. This indicates that the driving factor for this round of decline is more inclined towards structural deleveraging within the crypto market than a systemic sell-off in global risk assets.
Whether it's a quantitative model or a data indicator, they are essentially built on historical inertia, which inevitably fails in extreme fat-tailed events. This is a price that all strategies based on historical data cannot completely avoid.
Since the high point last October, $BTC has fallen for nearly 5 months, with a maximum drawdown of over 50%. Structurally, the market has undergone a complete mid-term correction. Currently, prices show initial signs of stabilization in the 60K range, and the 60K-75K range is expected to become the new trading range. However, as mentioned earlier, any judgment based on historical inertia should be approached with caution in extreme market conditions. Continued data observation is needed to confirm whether a relatively balanced range has truly been established.
Want to seize immediate trading opportunities? Join our 14-day free trial now!
👉 http:/coinkarma.pse.is/7wsxnl