How much is the market reflecting war risk?
Conclusion: The market is underestimating war risk.
I have given this some further thought based on the post I wrote yesterday.
First, I believe the polymarket is the most objective in terms of the probability of an event occurring, because "dark insiders" are active within it.
Let's look at the data first:
📌 Past War Data
2025 12-Day War: -1%, recovered within 1 week
2003 Iraq War: Did not drop. Rising from the start of the war. +26.7% over 12 months
2001 9/11: -11.6%, initial recovery in about 1 month (later fell again due to the dot-com aftermath)
2022 Russo-U.S. War: -7.4%, recovered after about 2 years
1990 Gulf War: -16.9%, recovered 6 months after hitting a D+50 low. +29% rally since
1973 Yom Kippur: -48%, 6 years to recover
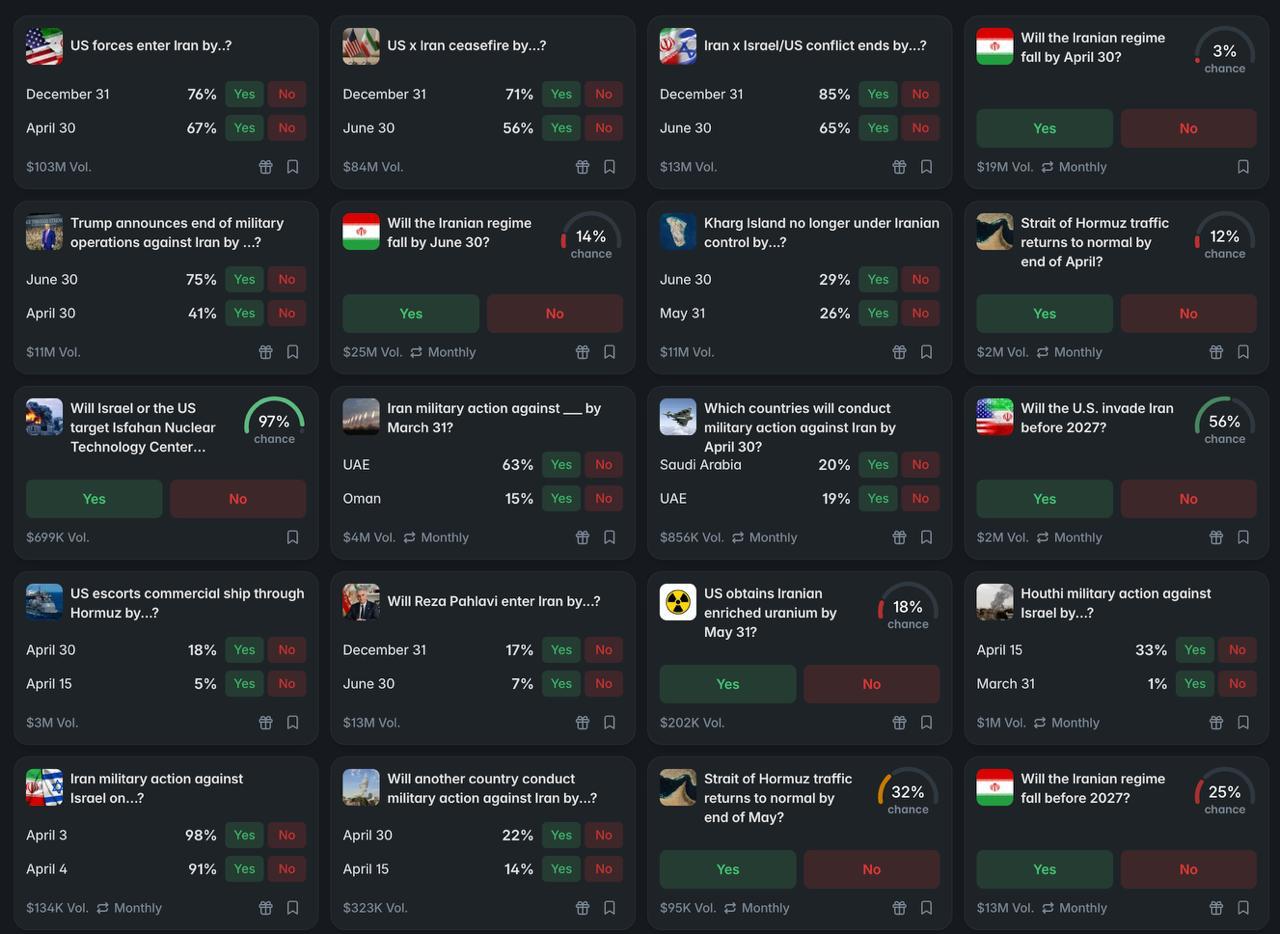
👀 Polymarket Odds
Hormuz normalization by late May: 32%
Conflict ends by 12/31: 85%
→ Working backwards: Probability of end between summer and year-end = 85% - 32% = 53%
→ Probability of not ending within the year = 15%
I'm going to do the calculations based on the information above. I'm not very knowledgeable about it myself, so I had Claude do it. If it's wrong, it's Claude's fault!
🔥 Calculations by Scenario
Base Price: S&P 6,880 (Last closing price before war), KOSPI 6,244 (Last closing price before war)
Current Price: S&P 6,575, KOSPI 5,377
Scenario A: Normalization of Hormuz by late May (Early end of war)
Probability: 32%
Reference Pattern: 2025 12-Day War
Return to pre-war levels.
S&P → 6,880 (+4.6% from current)
KOSPI → 6,244 (+16.1% from current)
Scenario B: End of war between summer and year-end
Probability: 53%
Reference Pattern: 1990 Gulf War
During the Gulf War, the S&P fell to -16.9% from the start of the war before rebounding.
The low point was D+50, and the current war against Iran is D+25.
Applying Gulf War Trajectory:
S&P Low = 6,880 × 0.831 = 5,717 (May not have reached yet)
Current Fair Value = Midpoint between Low and Rebound = Approx. 6,100
Applying a 2.5x reaction rate to KOSPI for S&P:
Gulf War S&P -16.9% → Converted to KOSPI -42%
However, it has already dropped -19%, and an additional -10~15% is possible from here
Current Fair Value = 6,244 × 0.75 = Approx. 4,683
S&P → 6,100 (-7.2% compared to current)
KOSPI → 4,683 (-12.9% compared to current)
Scenario C: No conclusion within the year (Expansion/Prolonged war)
Probability: 15%
Reference Pattern: 1973 Yom Kippur
At Yom Kippur, S&P -40.9% after 12 months.
At the current point (D+25), it is still early, at approximately -16%.
A trajectory of continued decline thereafter.
For the KOSPI, the maximum drop during the 2022 Russia-U.S. War (-35% from the year-high) serves as a realistic reference point.
-40–45% if accompanied by an economic recession.
S&P → 5,780 (-12.1% from current)
KOSPI → 3,559 (-33.8% from current)
Now, if we combine these probabilities and consider the probability-weighted fair value:
S&P 500:
(6,880 × 0.32) + (6,100 × 0.53) + (5,780 × 0.15) = 6,302
-4.2% from current 6,575
KOSPI:
(6,244 × 0.32) + (4,683 × 0.53) + (3,559 × 0.15) = 5,014
-6.7% from current 5,377
🧠 Interpretation...
1) The market is slightly optimistic
A discrepancy of about -4% for S&P and -7% for KOSPI.
2) For the market to justify the current price, a probability of ~75% for Scenario A is required.
Since the probability in the Poly Market is 32%, there is a significant discrepancy.
This implies that the market is that optimistic.
3) The KOSPI is more optimistic.
This seems to be because the KOSPI moves significantly even with minor news. However, since the recent low was just above the 5,000 mark and the fair value is 5,014, the days of extreme fear could actually be seen as the days when the market properly reflected the war risk.
4) Scenario B has the highest probability at 53%.
War continues until summer → Oil prices maintain an average of $85–$95 → End of war in the second half of the year.
In this scenario, the KOSPI fair value is 4,683.
This calculates to a potential drop of -13% from the current 5,377.
Based on Gulf War patterns, the low point would be around D+50.
Since it is currently D+25, there may be about 5 weeks left until the low point. It is late April to early May.
I had a lot of thoughts running through my head, so I sold off about half of my holdings during today's rebound.
However, since this is just an analysis I did for fun, please do not use it as a basis for judgment; I ask that you also just view it for entertainment.
Please leave a comment sharing your thoughts.