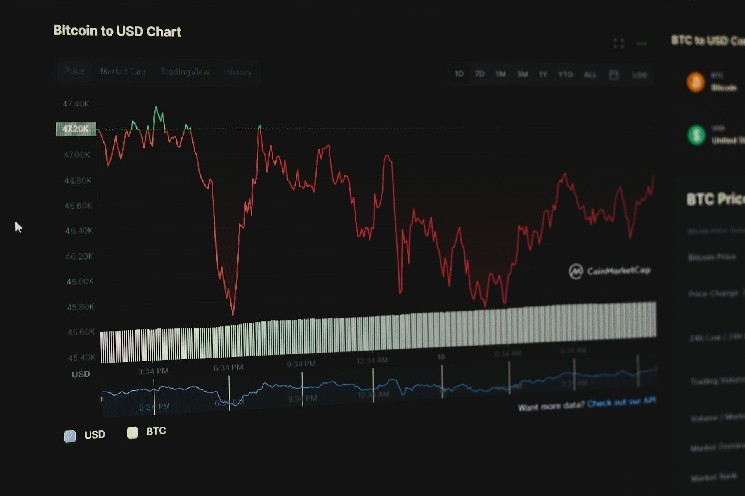
Bitcoin price analysis today May 24
Let's refer to today's bitcoin price analysis on May 24 to make the right decisions with this asset!
Bitcoin price continues to correct and trade below the $68,800 support level. BTC is currently facing hurdles near the $70,000 resistance zone.
- Bitcoin extended its decline below the $68,800 support zone.
- The price is trading below $69,000 and the SMA 100.
- There is a key bearish trend line forming with resistance at $69,200.
- BTC may continue to move unless the bulls push it back above $70,000.
BTC Critical Support
Bitcoin price began a downward correction below the $70,000 support zone . BTC bears were able to push the price below the key support at $68,800. It caused bearish moves and the price dropped to $66,250.
A low was formed at $66,250 and the price is currently consolidating losses. There was a small increase above the $67,250 level. The price broke above the 23.6% Fib retracement level of the downward move from $70,500 to $66,250.
However, the bears are active near the $68,350 level and the 50% Fib retracement level of the downward move from $70,500 to $66,250. Bitcoin price is currently trading below $69,000 and the 100 SMA .
If there is a fresh increase, the price could encounter resistance near the $68,350 level. The first major resistance level could be at $68,800. There is also a key bearish trend line forming with resistance at $69,200.
The next key resistance could be at $70,000. A clear move above the $70,000 resistance could send the price higher. In the said case, the price could rise and test the resistance at $70,500.

Source: TradingView
If the bulls push the price further, there could be a move towards the $71,200 resistance area. Any further gains could send BTC towards the $71,800 resistance level.
In case BTC drops further
If Bitcoin fails to rise above the $69,800 resistance area, it could continue to move down. Immediate support on the downside is near the $67,250 level.
The first major support is at $66,800. The next support is now forming near $66,250. Any further losses could push the price towards the $65,000 support zone in the near term.
Technical indicators:
Hourly MACD – MACD is currently slowing down in the bearish zone.
Hourly RSI – The RSI for BTC/USD is currently below the 50 level.
Key support levels – $67,250, followed by $66,250.
Key resistance levels – $68,350, $68,800 and $70,000.
According to NewsBTC
The post Bitcoin price analysis today May 24: continued volatility appeared first on CoinPlus .


