BONK, a Solana-based meme coin, is one of the top cryptocurrencies that has seen notable price growth recently. On July 16, the price of BONK fell from $0.000028 to $0.000025.
A day later, the token price revisited the above-mentioned highs. However, the reasons why BONK's upward trend may pause for a while and then continue its upward trend are as follows.
Rally slumps due to bearish sentiment
BONK’s incredible surge was accompanied by an unprecedented increase in trading volume. However, volume was down at press time, suggesting the upward trend is weakening.
By looking at the daily charts, you can get more insight into the price movement of “Solana Dog, for the people, by the people.”
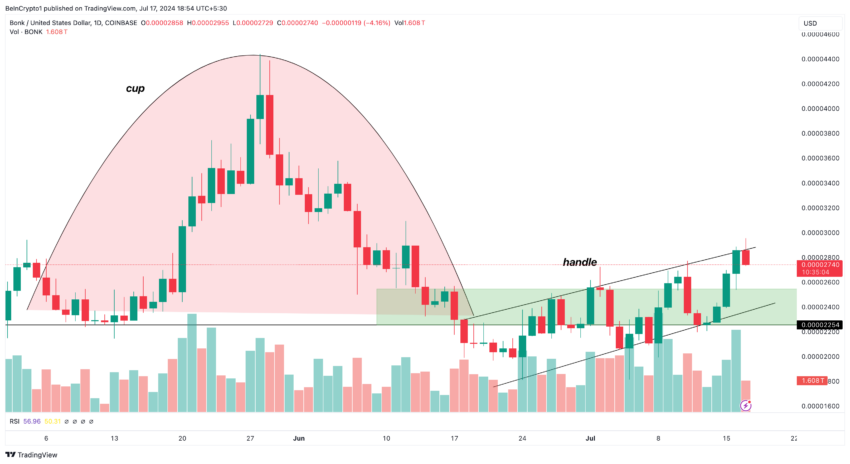
First, BeInCrypto observed that the meme coin was forming an inverted cup and handle pattern on the chart. This technical pattern is the opposite of the usual cup and handle formation.
Unlike the latter, the inverted cup and handle pattern signals the end of an uptrend. Technically, the price falls after reaching a new high, as shown below.
Even after that, BONK may continue to lose upward momentum . If this pattern holds, BONK's next move could be a bottom consolidation where the price could move between $0.000022 and $0.000025.
Read More: 11 Solana Meme Coins to Watch for in July 2024

However, the uptrend will continue even after the bulls bottom out, depending on where the bulls find strong support.
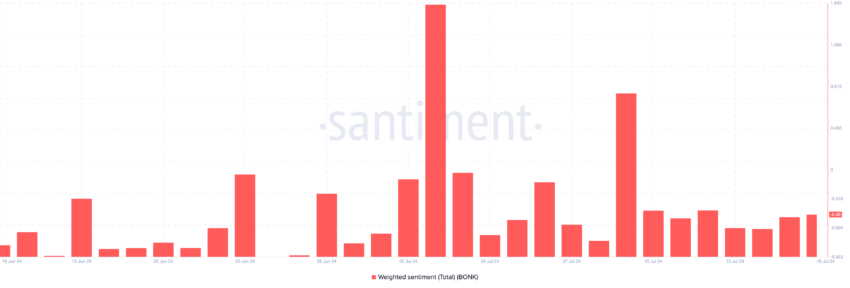
Another factor that helps with predictions is weighted sentiment. According to Santiment, the weighted sentiment for the token is -0.49.
This indicator measures the perception market participants have about a project online. If the number is positive, it means that most comments about that cryptocurrency are optimistic.
However, in the case of BONK, the negative numbers mean that social media discussions about the meme coin are mostly bearish.

If this sentiment remains the same, demand could deteriorate, which lends credence to predictions that BONK will remain flat for the time being.
BONK Price Prediction: If Momentum Loses, What's Next for $0.000024?
Regardless of the sentiment shown, the indicators on the daily chart are consistent with the above predictions.
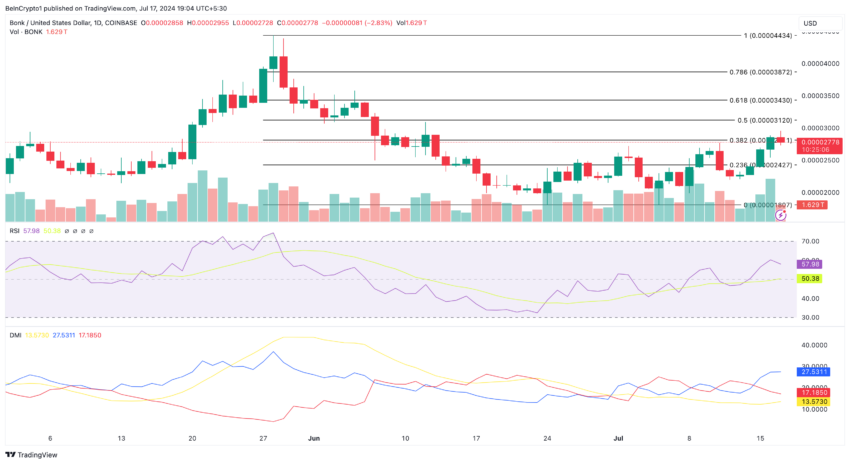
For example, the Relative Strength Index (RSI), which measures momentum, initially rose to 60.45. However, it has now fallen to 56.83, indicating that upward momentum is waning.
Additionally, the Directional Movement Index (DMI) is also showing similar movements. DMI measures the strength and direction of the token price.
As of this writing, +DMI (green) is higher than -DMI (red), meaning buyers are stronger than sellers. However, for BONK's upward trend to continue, the Average Directional Index (DMI) must support the advance.
Read more: Best Airdrop Predictions for 2024

This requires ADX (yellow) to be at least 25.00. However, at press time, this number is lower, reinforcing the idea of a bottom or downward trend.
According to the Fibonacci retracement tool, BONK's next target could be $0.000024. However, this prediction will be invalidated if meme coins begin to lead a broad rally again.
In this case, BONK price would retest $0.000028 and a move to $0.000031 would be possible.


