

After a brief pullback, Bitcoin (BTC) has continued to advance towards the psychological resistance level of $70,000. This shows that every small dip is being bought. CryptoQuant CEO Ki Young BTC said in a post on
The world's largest Bitcoin Miners , Marathon Digital Holdings, added $100 million in Bitcoin to its Bitcoin holdings over the past month to bring its total to over 20,000 Bitcoins. The company's CEO and president, Fred Thiel, said in a July 25 X post that Marathon “will now be fully HODLing” to keep Bitcoin as their strategic treasury reserve asset.
While most analysts are optimistic over the long term, some have turned cautious in the near term. Capriole Investments founder Charles Edwards said that the launch of a spot Ether ETF in a weak market could create selling pressure on Bitcoin if some institutional investors plan to diversify their holdings.
Will Bitcoin hit $70,000 or could higher levels see a strong sell-off by bears? Let's analyze the charts of the top 10 cryptocurrencies to find out.
Bitcoin recovered from the 20-day exponential moving Medium ($64,283) on July 25, signaling sentiment remains positive.
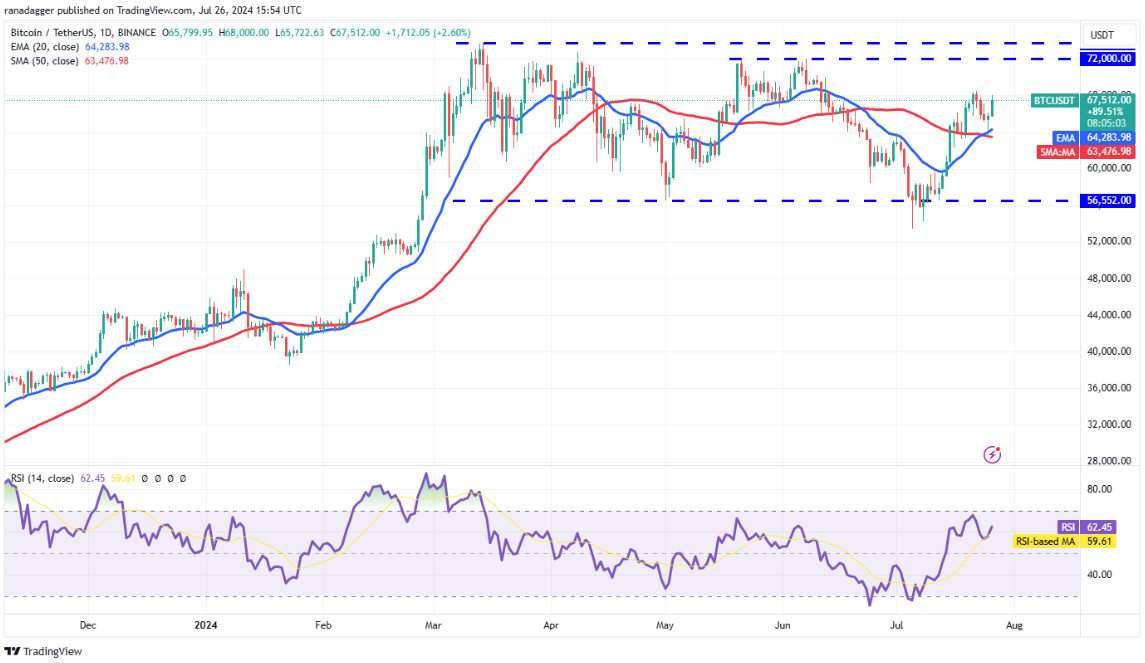
BTC/ USDT Daily Chart | Source: TradingView
The bulls will attempt to overcome the barrier at $68,500 and reach the overhead resistance at $72,000. Sellers are expected to be fiercely defensive in the $72,000-$73,777 zone. If the price declines sharply from this zone but finds support at the 20-day EMA, it will signal that the bulls are still in control. That would improve the prospects of a breakout above $73,777.
The 20-day EMA remains an important level to watch out for in a bearish trend as a break below this level will indicate that the bulls have given up. That could push the BTC/ USDT pair down to $60,000.
Ether broke below the moving Medium on July 24 and continued to slide on July 25, showing that bears are attempting to form a lower high at $3,563.
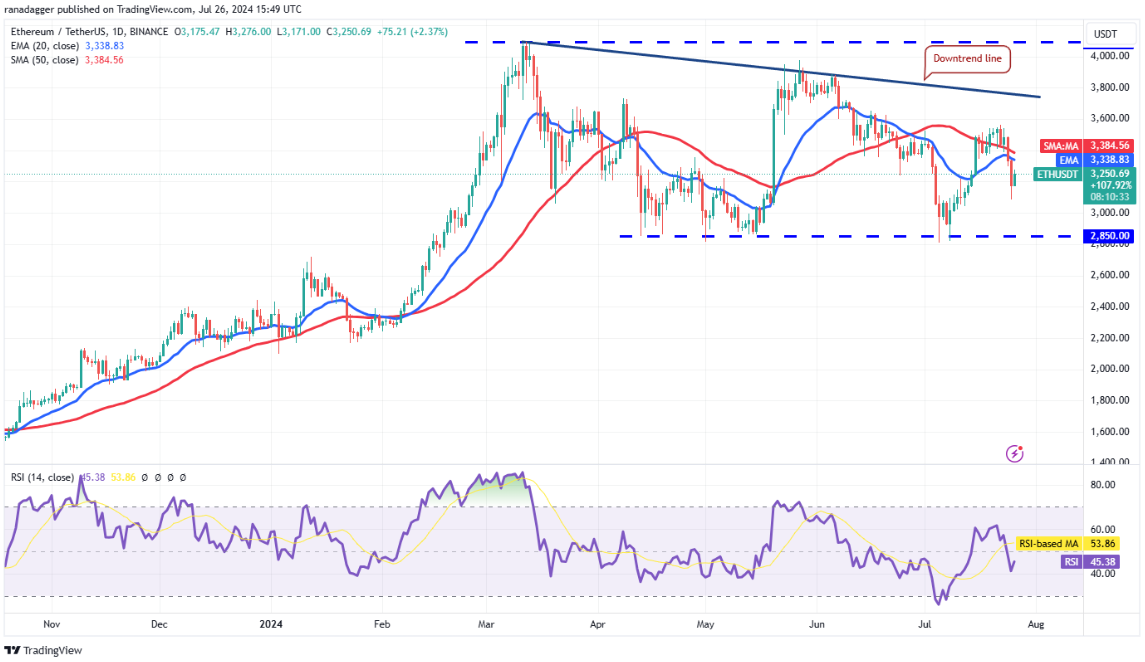
ETH/ USDT Daily Chart | Source: TradingView
The moving Medium have started to slope down and the RSI is just below the midpoint, suggesting a slight advantage for the bears. If the current recovery stalls at the moving Medium , it will increase the possibility of a drop to $3,000.
Conversely, if buyers push the price above the moving Medium , it will signal that lower prices continue to attract buyers. The ETH/ USDT pair could rise to $3,563 and then the downtrend line.
BNB (BNB) slipped below the 20-day EMA ($570) on July 25, but the long tail on the candlestick indicates buying at lower levels.
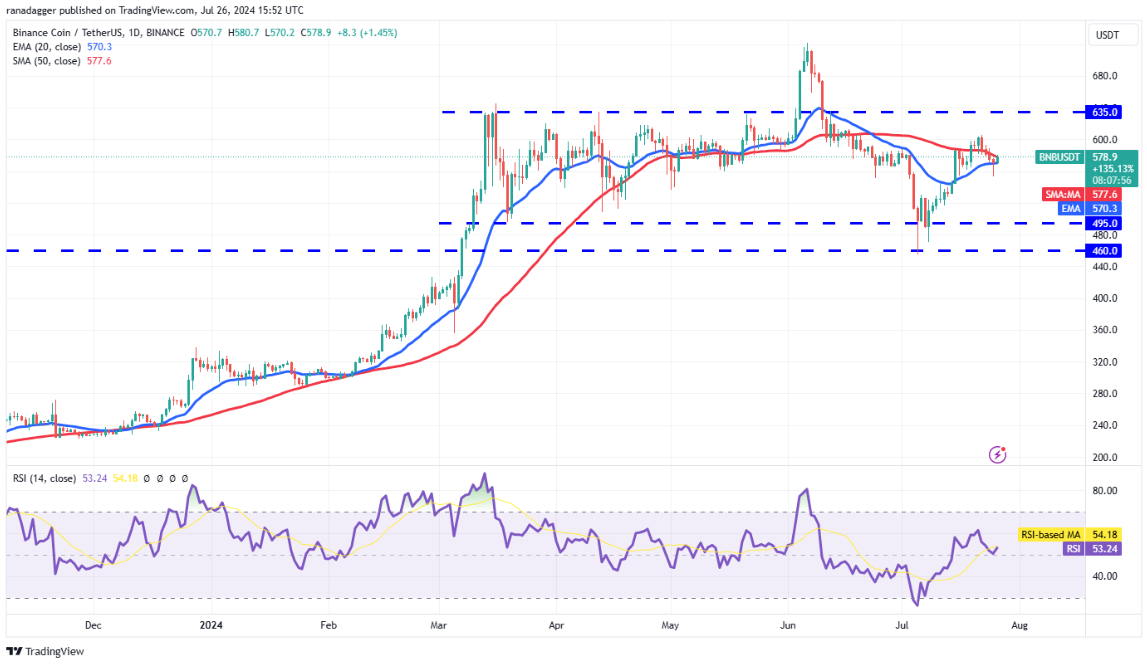
BNB/ USDT Daily Chart | Source: TradingView
The bulls will make another attempt to push the price to the $635 resistance. Sellers are expected to defend this level with all their might as a break above it would pave the way for a rally to $722.
This bullish view will be negated in the near term if the price turns down and breaks below $550. Such a move would signal that the BNB/ USDT pair is likely to spend more time within the $495 to $635 range.
Solana (SOL) bounced from the downtrend line on July 25, showing that the bulls are attempting to turn this level into support.
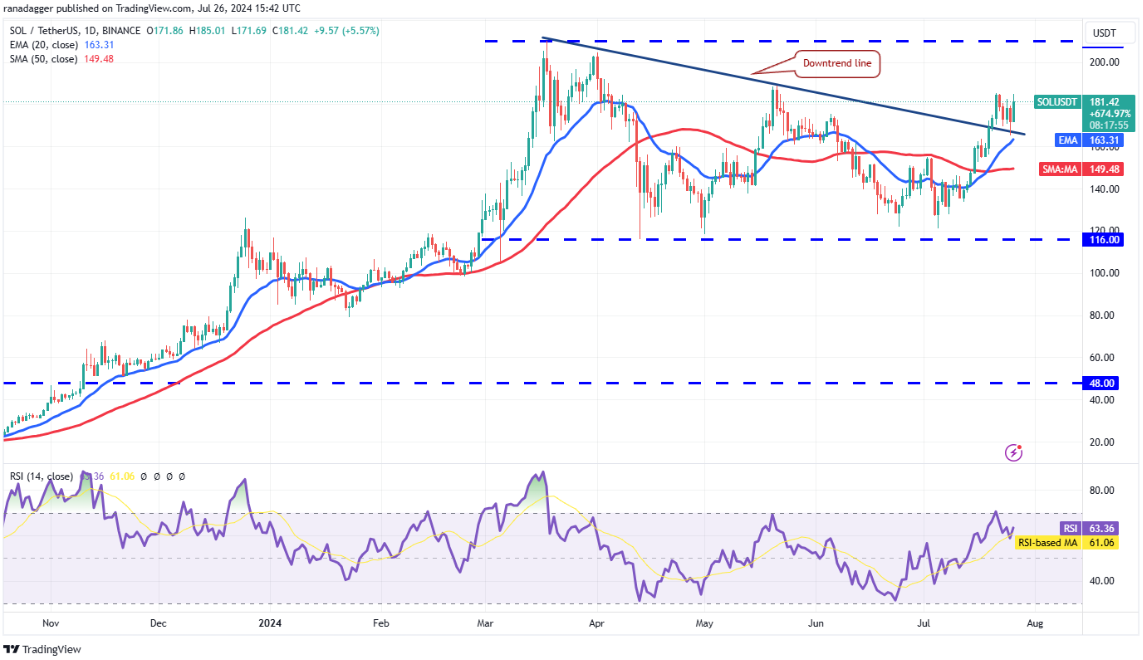
SOL/ USDT Daily Chart | Source: TradingView
The upsloping 20-day SMA ($163) and the RSI in the positive zone suggest that the bulls have the advantage. A break and close above $189 would open the door for a rally to the $210 resistance.
Alternatively, if the price turns down from $189 and breaks below the 20-day EMA, it will indicate demand exhaustion at higher levels. The pair could then drop to the 50-day SMA ($149).
XRP (XRP) turned down from the $0.64 resistance on July 25, showing that bears are active at higher levels.
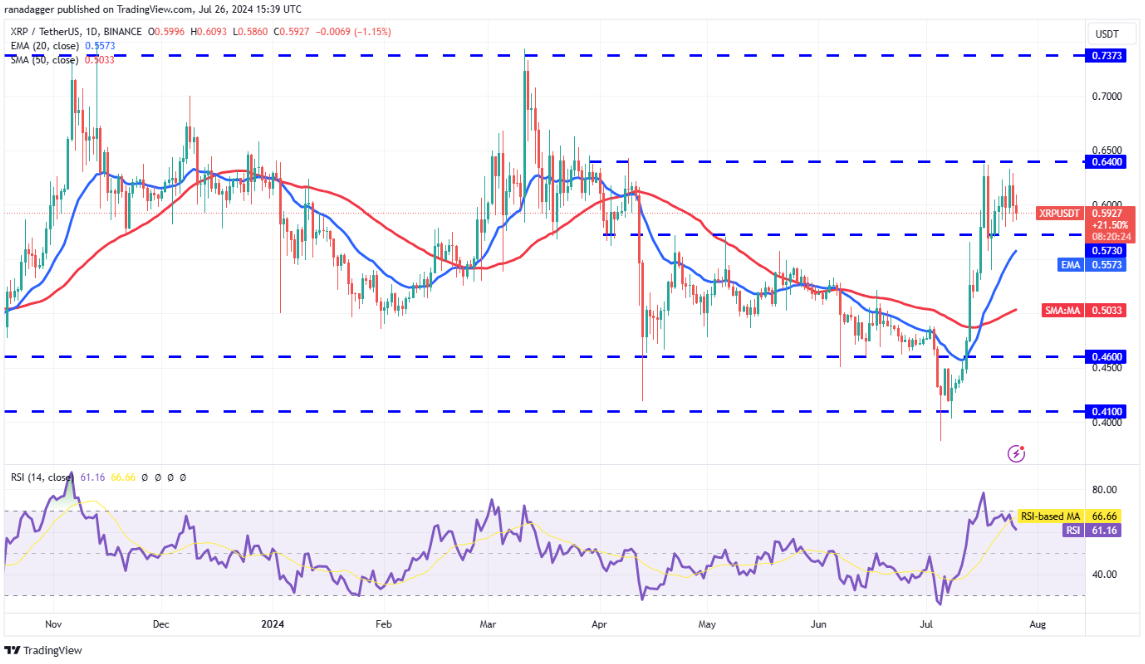
XRP/ USDT Daily Chart | Source: TradingView
The XRP/ USDT pair is stuck between $0.57 and $0.64. The upsloping 20-day EMA ($0.56) and the RSI in the positive zone suggest that the bulls have the advantage. If the price breaks above $0.64, the pair could begin its journey towards the formidable barrier at $0.74.
Conversely, if the price turns down and breaks below the 20-day EMA, it will show that the short-term bulls are booking profits. That could start a move down to the 50-day SMA ($0.50), signaling the formation of a large range between $0.41 and $0.64.
Dogecoin (Doge) bounced from key support at $0.12 on July 25, showing that buyers are trying to defend it.
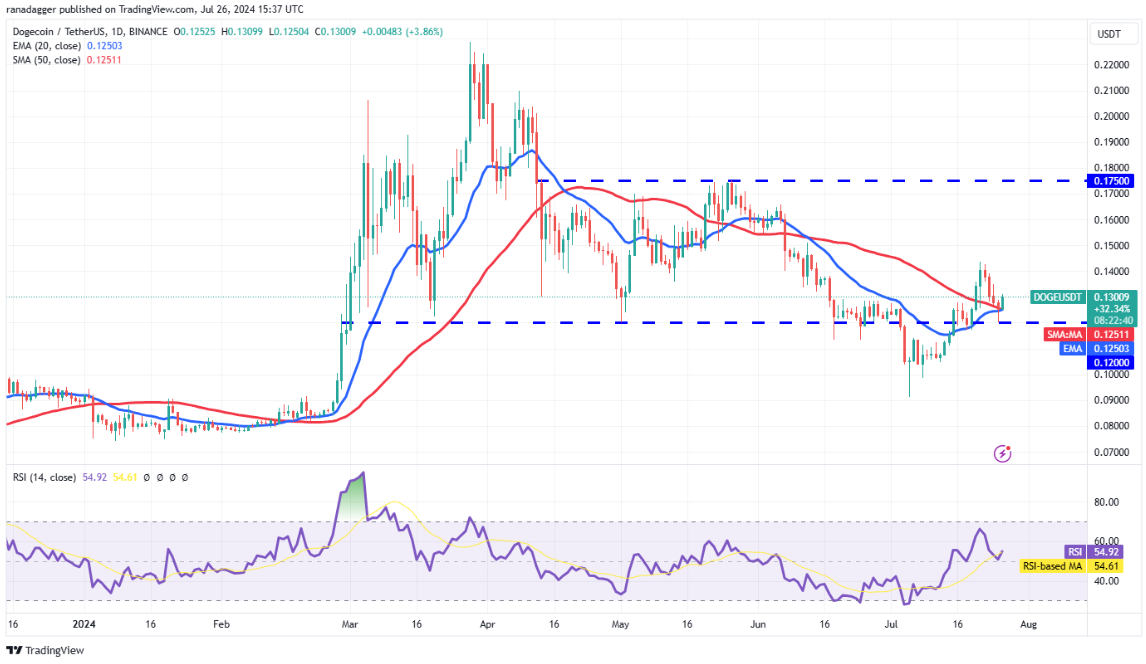
Doge/ USDT Daily Chart | Source: TradingView
The bulls will try to consolidate their position further by pushing the price above the $0.14 resistance. If they can succeed, the Doge/ USDT pair could rally to $0.18, where the bulls are likely to face strong selling from the bears.
This positive view will be invalidated in the near term if the price plummets and breaks below $0.12. That could accelerate selling and push the pair down to $0.10, a level where bulls are expected to enter.
Toncoin (TON) broke and closed below the $6.77 support on July 25, completing a double top.
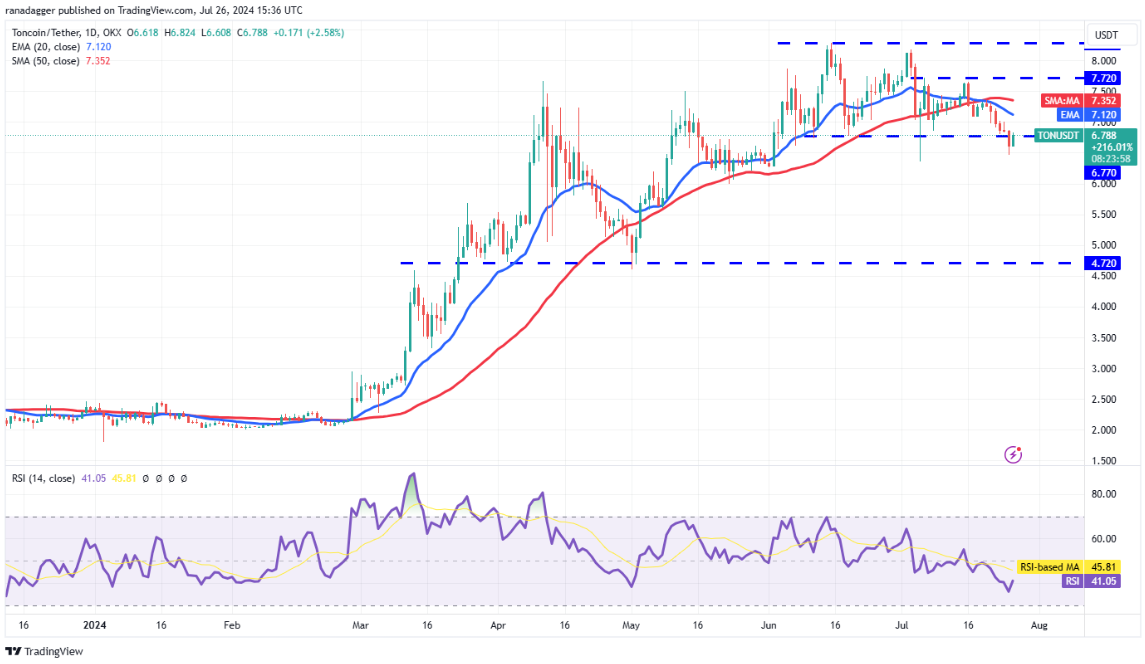
Daily TON/ USDT chart | Source: TradingView
The bulls are attempting to push the price back into the range on July 26, but they may face stiff resistance from the bears at higher levels. If the price turns down from the 20-day EMA ($7.12), the bears will make another attempt to push the TON/ USDT pair down to $6 and finally to $5.50.
If buyers want to stop the decline, they will have to quickly push the price above the moving Medium . The pair could then rise to $7.72, where the bears will attempt to stall the recovery.
Cardano ( ADA) moved back below the moving Medium on July 25, but lower levels are attracting buyers.
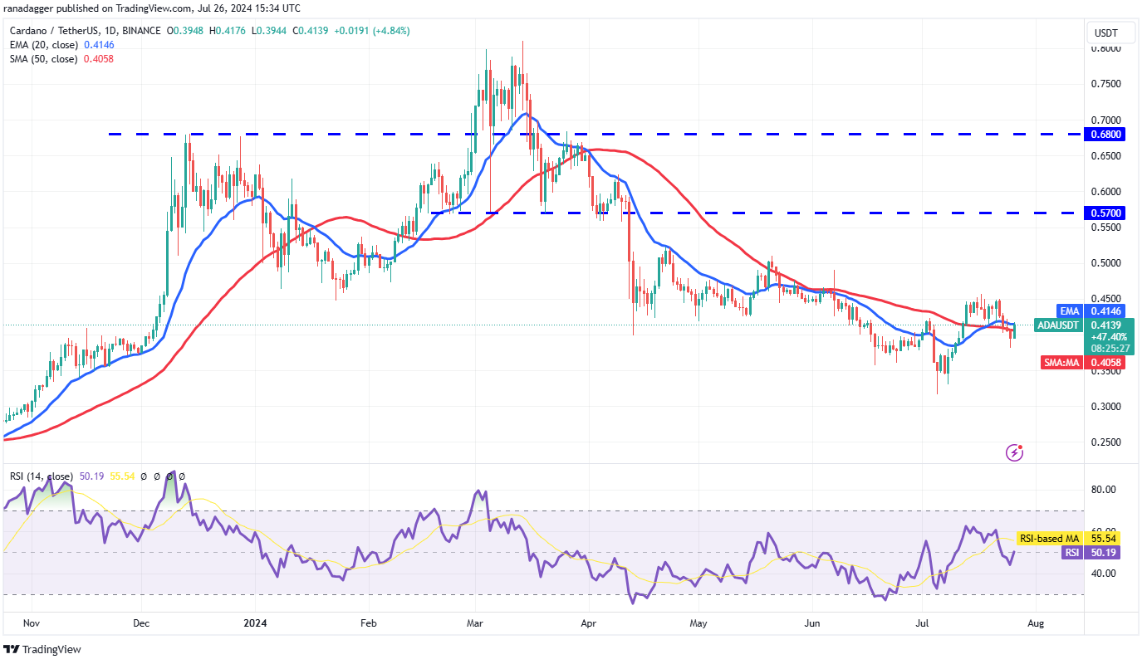
ADA/ USDT Daily Chart | Source: TradingView
If the price rises and stays above the moving Medium , it shows that sentiment is turning positive and traders are buying at low prices. The ADA/ USDT pair could rise to $0.46 and then to $0.52.
Conversely, if the price falls sharply from the moving Medium , it shows that the bears are trying to gain the upper hand. The pair could slide to the strong support at $0.35.
Avalanche (AVAX) broke below the moving Medium on July 25, but the bears are attempting to hold the lower levels.
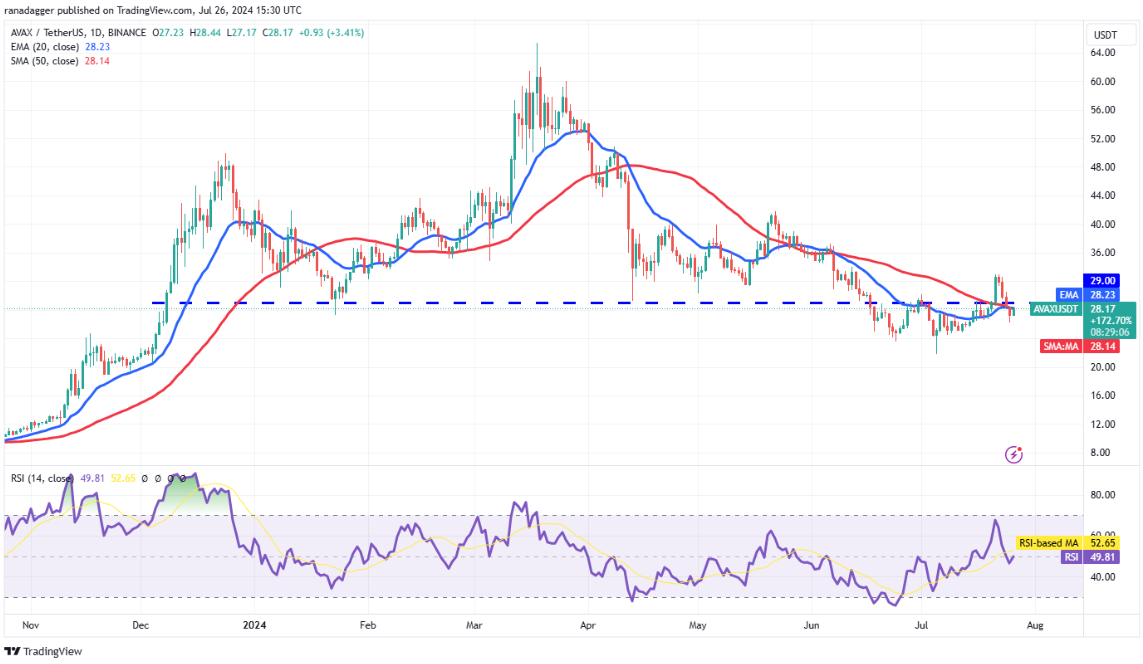
AVAX/ USDT Daily Chart | Source: TradingView
The bulls are attempting to push the price back above the moving Medium and the $29 resistance. If they succeed, it will show that the AVAX/ USDT pair has formed a higher Dip . The pair can then rally to $34 and above it to $37.
Instead, if the price turns down from $29, it shows that the market has rejected higher levels. The bears will then attempt to drag the price to the strong support at $24 and below it to $21.80.
Shiba Inu (SHIB) broke below the 50-day SMA ($0.000017) on July 23, but the bears were unable to sink the price below $0.000015.
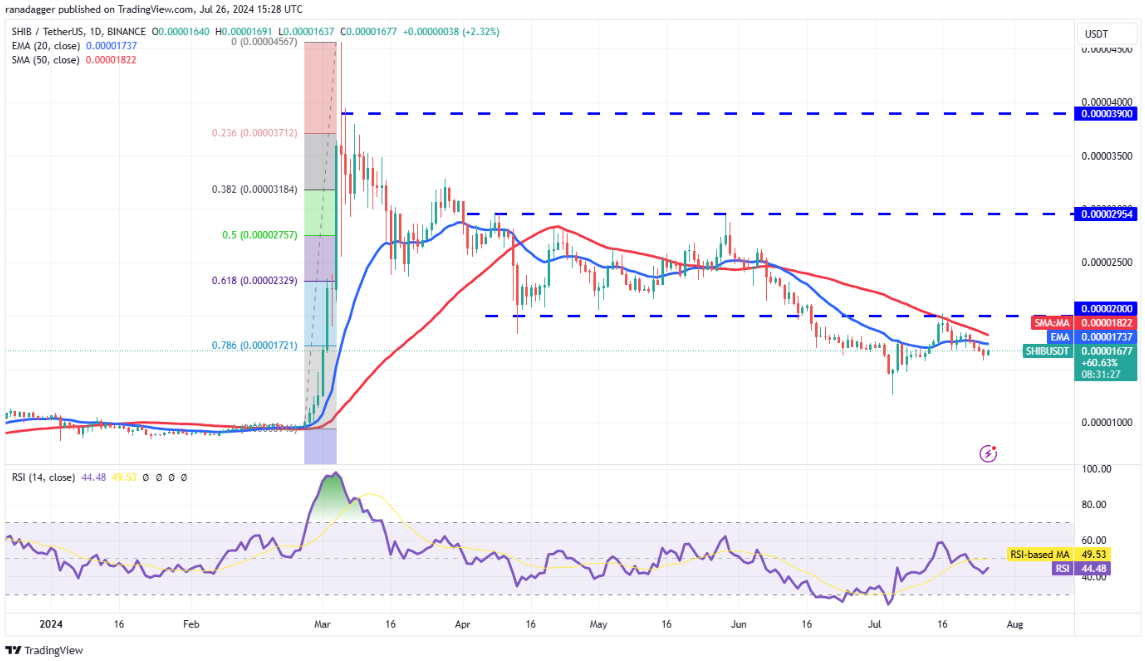
SHIB/ USDT Daily Chart | Source: TradingView
Buyers are trying to push the price back above the moving Medium . If they do that, it would suggest that the SHIB/ USDT pair could consolidate between $0.000015 and $0.000020 within a few days.
Conversely, if the price turns down from the moving Medium , it shows that the bears are still in control. The pair could then break below $0.000015 to retest the $0.000013 support.
You can XEM coin prices here.
Disclaimer: This article is for informational purposes only, not investment advice. Investors should research carefully before making a decision. We are not responsible for your investment decisions.
Join Bitcoin Magazine's Telegram: https://t.me/tapchibitcoinvn
Follow Twitter: https://twitter.com/tapchibtc_io
Follow Tiktok: https://www.tiktok.com/@tapchibitcoin
SN_Nour
According to Cointelegraph


