TradingView is powerful and integrates U.S. stocks, cryptocurrency and global economic data to help fundamental analysts keep up with market sentiment and cross-market dynamics. With the listing of BTC ETF, the encryption market and the US stock market have become increasingly interconnected, and TradingView's cross-market integrated analysis has become a necessary skill.
In the past, Biyan has introduced its technical analysis functions . This article will be oriented on "what is needed for fundamental analysis". Starting from the "Super Chart" of TradingView, we will learn all the functions needed to judge market sentiment during fundamental analysis.
Introduction to Super Chart Basics
Super Chart is known as "one terminal can rule everything", which means that one function can meet all the needs of traders and give everyone a complete analysis experience. Look at Bloomberg for the stock market, and perhaps a large part of cryptocurrency analysis can Rely on TradingView
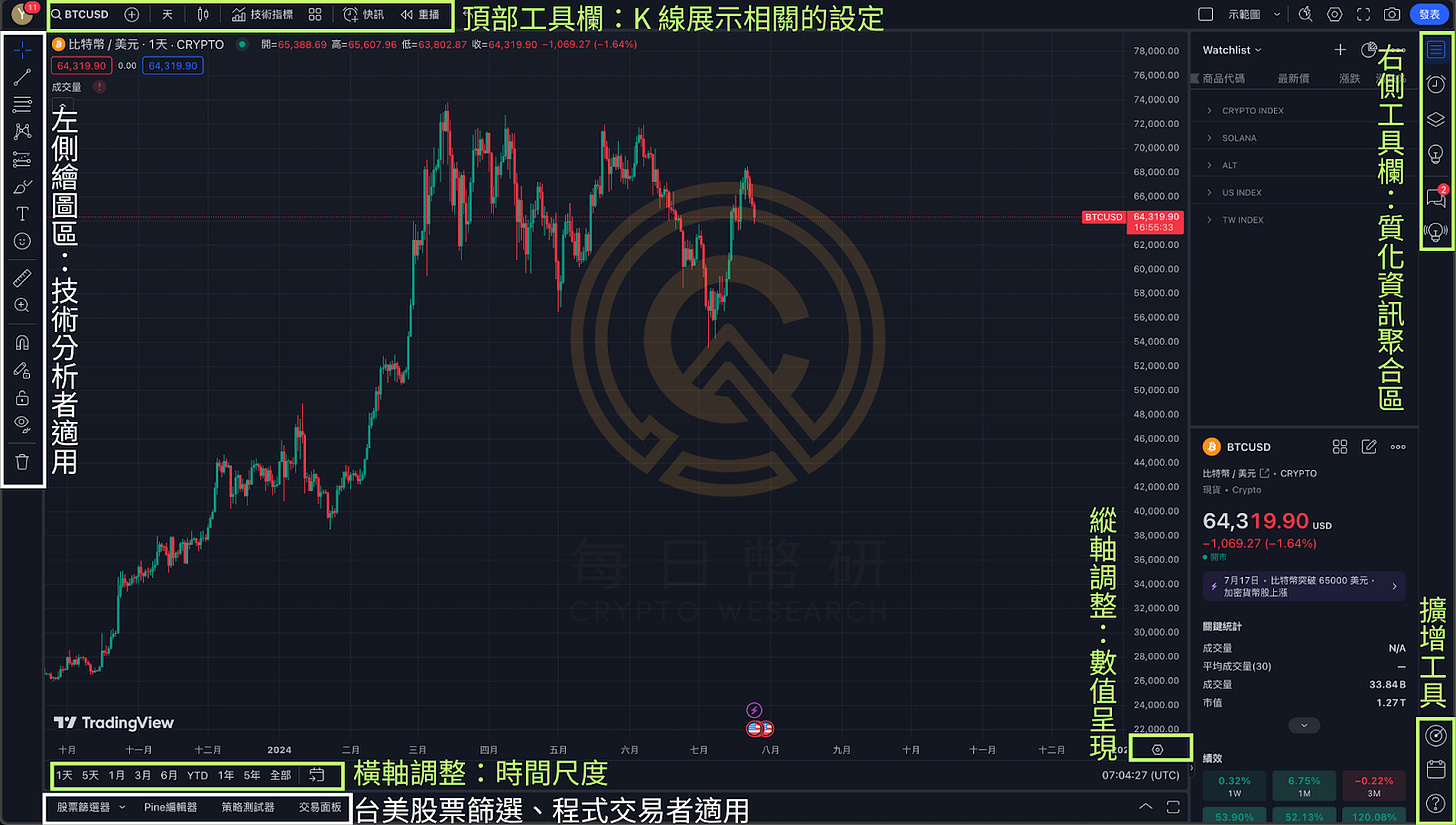
However, when entering the TradingView Super Chart , the buttons in every corner can easily dazzle beginners and they are not sure where to start. In this regard, the author frames the functions of each block in the layout and organizes them as shown in the picture above, and briefly explains them through the table below. Later, the green blocks in the picture will be introduced in detail, guided by fundamental analysis, to help readers learn the required functions. .
Field name
Basic introduction
Application scenarios
top toolbar
K-line display related settings
Customized layout presentation
Horizontal axis adjustment
time scale
Vertical axis adjustment
Numerical presentation unit
Right toolbar
Qualitative information aggregation area
Organize information, take notes,
Accumulated trading experience
amplification tools
1. Stock screening
1. Taiwan and US stock trading, program trading
2. Economic Calendar
2. Release of major macroeconomic data
3. Functional smart query
3. Function query and advanced learning
Left drawing area
A wide range of technical analysis drawing tools
technical analysis
bottom toolbar
Stock screening, trading backtesting
Taiwan and US stock trading, program trading
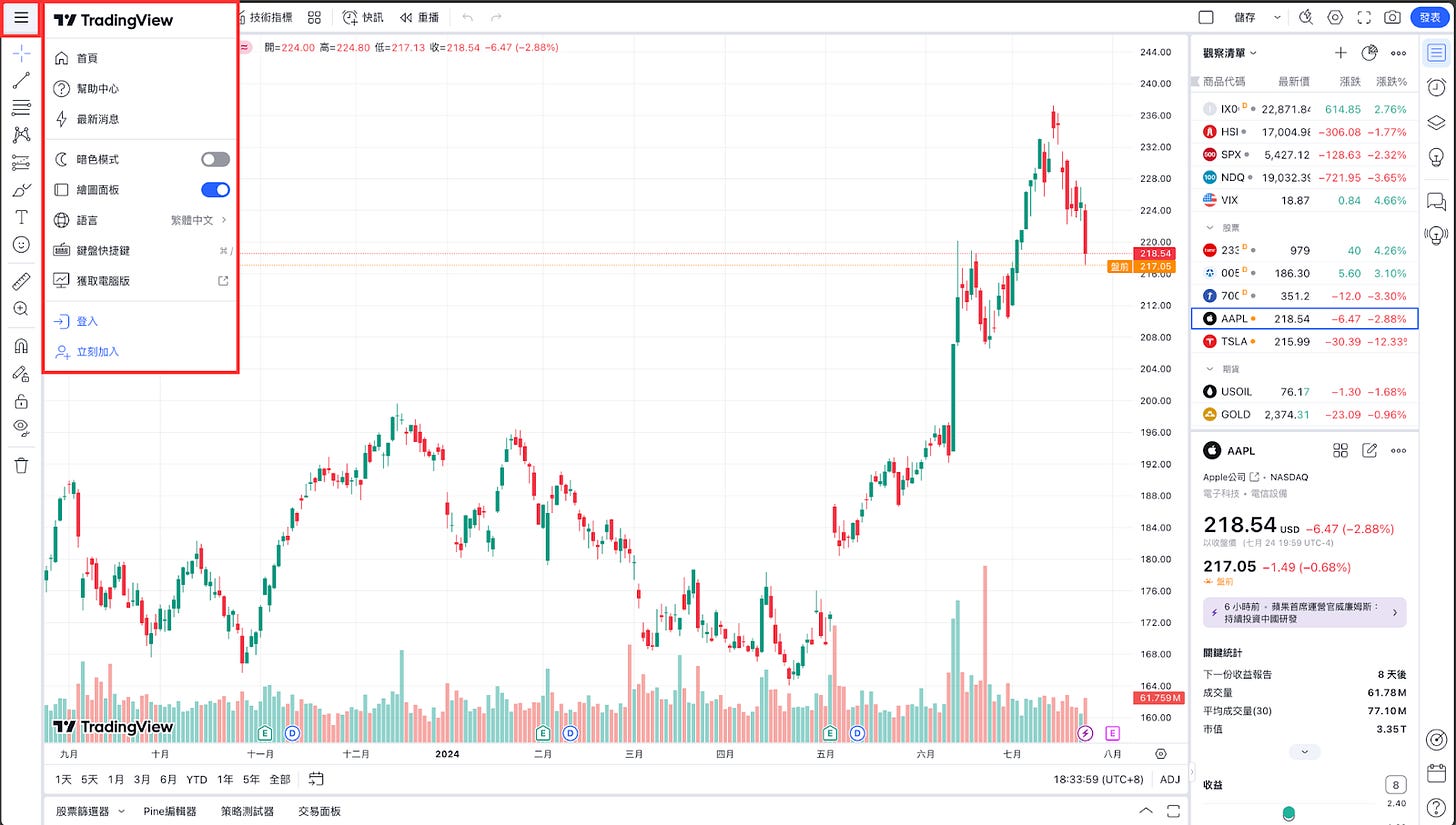
The first thing to do when entering a super chart
Go to the homepage and register as a member for free to ensure that all data pages for subsequent operations can be saved.
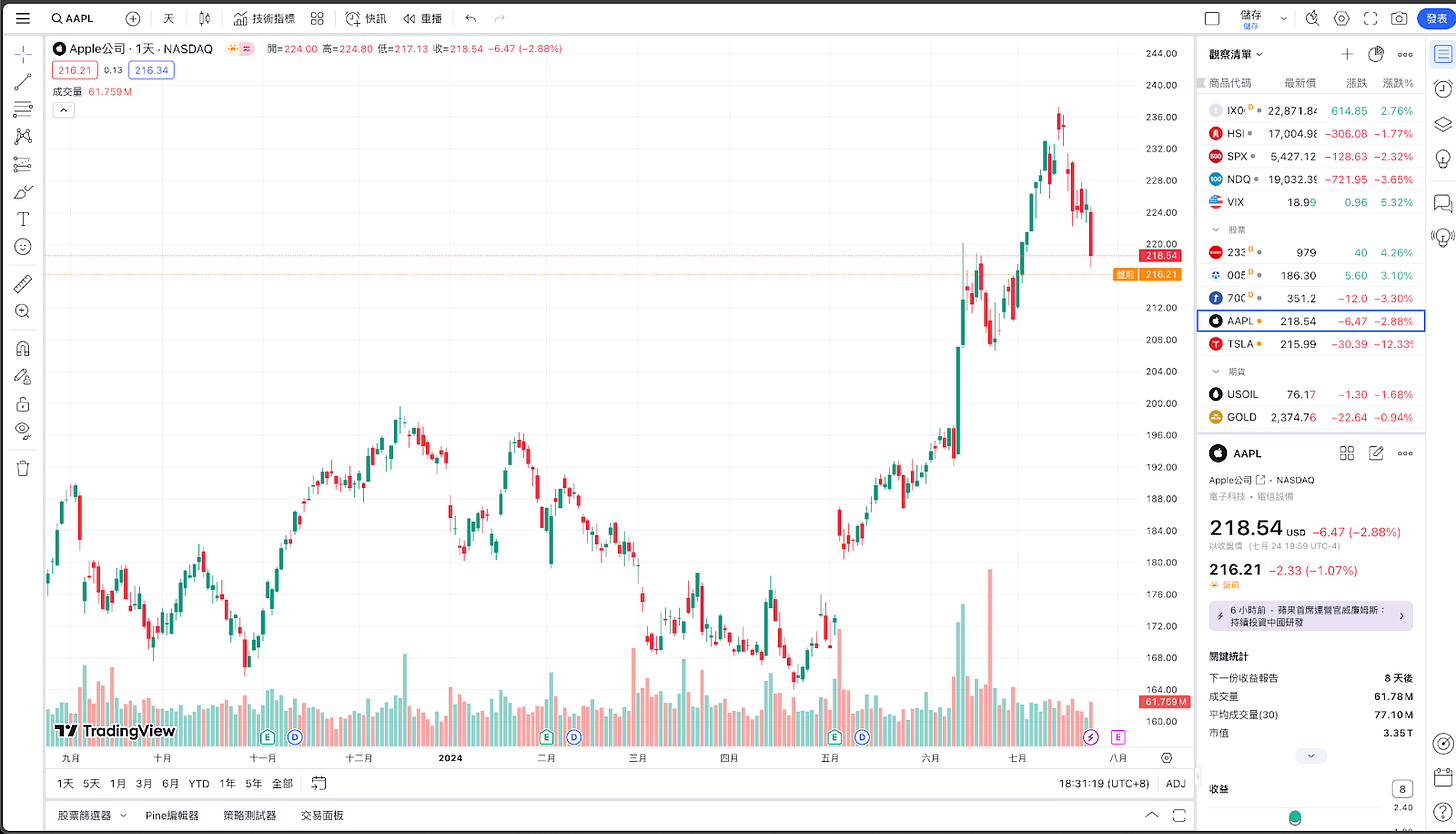
When you first enter [Super Chart], the layout will default to the layout of $AAPL
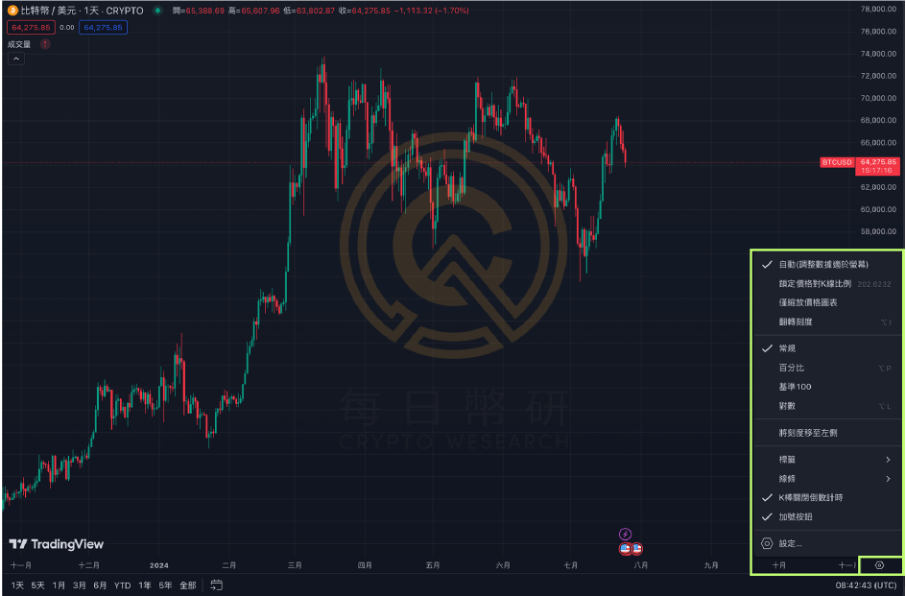
Click on the upper left corner and make a few basic settings first.
I want to visually analyze the correlation between BTC and ETH trends.
***
How long does each point in the line graph span?
Adjust the time scale of each K line
***
Line chart type
The most commonly used ones are "K line" and "line chart"
***
1. Save "Indicator Template"
2. Import "Indicator Template"
Professional analysis should include a comprehensive comparison of multiple indicators and line charts. This button can save the current settings as a template, or import your own set of indicators at once.
**
Customized alerts
Notifications of specific target prices reaching prices, upward breakthroughs, downward breakthroughs, etc.
**
1. Return to the previous setting interface
2. Return to the next setting interface
*
Return to a certain point in time in the past for analysis
Analyze classic events
*
Incorporate technical indicators into comparison charts
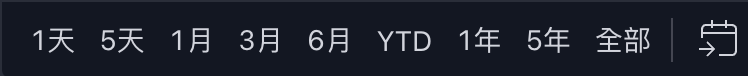
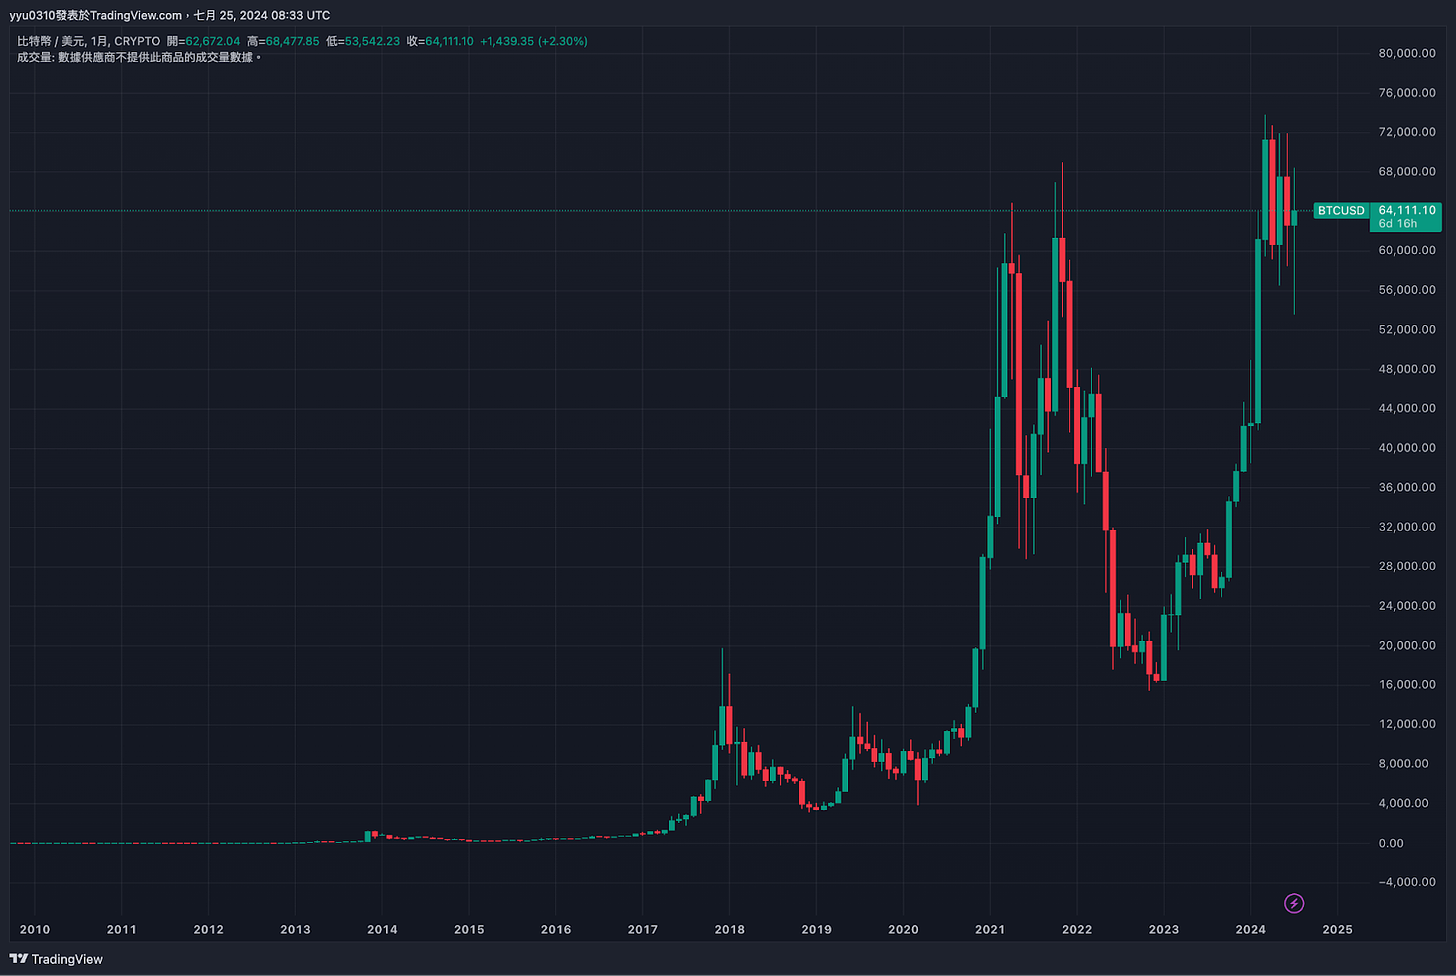
This block can set the time scale that the entire layout covers, as shown in the figure below:
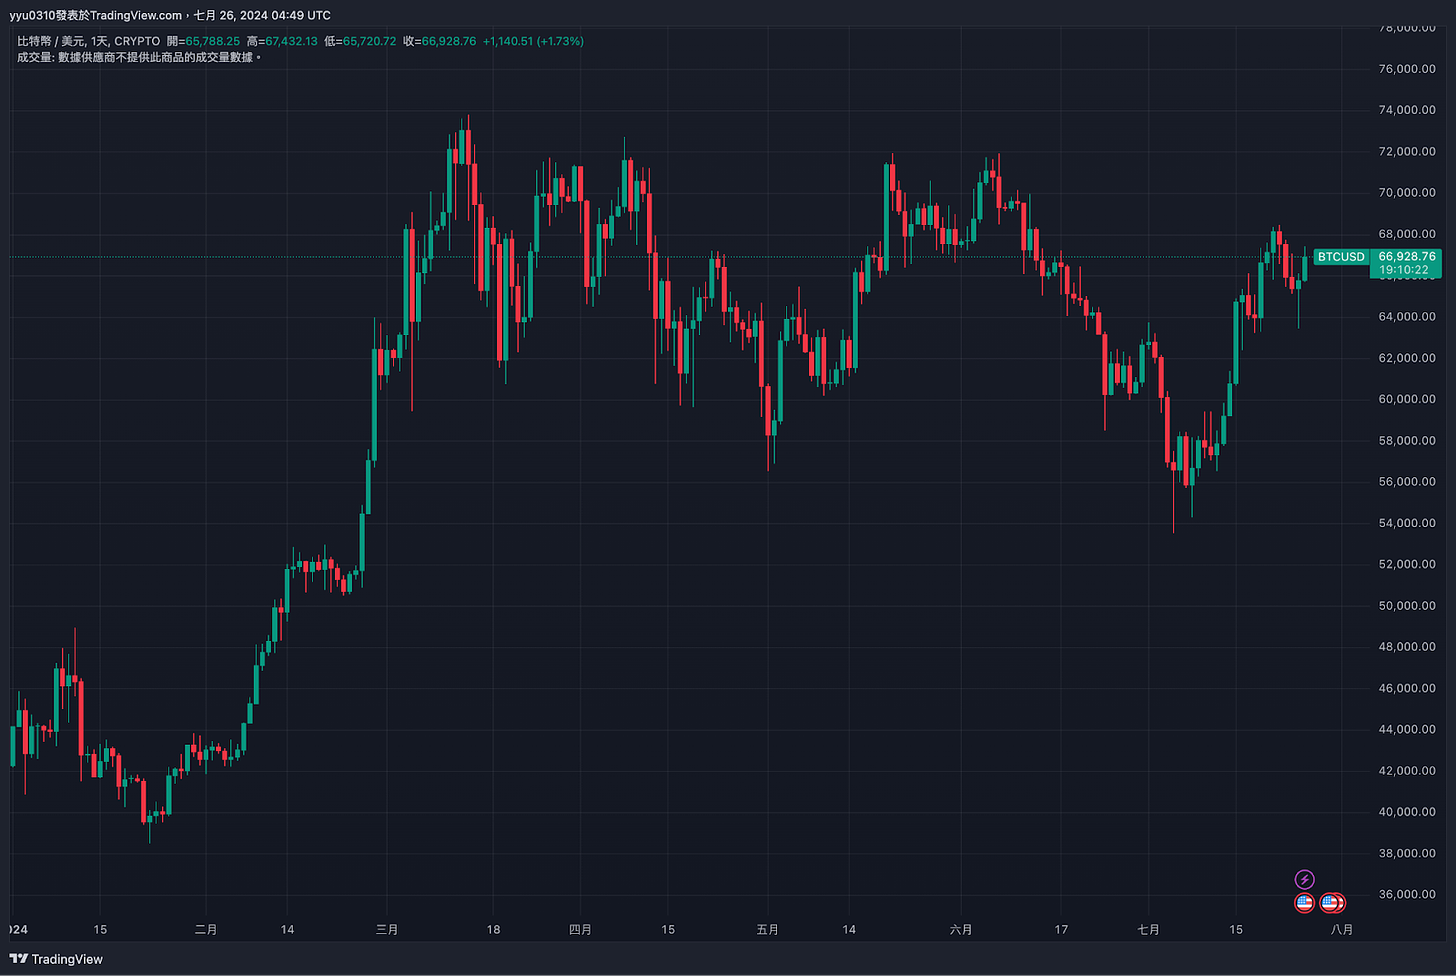
If you want to watch the price trend of BTC since its emergence, you can click
If you want to watch a specific time range, you can press
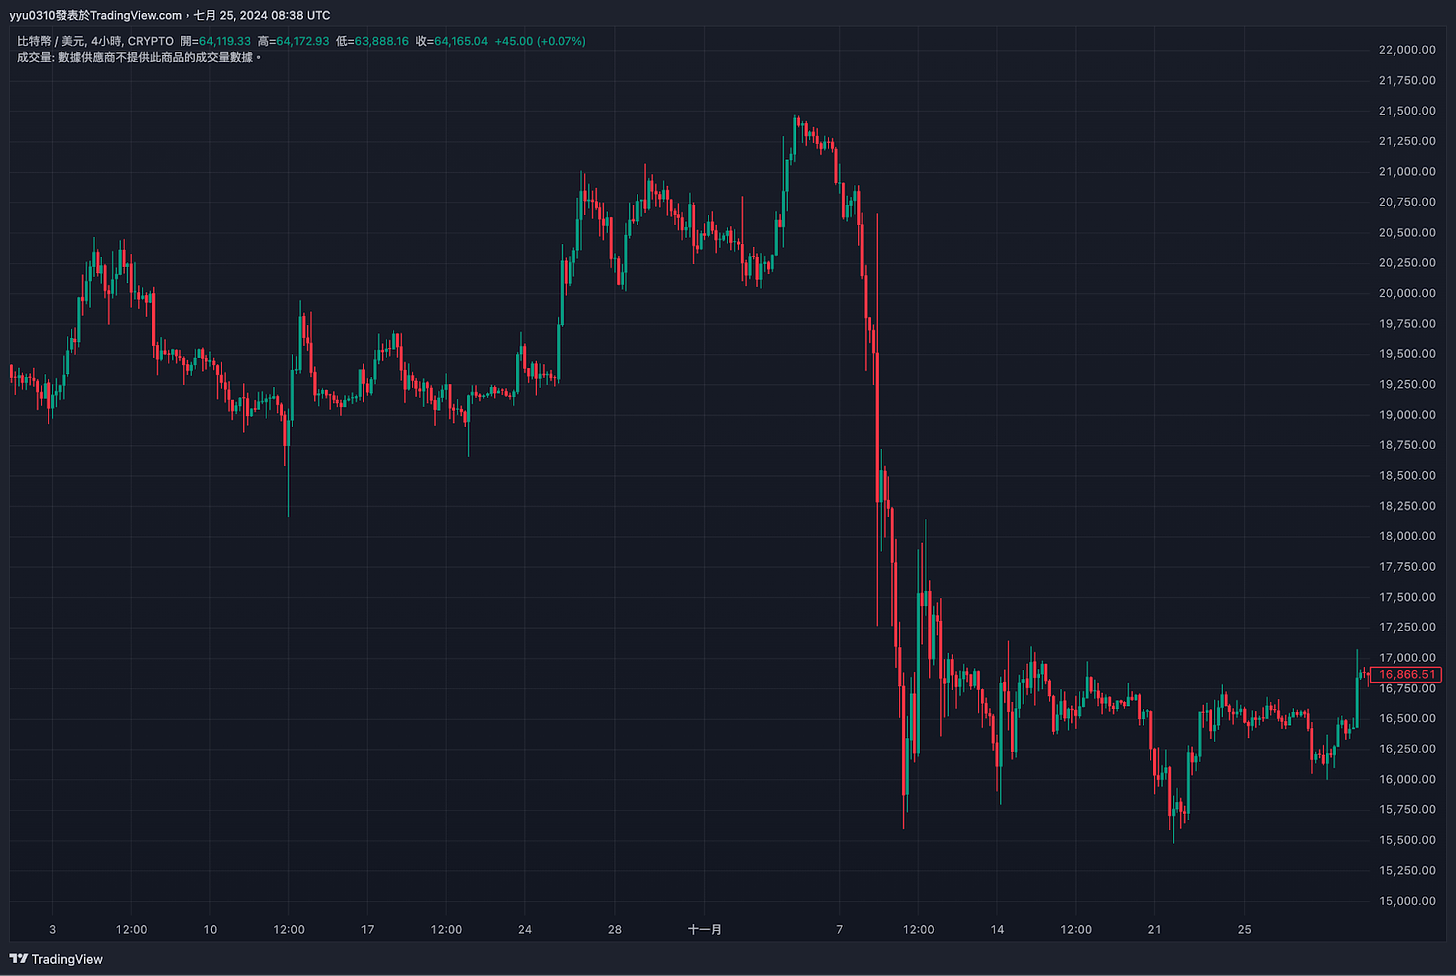
Taking the FTX incident as an example, select the time period from October to November 2022
Vertical axis adjustment: numerical presentation
You can change the presentation method of the vertical axis, which is usually set during overlay analysis. More detailed example teaching will be provided later.
The most common settings in this column are:
name
introduce
application
conventional
A numeric value representing the price
Simply observe the price value
percentage
Take the K bar on the far left of the page as a benchmark and compare the return rate of the K bar on the far right.
Overlay chart analysis of returns on multiple targets
Benchmark 100
Set the numerical value on the far left side of the layout to 100, and compare it with the equal-proportional change of the K bar on the far right side.
Overlay chart analysis of returns on multiple targets
Logarithm
The vertical axis will show the trends of all indicators on the page as much as possible.
When the layout time scale is extremely large, early changes can be seen better
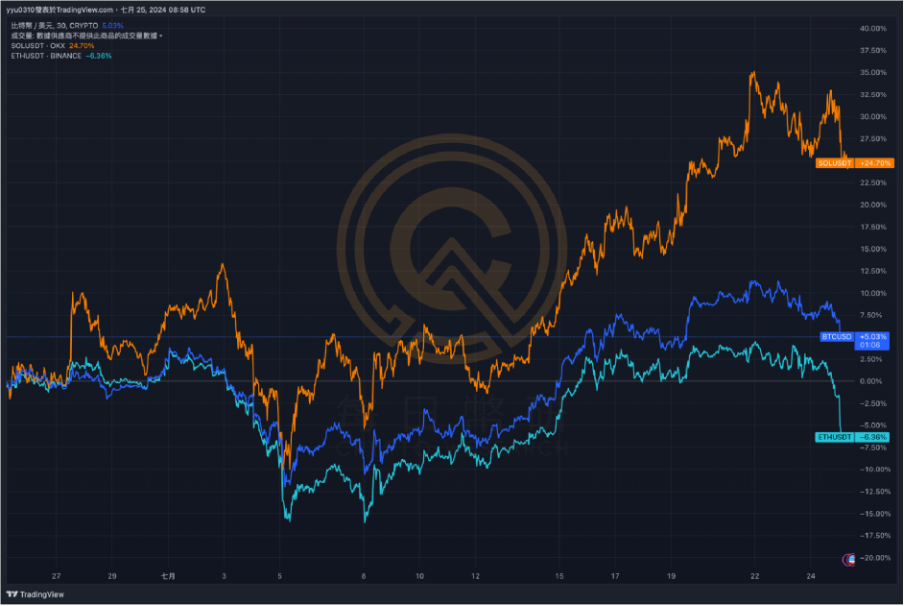
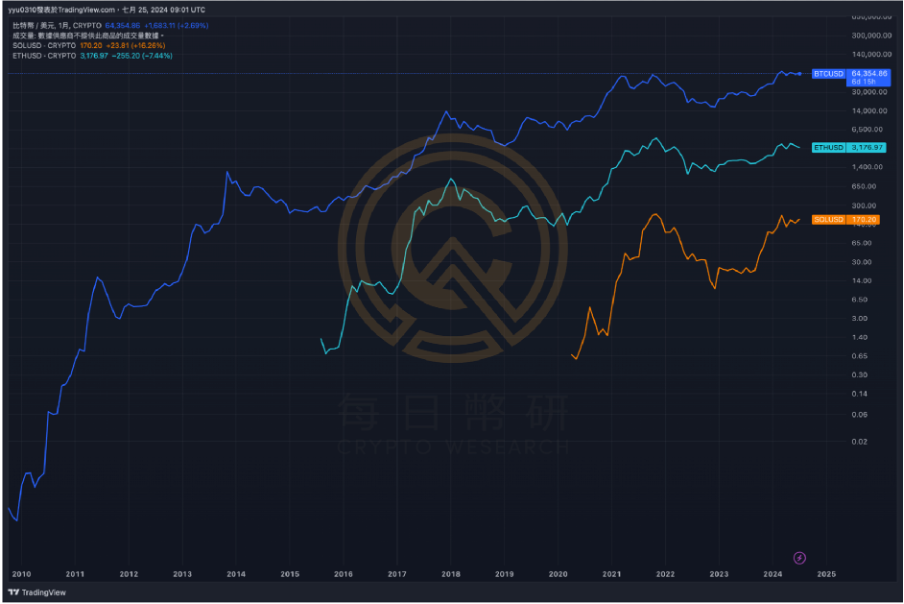
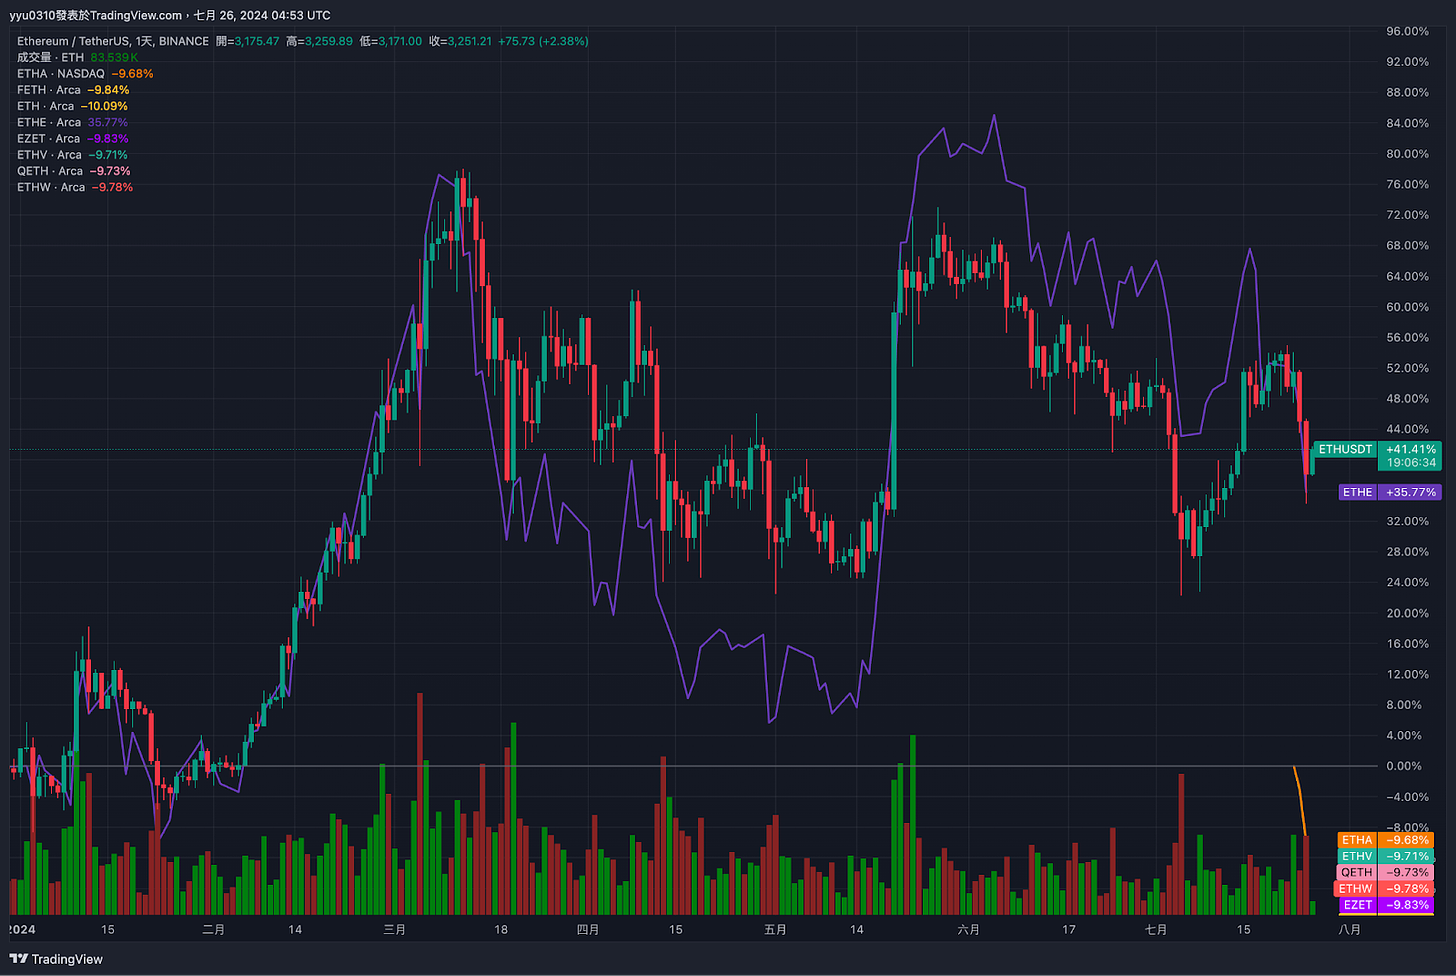
Why do everyone say that ETH is very weak relative to SOL in this cycle? A chart will show you
Percentage Example (June 25, 2024 to July 25, 2024)
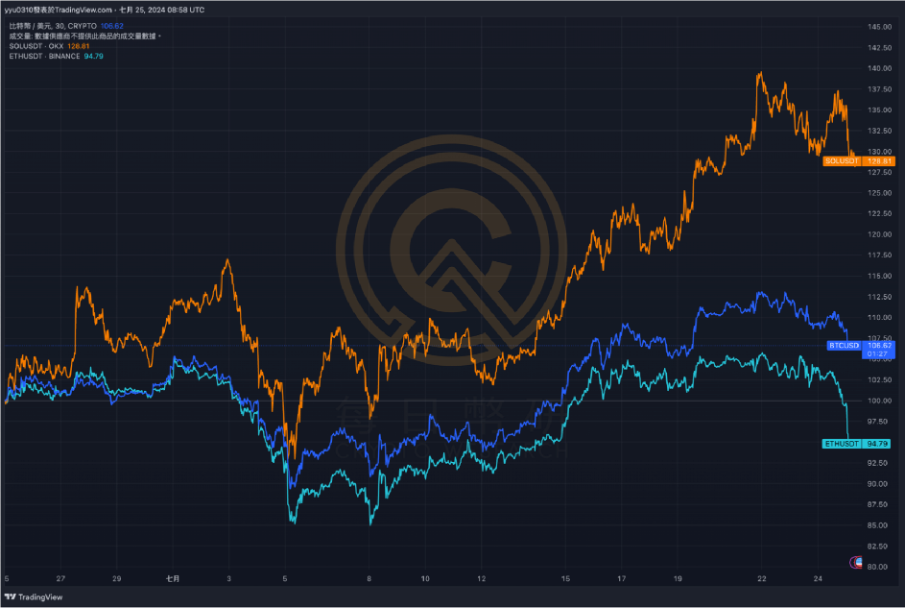
Benchmark 100 Example (June 25, 2024 to July 25, 2024)
Logarithmic Example ( October 1, 2009 to July 25, 2024)
▌Subscribeto the daily Coin Research e-newsletter(one article per week to quickly understand market conditions, on-chain data and potential project developments)
Right toolbar: Qualitative information aggregation area
button
name
Application scenarios
Required level
Watch list
Organize frequently observed indices and targets for quick processing when needed
***
News
Notifications of specific target prices reaching prices, upward breakthroughs, downward breakthroughs, etc.
***
object tree
Get an overview of all objects on the layout
**
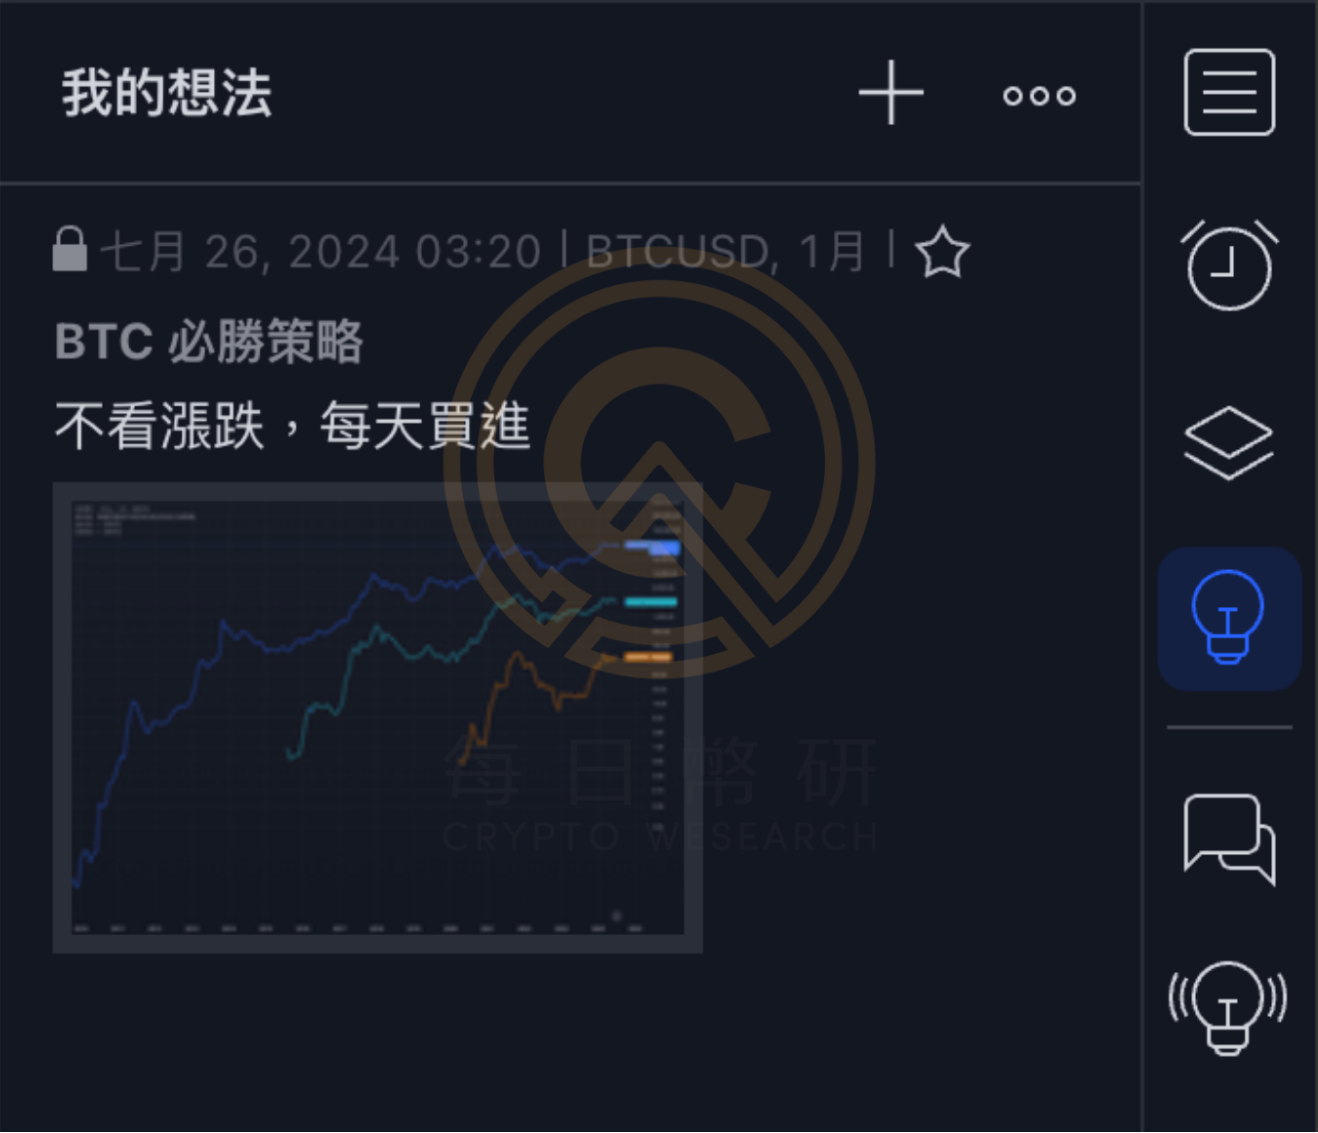
my thoughts
Store trading ideas, experiences, and current charts
**
chat
Paid function, you can chat and discuss with other subscribers
*
idea streaming
Collect and organize the trading views of the TradingView community
*
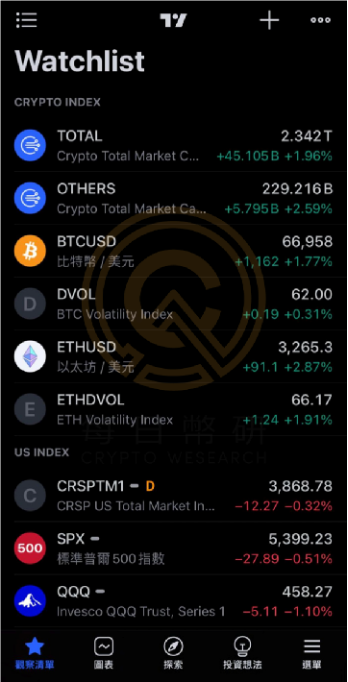
Watch list example
Through this field, you can quickly compare the changes in major indices or prices. The attached table shows the indices that the author often pays attention to.
Crypto Index
TOTAL: represents the total market capitalization of the cryptocurrency market
OTHER: The market value of the crypto market outside the top ten currencies, reflecting the market value of Altcoin.
BTCUSD: Bitcoin price against the US dollar
DVOL: Bitcoin’s implied volatility index, which can be regarded as a leading indicator under special circumstances
ETHUS: Price of Ethereum against the US Dollar
ETHDV: Bitcoin’s implied volatility index, which can be regarded as a leading indicator under special circumstances
US Index With the listing of BTC and ETH ETFs on the U.S. stock market, traditional finance will have an increasingly strong impact on the prices of the two major currencies, making them more susceptible to the impact of the U.S. stock market. The above chart also includes U.S. stock indexes that the author believes are worthy of attention:
CRSPTM1: University of Chicago Center for Equity Research U.S. Total Market Index
SPX: S&P 500 Index, market capitalization index of the top 500 largest companies
QQQ: Nasdaq 100 Index ETF, which can be regarded as an index of the top 100 technology companies
US2000: Russell 2000 Index, small-cap index
W4500: Small and mid-cap index
VIX: U.S. stock implied volatility index, which can be regarded as a market panic index
Newsletter example
Through this function, you can customize alert notifications. You can send out immediate reminders when prices arrive. You can avoid unnecessary notifications at ordinary times. You can respond promptly after receiving alerts at critical moments. After the alert is created, it will appear in the right column.
My idea, just as an example
You can store your thoughts and opinions on daily trading. This field will automatically save the current layout layout, note title, and detailed content of the note, which can help traders quickly return to the situation at that time and review quickly.
amplification tools
button
name
Application scenarios
Required level
stock screen
Screen stocks
economic calendar
Integrate the release date, time and importance of all economic data
***
Help Center
The TradingView reference book on the trading road is worthy of being used as material for advanced learning.
*
Economic Calendar Example
The economic calendar is located in the lower right corner of the page, and will be preset to display the corresponding time points on the horizontal axis to help analysts observe trends before and after the data is released.
Time scale: You can select the weeks for calendar presentation
Country selection: TradingView supports dozens of countries around the world. The author usually only observes data from the United States, the European Union, and China.
Economic data categories: You can choose categories such as labor market, consumer market, bonds, and GDP.
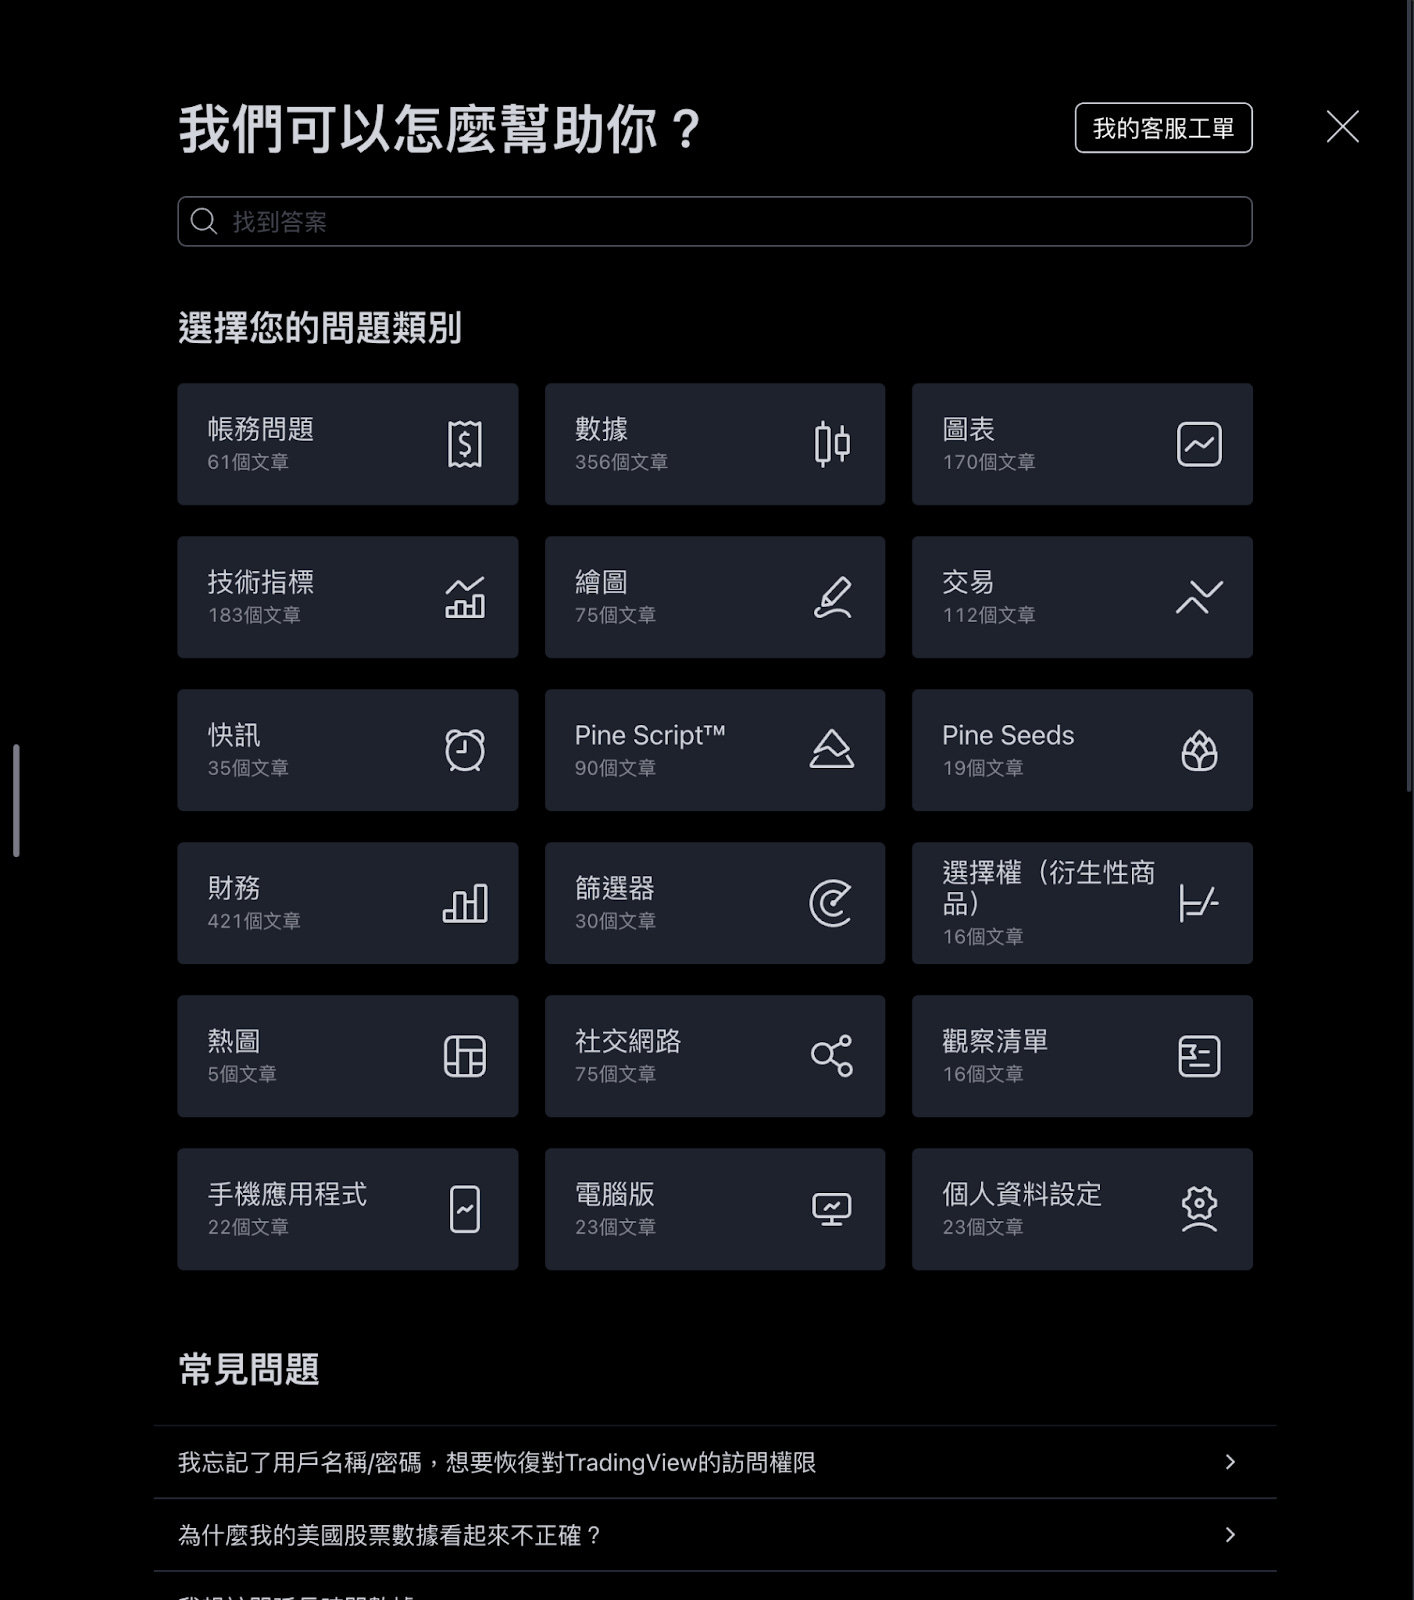
Help Center Example
Almost any doubts about the operation of the TradingView tool can be answered here. If you still have no answer after racking your brains, you can also ask customer service to get the answer (paid function).
Practical application of super charts: How to concisely compare the trends of multiple indicators?
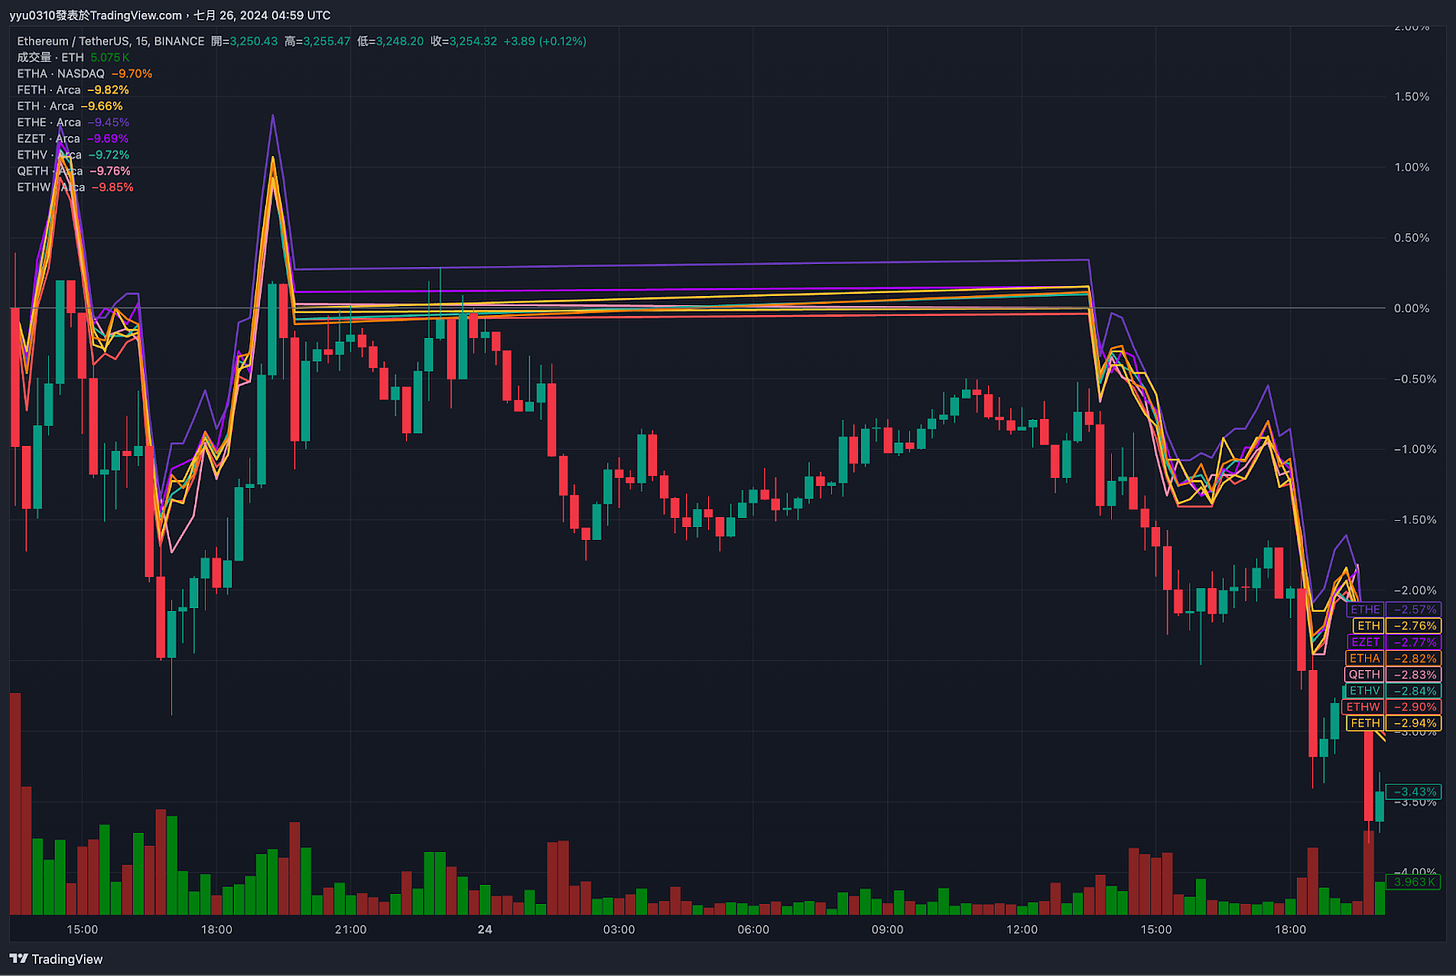
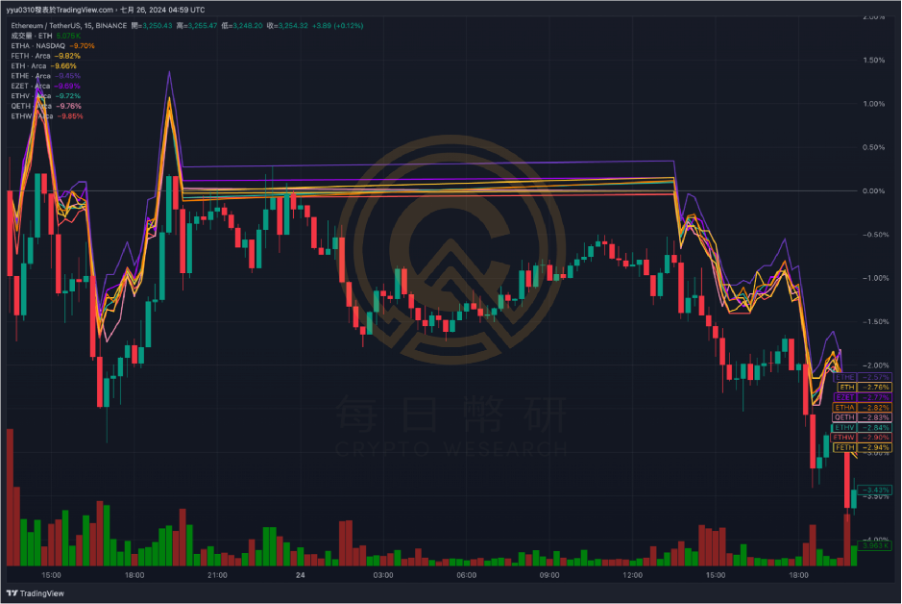
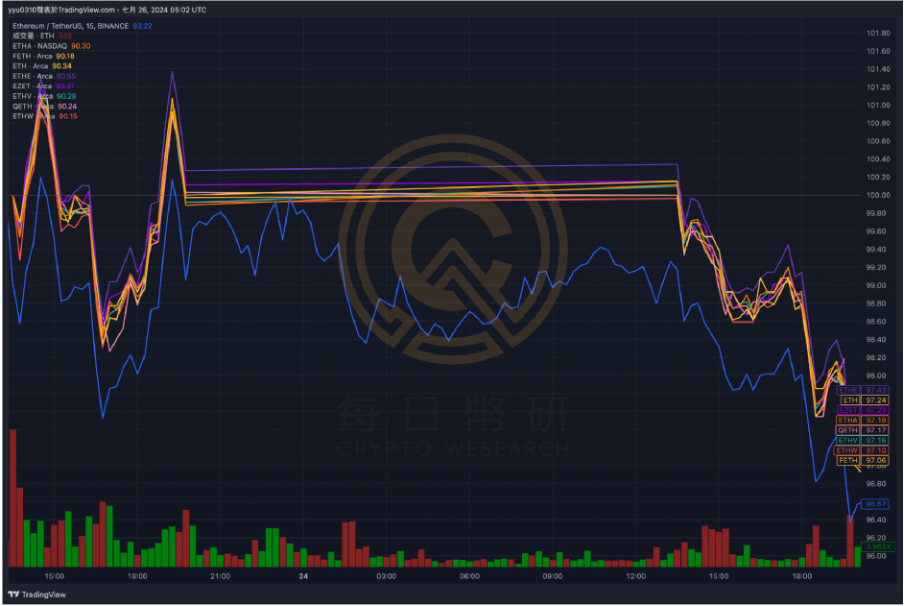
Scenario: Overlay chart analysis of multiple ETH ETFs and the opening 2-day trend of ETH
Initial screen
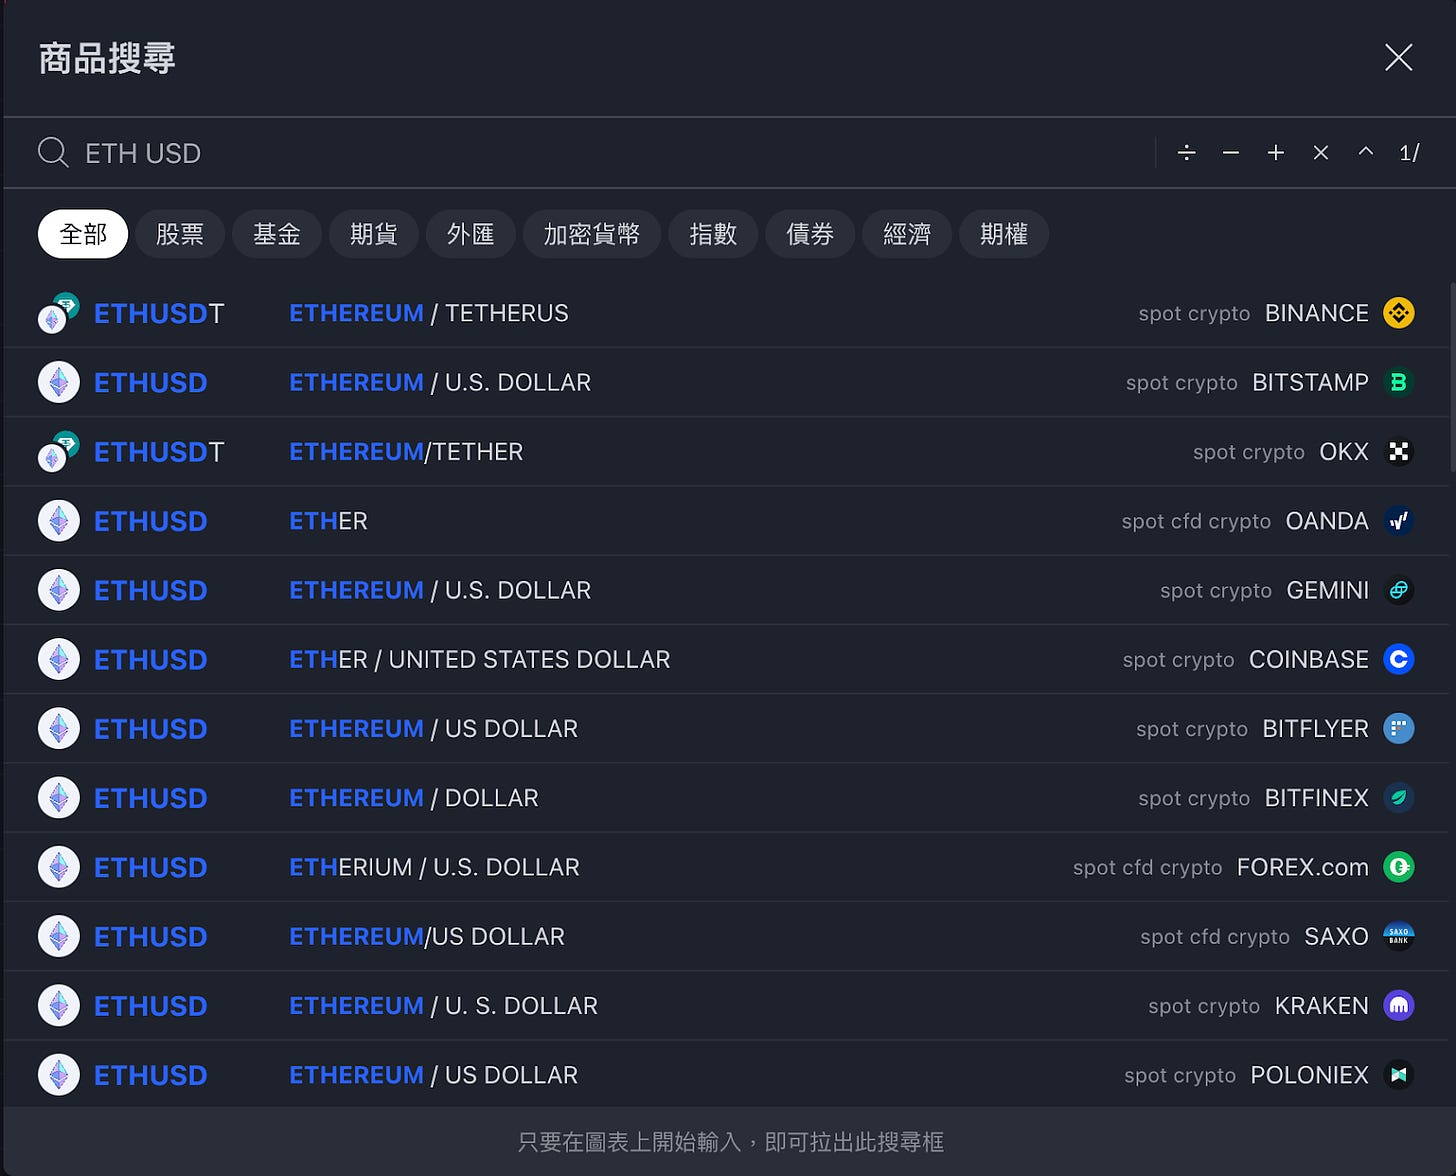
Press from the upper left corner
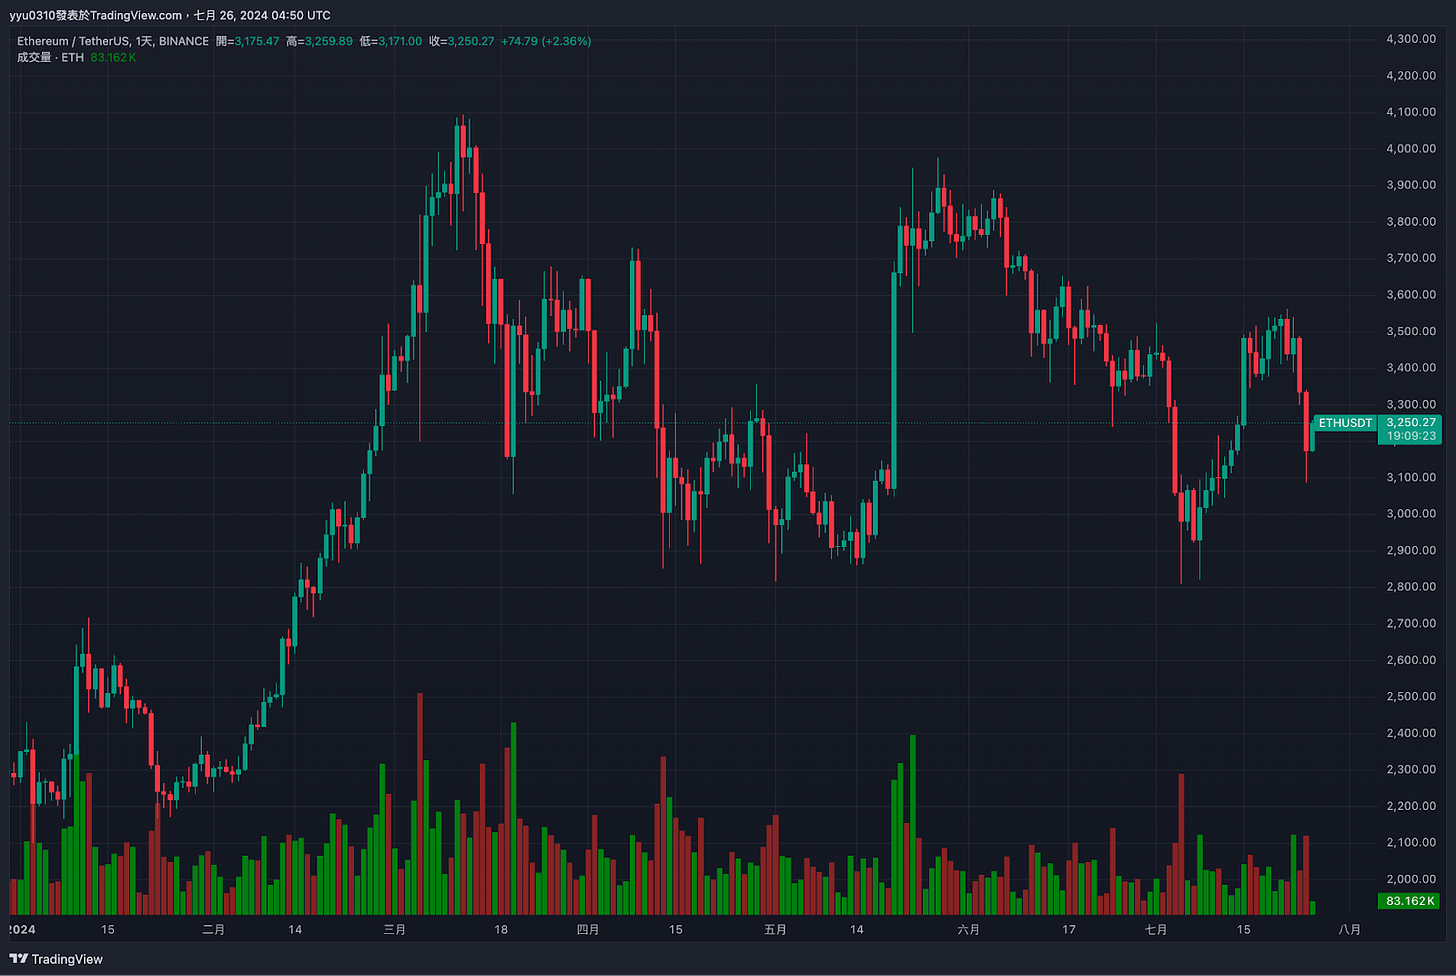
, select the main target "ETHUSD" (It is recommended to choose the data source with the largest trading volume. This demonstration uses Binance as an example)
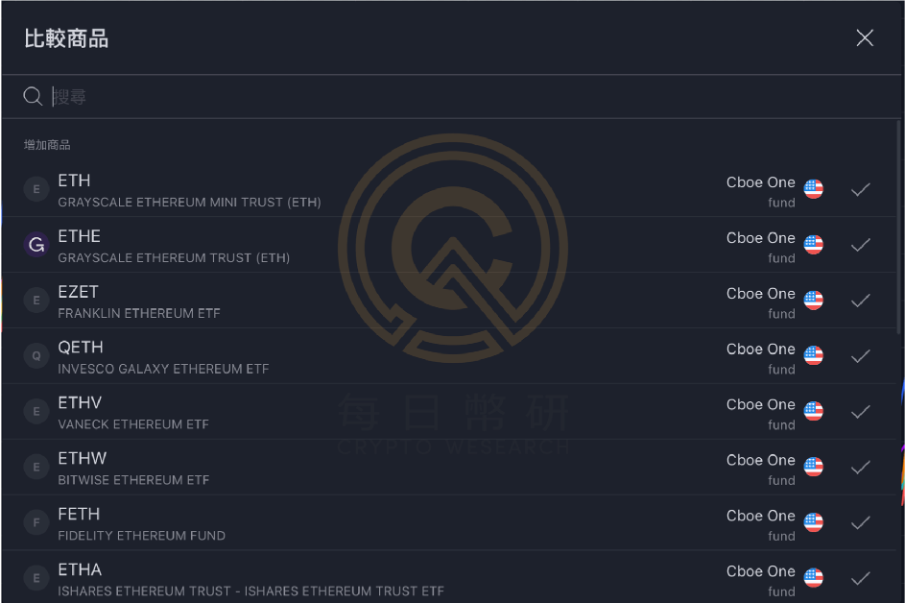
press , add the comparison targets ETHA, FETH, ETHW, ETHV, QETH, EZET, ETHE, ETH (Grayscale Mini Ethereum ETF)
After all are added, the layout will appear as shown below:
press
, adjust the time scale of a single K-line, taking the adjustment to "15 minutes" as an example
press below
Adjust the time scale to the opening day (the demonstration uses UTC 0 time zone as an example)
press
, adjust the line chart form (not necessary)
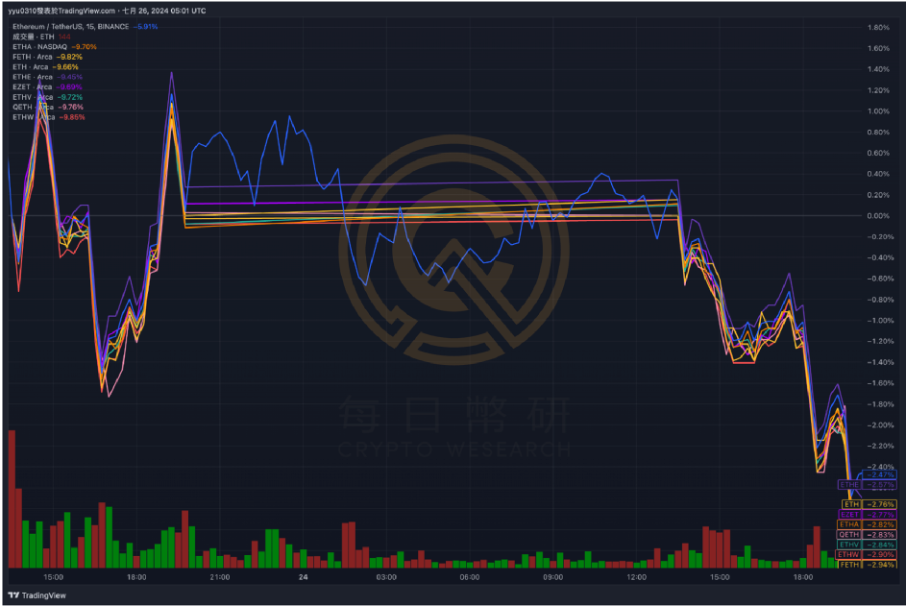
Adjust the vertical axis, taking "base 100" as an example (not necessary)
Finish! Congratulations on learning the basic operations of super charts
Analysis results: The trends observed with the naked eye are extremely overlapping, and the daily return rate of the closing price is within the error range. Interested readers can also use the backtest function (paid function) to verify the correlation between the nine targets and whether there is an opportunity for machine arbitrage.
Beyond the super chart, what other must-know features of TradingView are there?
Returning to the TradingView homepage , you can find that the official has developed multiple applications based on powerful databases and designed them so that general analysts can actually understand them.
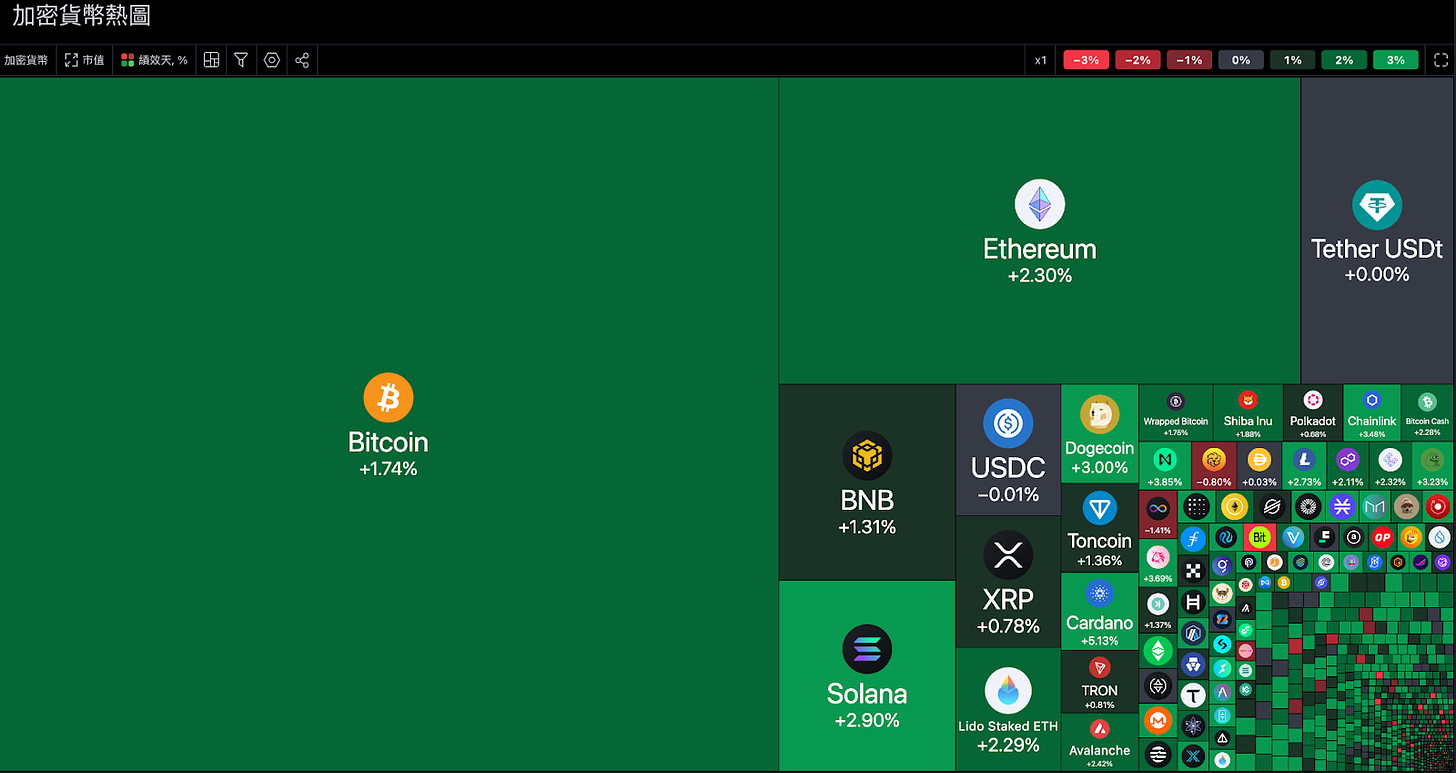
TradingView’s cryptocurrency screener is one of the most useful in my opinion. The most competitive one lies in the diverse types of sectors and the rich statistics of currencies. It can analyze technical aspects, chip aspects, fundamentals, and sectors at the same time. There are very few free data websites. to this extent.
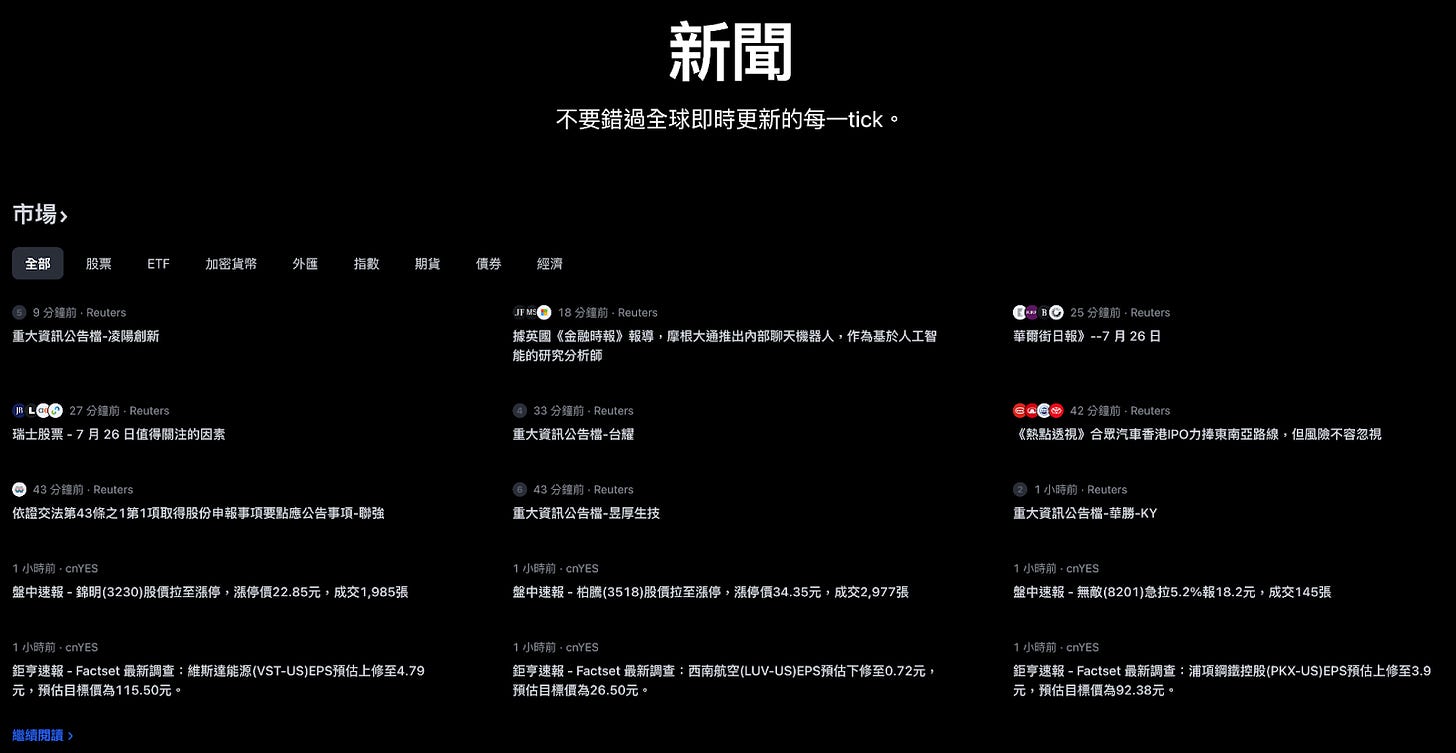
This section integrates real-time news from major markets, allowing you to quickly understand the information of each sector:
The cryptocurrency sector is still dominated by news on price changes. It is recommended that you refer to other websites with substantial information.
You can comprehensively refer to news from the "Economy" and "Index" sectors.
Enter the economic calendar from the home page to see the economic calendar covering the entire page and observe more detailed information.
TradingView has always provided what I consider to be the top economic calendar among free resources. There are few websites with the same quality without paying.
Importance: Most of the investment market only pays attention to economic data with importance level 3
Country selection: Mainly observe the United States, supplemented by data from the European Union and China
Observe the difference between "actual value", "expected value" and "previous value". When the actual value is too different from the expected value, it will easily cause price fluctuations.
Click on the data to see a more detailed introduction, allowing you to gain an in-depth understanding and interpretation of trends.
Mobile version of TradingView
The functions of the mobile version are relatively poor. The author believes that the advantages of the mobile version mainly include two points:
Follow the index or price changes of the "Watch List" in real time
Combine "Mobile Notification" and "TradingView Alert Function" to receive notifications faster
This article comprehensively scans all TradingView free functions. I hope that every reader can gradually accumulate analytical skills through implementation after reading this article. Different from general data websites, the functions of TradingView are very diverse and complex. It is recommended to add this article to "Bookmarks" or "My Favorites" so that you can read it frequently. After you are fully familiar with the basic functions, you can enter the "Shortcut Key List" or "Help Center" to learn more advanced and quick operations. ▌Research and discuss with the Biyan community. Welcome to jointhe daily Biyan Chinese exchange group!
▌Subscribeto the daily Coin Research e-newsletter(one article per week to quickly understand market conditions, on-chain data and potential project developments)
Disclaimer: The content above is only the author's opinion which does not represent any position of Followin, and is not intended as, and shall not be understood or construed as, investment advice from Followin.