

The price of Sandbox (SAND) rose to $0.27 early today. However, it could face another price drop as 98% of current holders are seeing losses.
Year-to-date (YTD) the price of Sand is down 56.22%. If this downtrend continues, the cryptocurrency could approach the lowest prices seen in the 2022 bear market.
Sandbox continues to face difficult times.
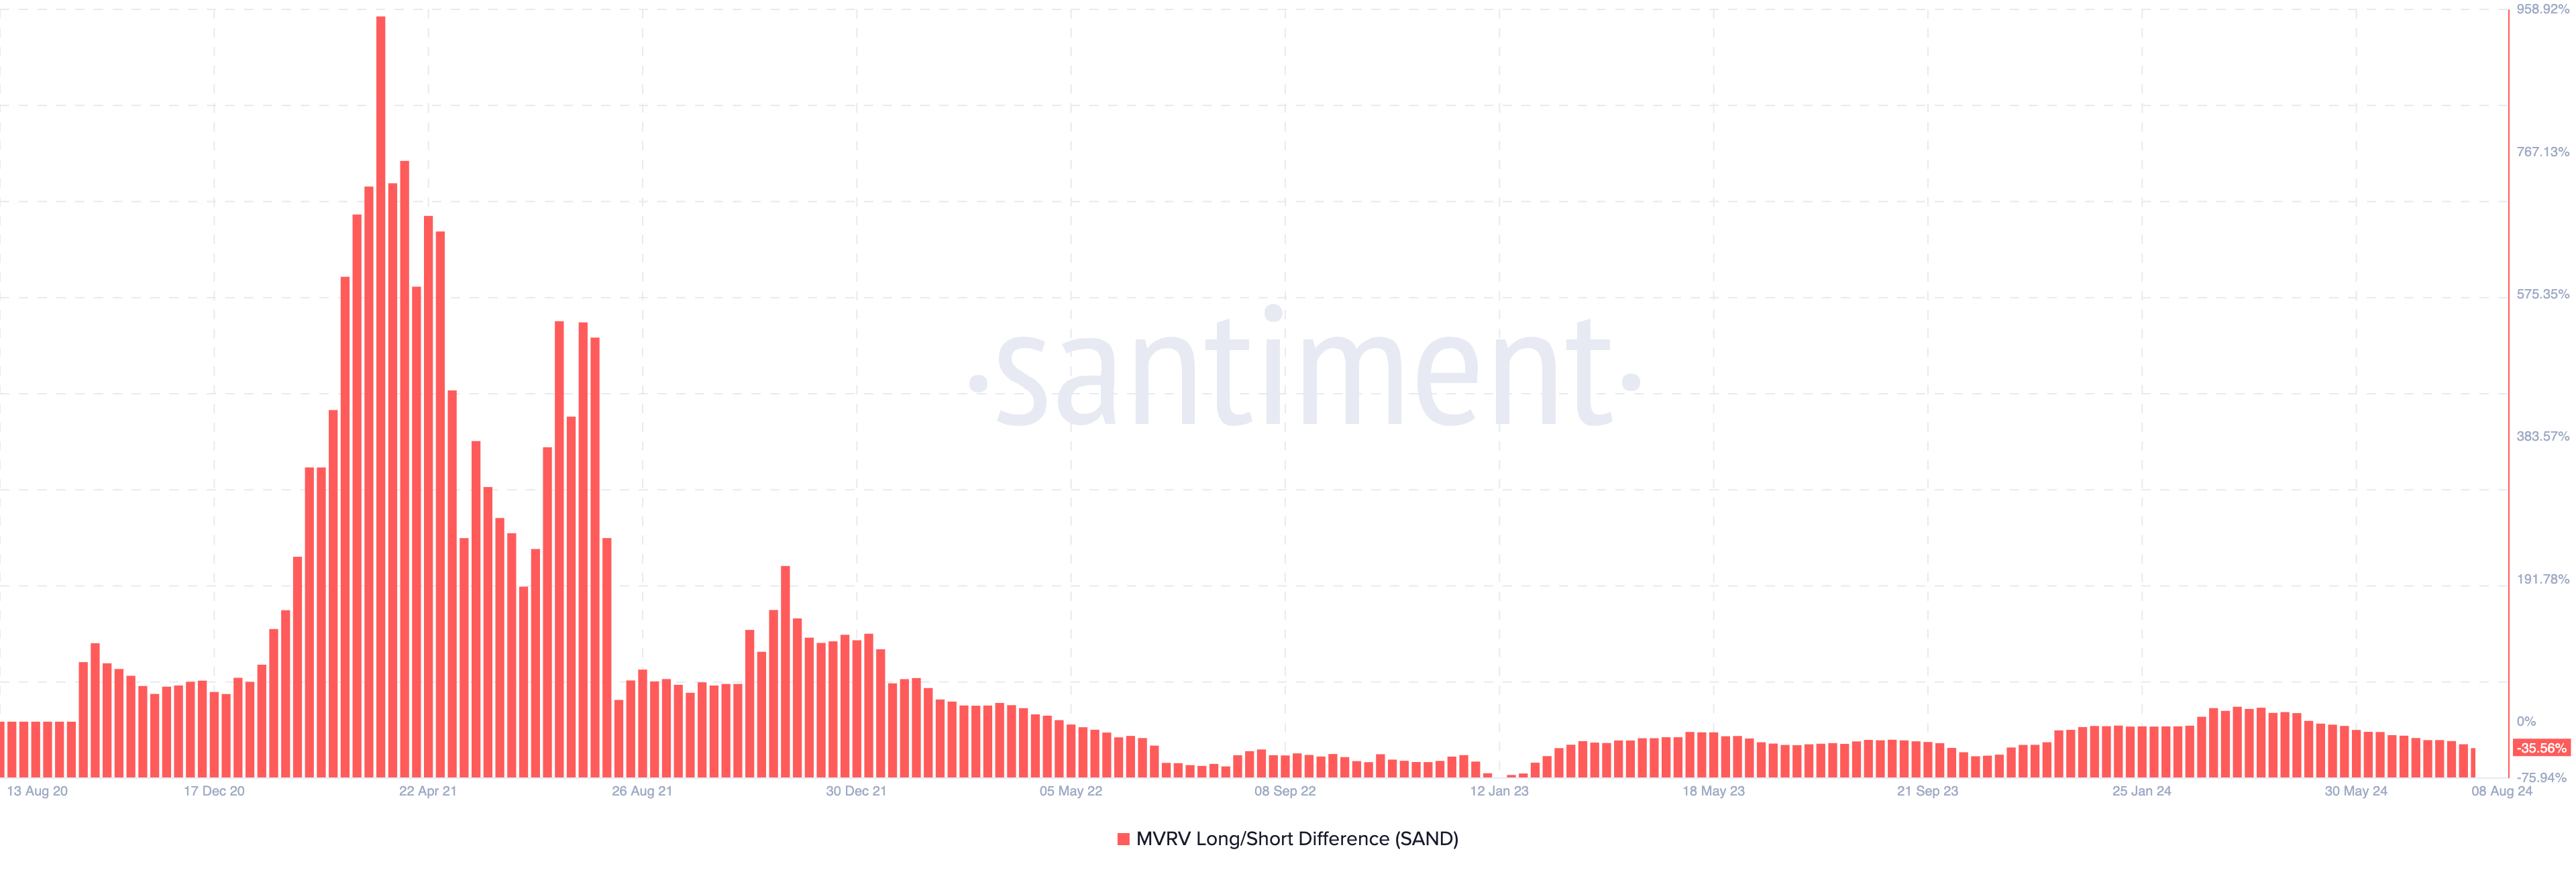
The price of Sandbox has risen by about 6% over the past 7 days. However, according to on-chain data, the short-term/long-term difference between the market value and the realized value (MVRV) is -35.56%. This indicator, which tracks market profitability, is essential for identifying bearish and bullish phases.
A negative value indicates that a short-term holder would realize more profit than a long-term holder if he were to sell at the current price. Conversely, a positive value indicates that a long-term holder would realize more profit if he were to sell.
Considering the above, the MVRV long/short difference can capture the point at which a cryptocurrency is at the top of a bull market and heading towards a bear market . Historically, Sand enters a bearish cycle when this indicator is between -40.74% and -75.26%.
Read more: What is SAND?
This conclusion is based on the movement of the indicator during the 2022 bull market, which ultimately led to the cryptocurrency price crash. If the SAND price fails to increase significantly, profitability will decrease, potentially leading to a bearish phase for the token.
Another indicator that supports this view is the Bulls and Bears indicator, which tracks whether the top 1% of traders are buying or selling.
The bulls are the ones who buy 1% of the volume, and the bears are the ones who sell the same volume. If the bulls increase in number compared to the bears, it is a positive signal that can put upward pressure on the price .
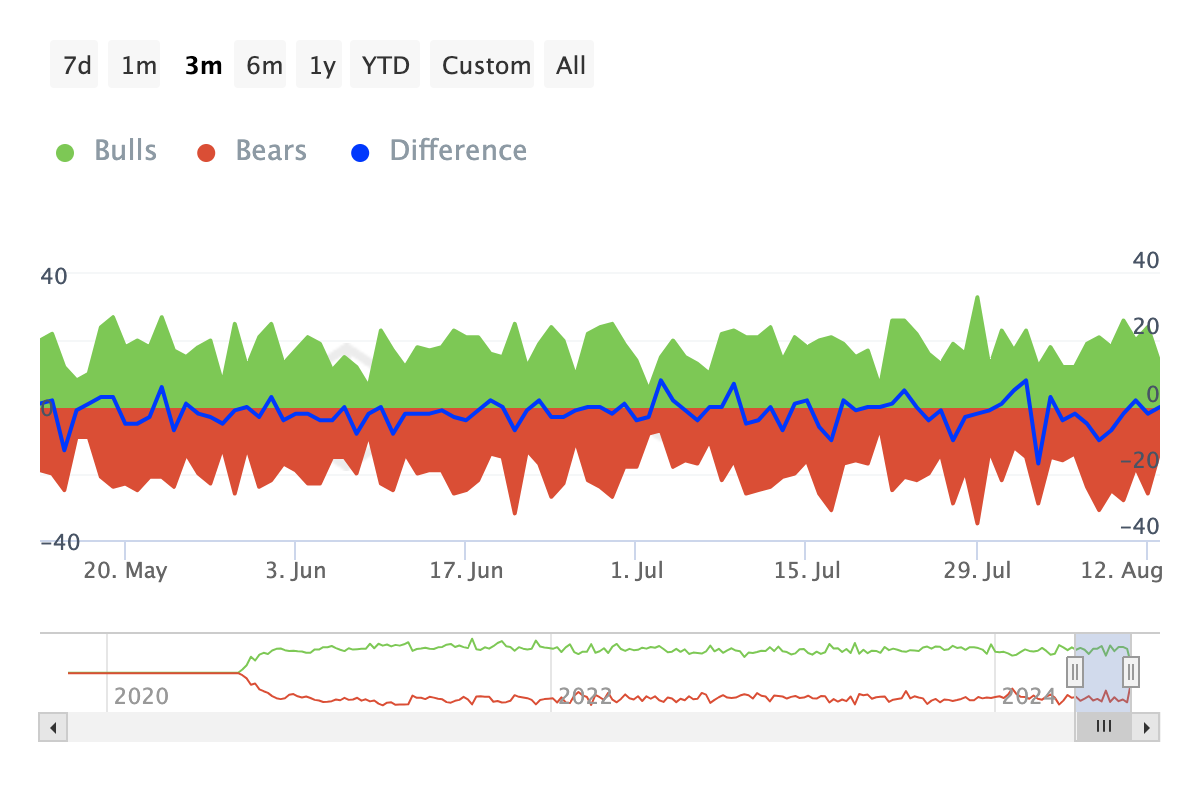
Over the past 7 days, SAND has had 28 more downtrends than uptrends, indicating that the majority of traders are not confident in the token’s prospects.
SAND Price Forecast: Relief Brings Bigger Problems
The technical analysis displayed on the daily chart of Sand also coincides with the on-chain indications. For example, the Balance of Power (BoP) has fallen to -0.64. This price-based indicator evaluates the overall strength of buyers and sellers in the market.
When the Balance of Power (BoP) oscillates above the zero line, it indicates that buyers are stronger than sellers. However, since it is currently below the zero line, it means that the cryptocurrency is in a bear market.
The recent uptrend could be short-lived if sellers maintain control. Meanwhile, Fibonacci retracements provide insight into potential price points the token could reach.
Read more: Sandbox (SAND) Price Forecast 2024/2025/2030
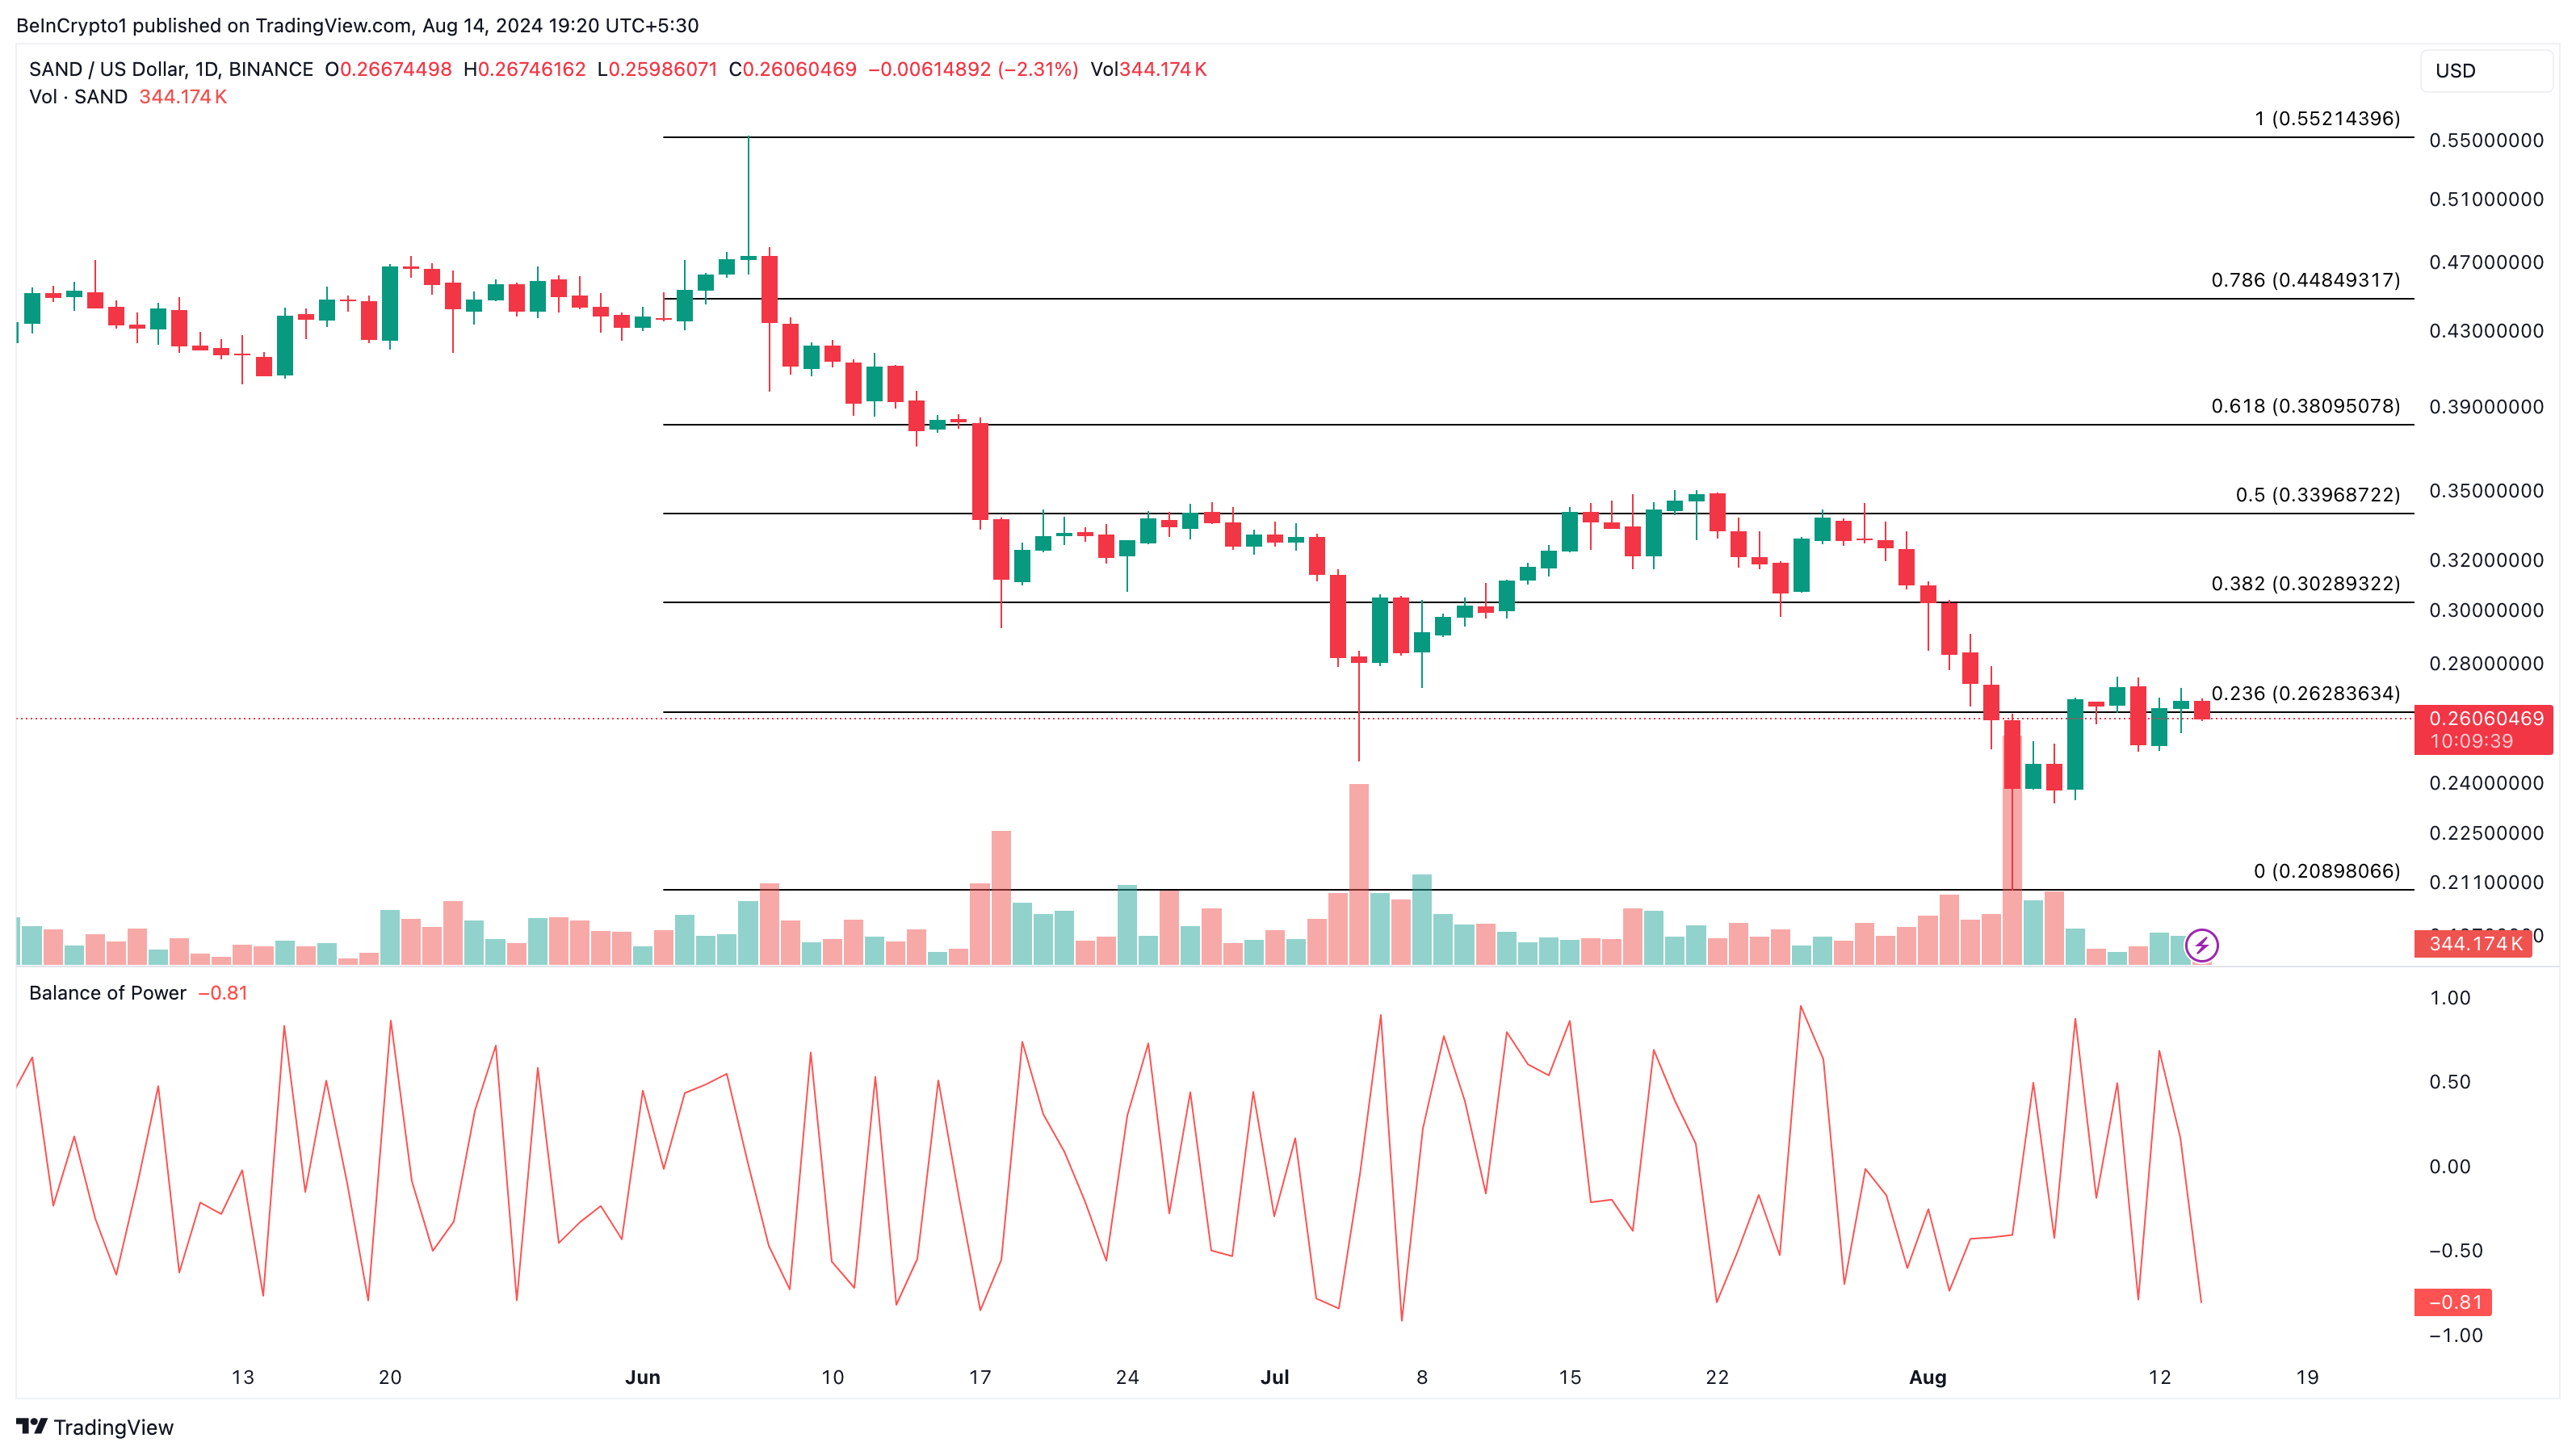
If selling pressure increases, the price of Sand could drop to $0.20. On the other hand, if a strong uptrend is seen, the token could retest the $0.30 level.


