Dogwifhat’s price fell 2.47% in the past 24 hours to trade at $1.49, followed by a weekly drop of more than 20% as traders continue to sell their holdings of memecoins on the market.
VX:ZLH1156
Dogwifhat Price Approaches Critical Support Level

Dogwifhat’s price is sitting at a critical support level of $1.3504. If this major price point falls below in the next 24 hours, the meme coin could be at risk of falling to the subsequent barrier of $1.0357.
However, if WIF sustains above $1.3504 over the next 24 hours, it could invalidate the bearish thesis. In this alternative scenario, the cryptocurrency could have the technical foundation needed to rise to the immediate resistance level of $2.1295. A breakout above this threshold could take the price of Dogwifhat to $2.8487 in the near term.
Technical indicators warn that Dogwifhat price may continue to fall
From a technical perspective, indicators on the WIF 4-hour chart warn that the cryptocurrency could continue to fall over the next 24 hours. Both the Moving Average Convergence Divergence (MACD) and the Relative Strength Index (RSI) show that bears currently have the upper hand over bulls.
The RSI reading has declined over the past 24 hours. Currently, the indicator is approaching the oversold territory of 32. This shows that WIF is facing a huge bearish pressure.
At the same time, the MACD line is below the MACD signal line. Traders often see this as a sign that the cryptocurrency is in a negative cycle. As the gap between the two lines gradually begins to widen, it seems that the bearish momentum of WIF is also increasing.
Pepe’s price has plunged 4.22% in the past 24 hours, trading at $0.00000749, the biggest drop among the top three meme coins by market cap. Prior to this, the meme coin sector had fallen 2%, bringing its market cap down to $37 billion.
The Pepe market has now mostly turned bearish, with only 50% of holders making money at current prices.
Pepe Price strives for breakthrough
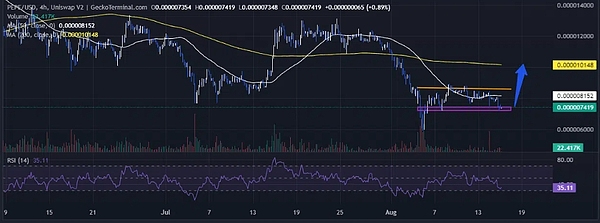
Pepe price dropped from July 29 to August 5, falling from the $0.00001216 resistance to the $0.0000060 support.
The bulls then used the support to push the price higher but encountered some resistance at the $0.000008622 level. Pepe has been trading below this level as the asset trades within a consolidation phase and a sideways pattern as investors look for a breakout, either below or above the pattern.
Pepe’s price is below the 50-day and 200-day simple moving averages (SMAs), which supports the current bearish trend.
Additionally, the relative strength index (RSI) has fallen towards oversold levels and is currently at 35, which suggests that the asset is currently facing significant selling pressure.
Pepe price bulls are aiming to break out of the sideways pattern. The oversold RSI suggests that PEPE is currently undervalued, which could be a buy signal for bulls.

If investors start buying, Pepe’s price could surge above the pattern with the bulls targeting $0.0000101 (200-day SMA).
Conversely, if the selling intensifies, the price of Pepe might break the lower boundary of the sideways pattern and find support near $0.000006912.
The article ends here. Follow the official account: Web3 Tuanzi for more good articles.
If you want to know more about the crypto and get first-hand cutting-edge information, please feel free to consult me. We have the most professional communication community, publishing market analysis and high-quality potential currency recommendations every day. There is no threshold to join the group, and everyone is welcome to communicate together!
Welcome to join the exchange group →→ VX: ZLH1156


