

Shiba Inu (SHIB) appears to be approaching a critical threshold, raising concerns of a potential further downside. SHIB has shown significant weakness in recent months due to the overall weakness in the market and other factors.
This analysis explores why meme coins may be headed for another downturn, despite a brief respite last week.
Shiba Inu continues to struggle
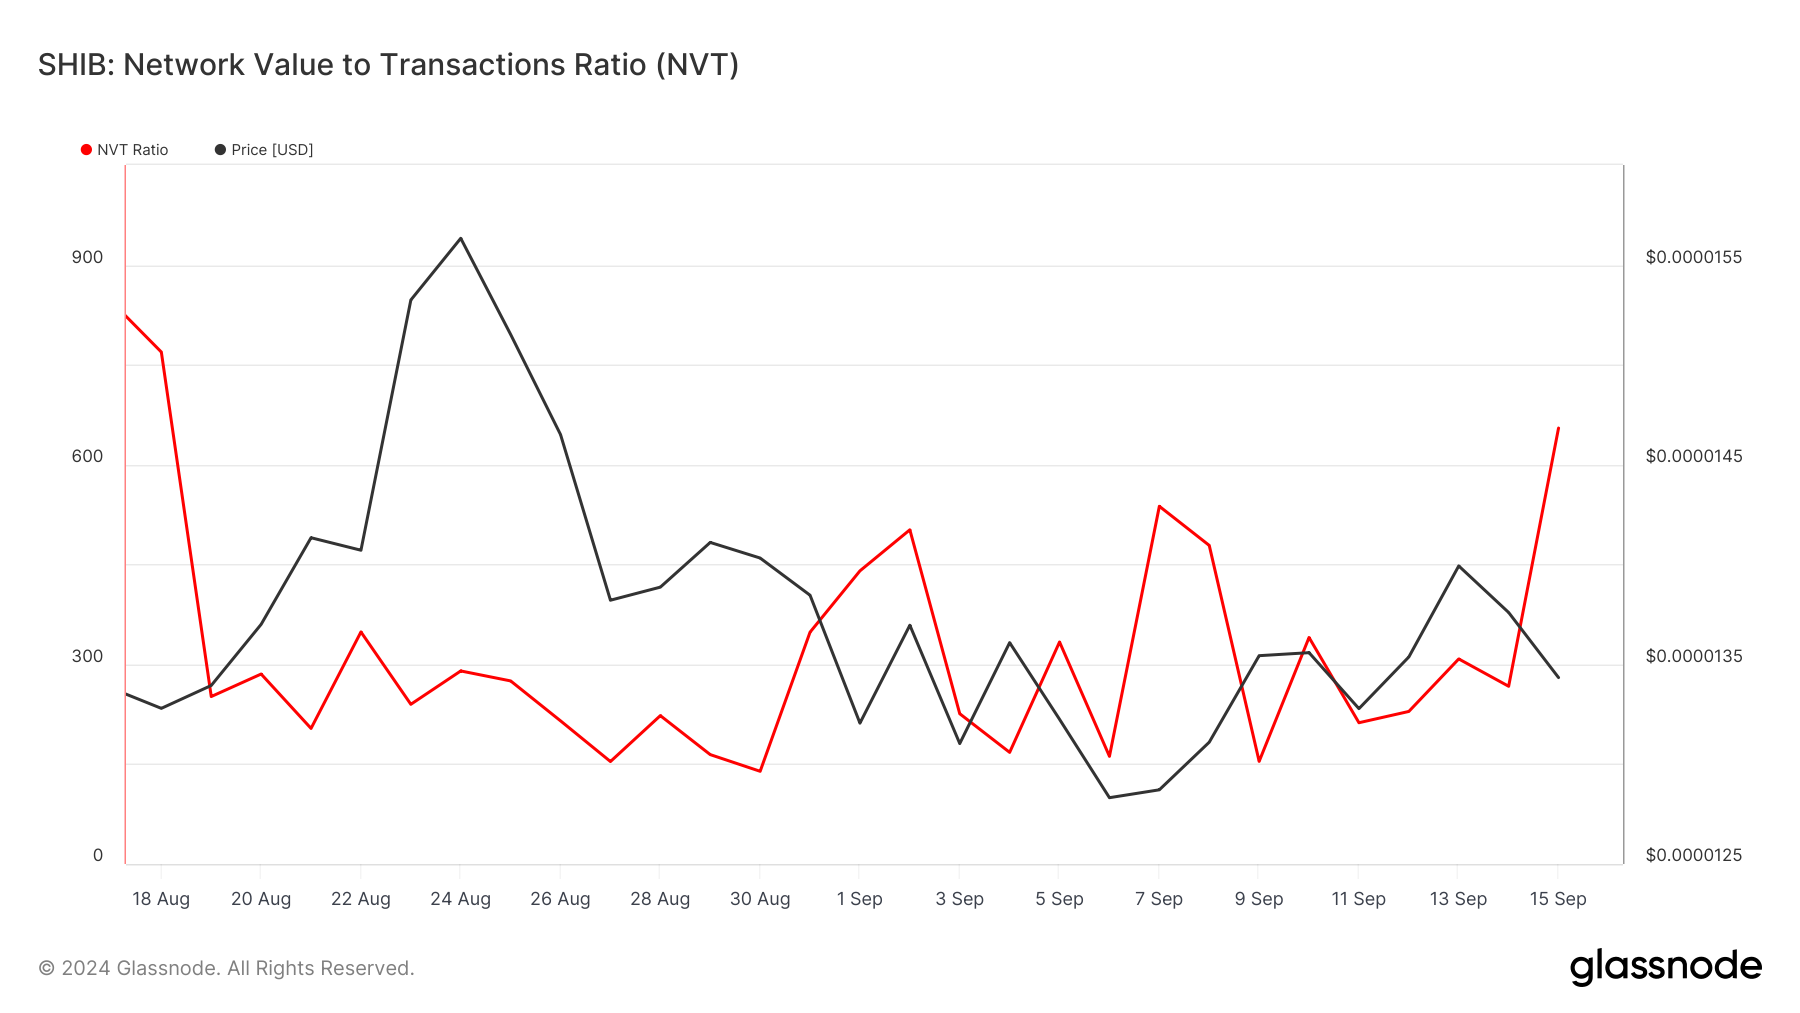
Shiba Inu (SHIB) is currently trading at $0.000013, down 85% from its all-time high. According to Glassnode, a cryptocurrency on-chain analytics platform, SHIB’s network value to volume (NVT) ratio spiked on September 14 and has remained elevated to date.
The NVT ratio measures the relationship between market price (or market capitalization) and trading volume. A low NVT ratio indicates high trading activity relative to market capitalization growth, suggesting that the asset may be undervalued.
However, in the case of SHIB, the NVT ratio is quite high, which means that the current price is overvalued. SHIB's price appears to be at a premium in the short term, and despite the increase in market cap, the low trading volume may limit the price growth.
Read more: 12 Best Shiba Inu (SHIB) Wallets in 2024
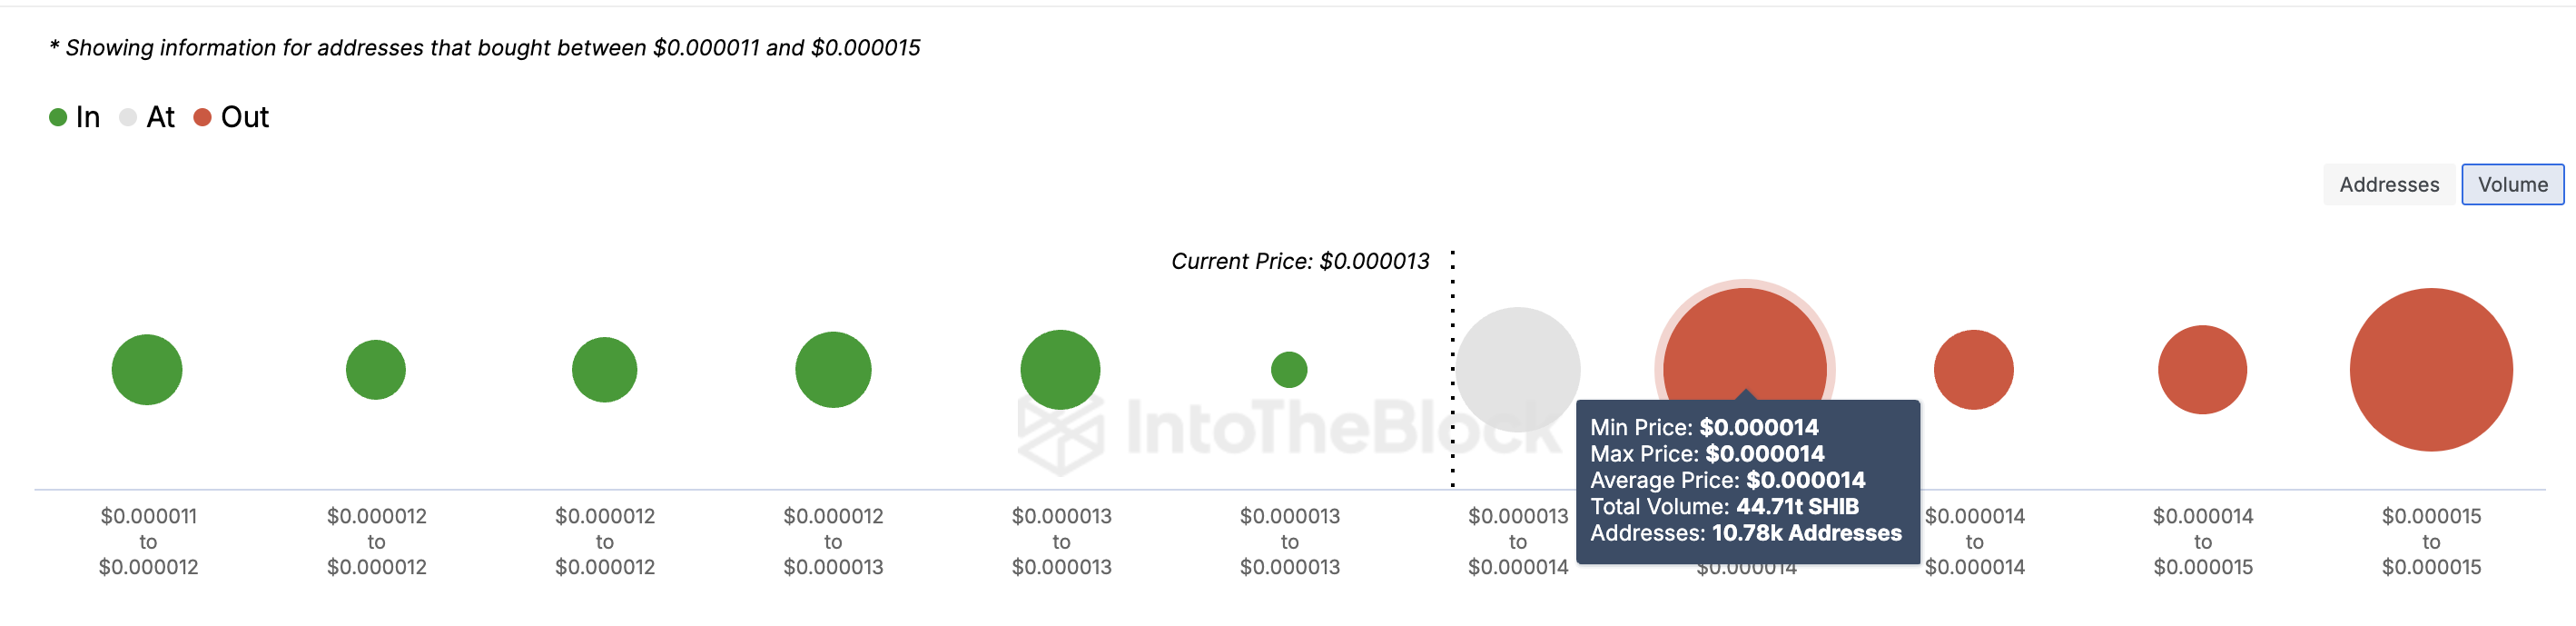
Another indicator that suggests a possible SHIB price decline is the inflow/outflow around the price (IOMAP), which tracks price levels at which large amounts of cryptocurrency are being accumulated.
The higher the volume at a particular price range, the stronger the support or resistance at that level. According to data from IntoTheBlock, SHIB is facing significant resistance at $0.000014 with 10,780 addresses holding nearly 45 trillion tokens.
This volume exceeds the amount of SHIB held between $0.000011 and $0.000013, which may lead to a supply zone exceeding demand. If this resistance holds, the price of SHIB may drop to $0.000010.
SHIB Price Forecast: No Sign of Relief
As with the IOMAP indicator, the daily SHIB/USD chart also shows resistance at $0.000014. Additionally, SHIB has been trading within a descending triangle pattern since June.
A descending triangle is formed by a downward sloping upper trend line and a horizontal support line, and is usually a bearish signal that sellers are in control and prices are likely to fall. However, if prices break out of the triangle, the bearish outlook may be invalidated.
Read more: Shiba Inu (SHIB) Price Forecast 2024/2025/2030
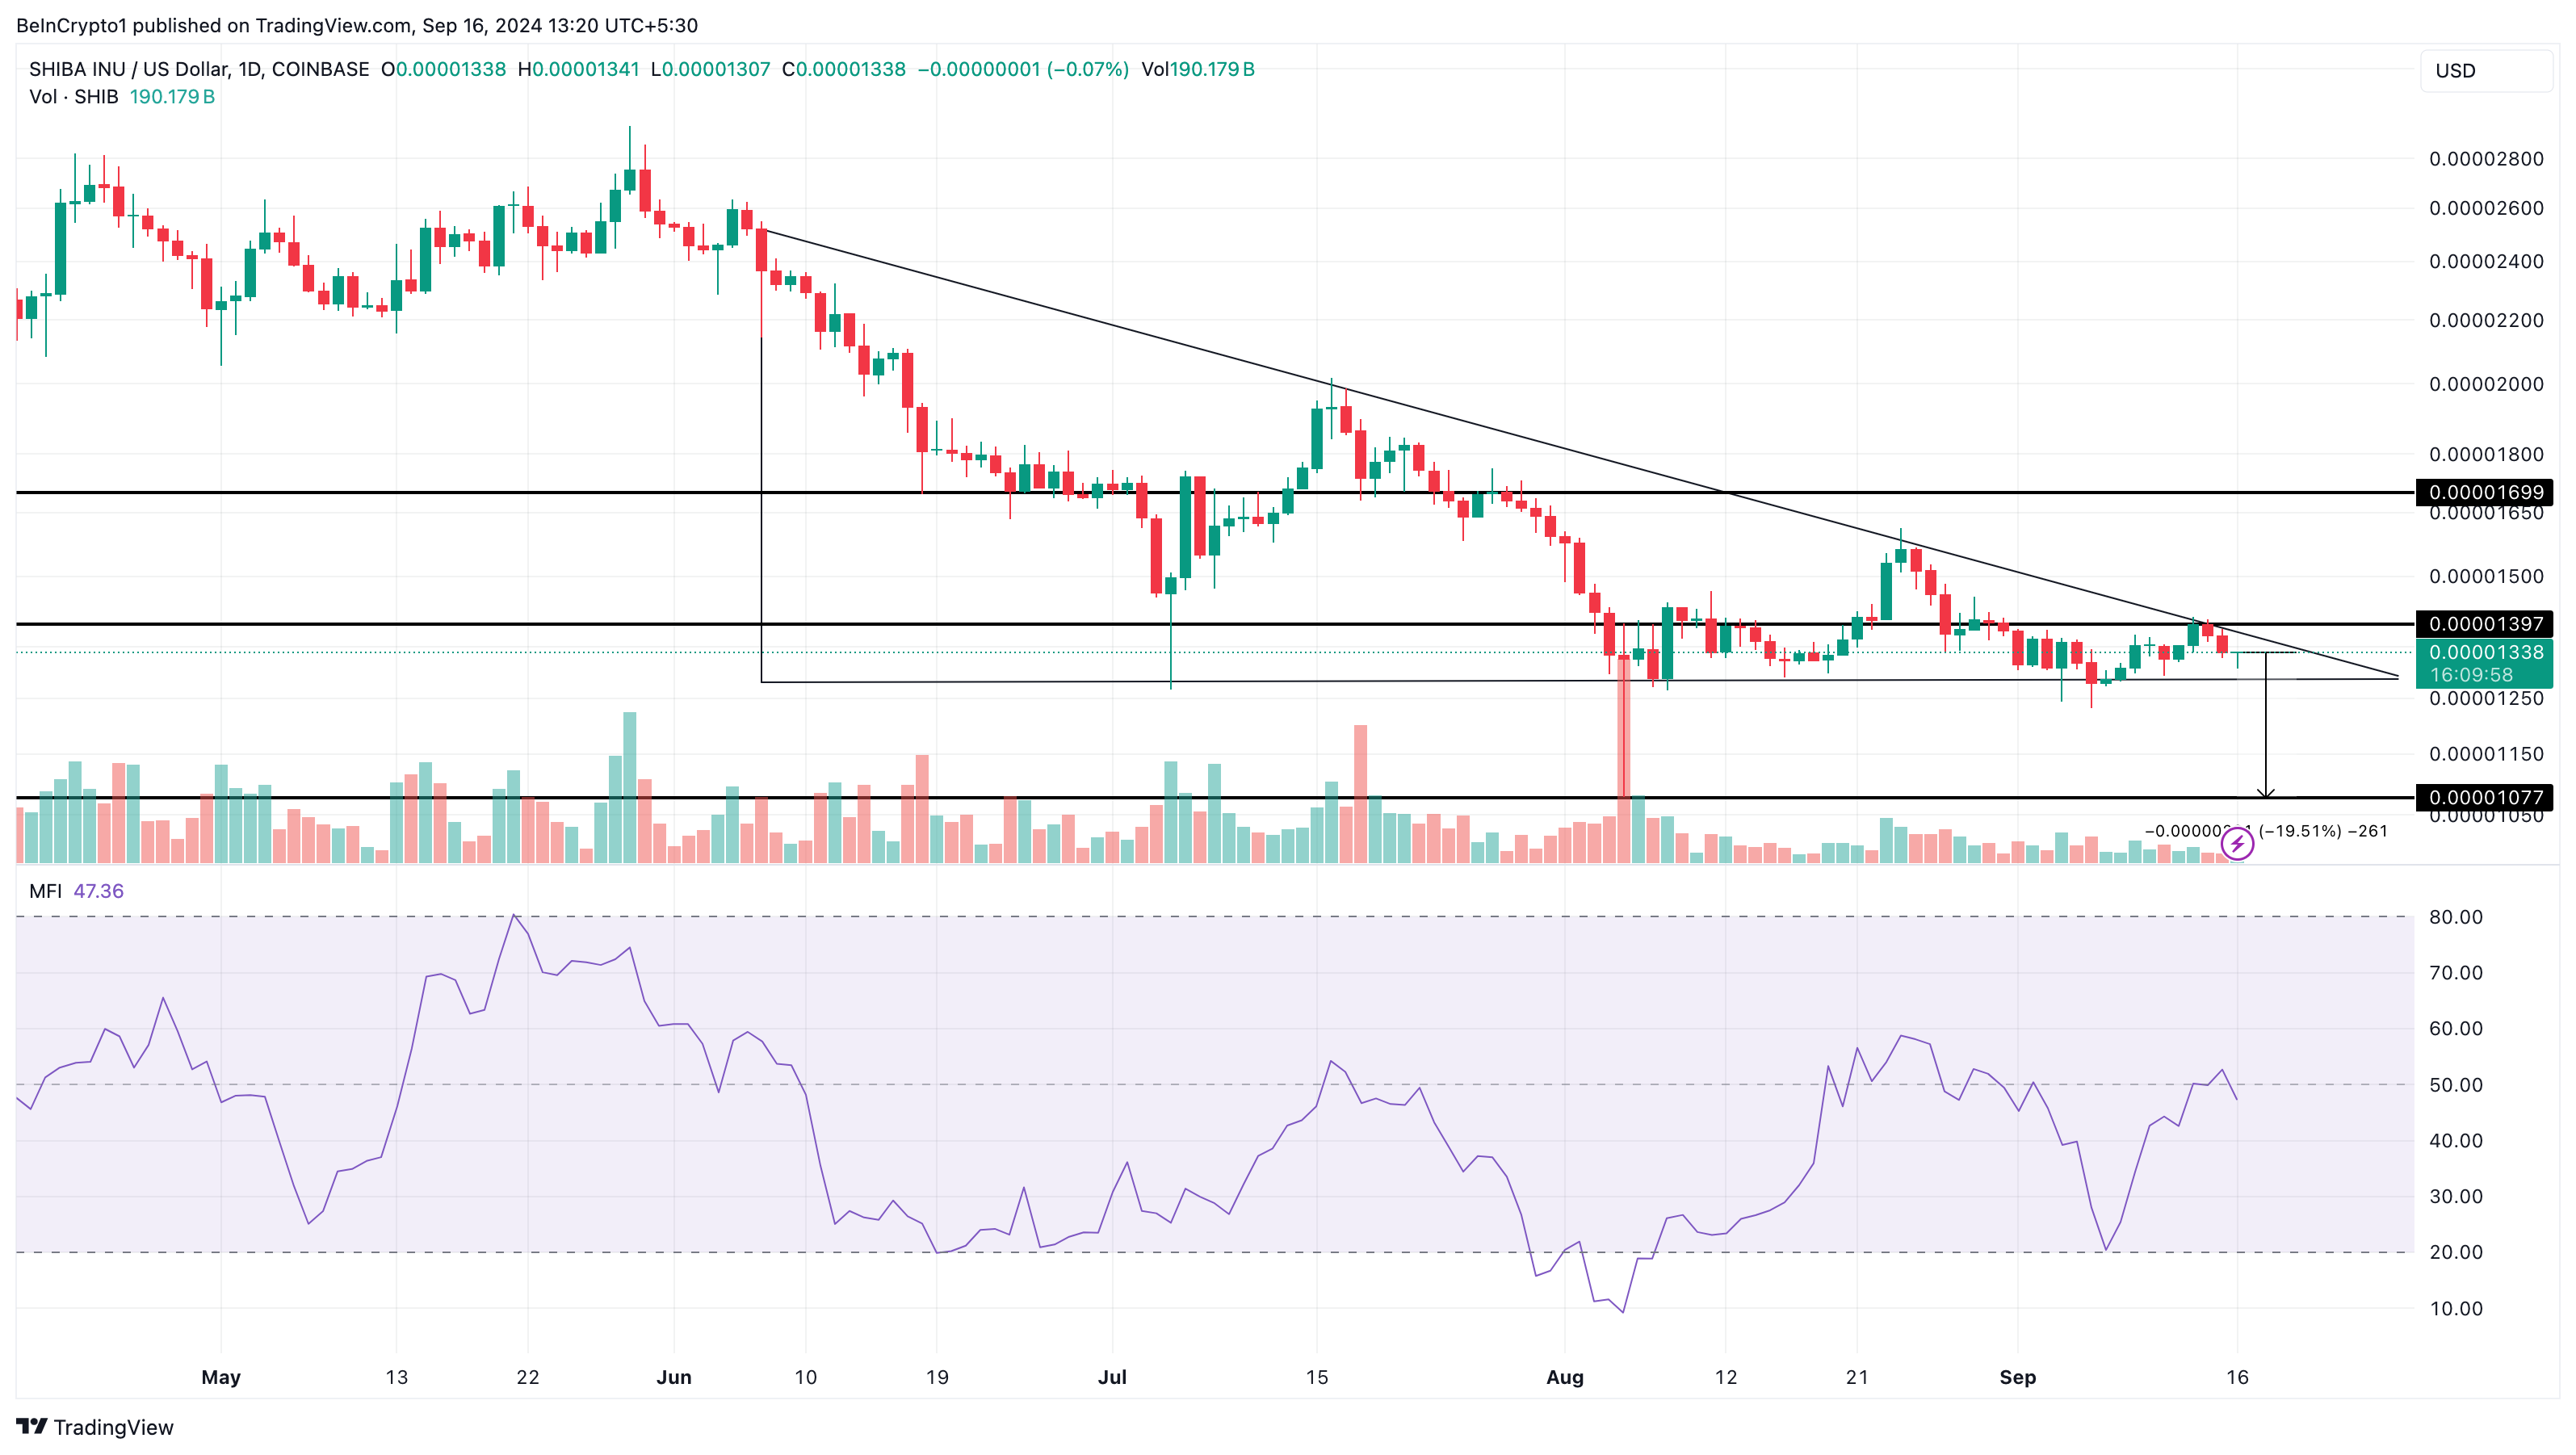
However, if the price breaks out of the triangle, the bearish theory may be invalidated. If SHIB fails to maintain the range within the pattern, the price risks falling 20% to $0.000010.
However, if SHIB breaks out of the triangle , the bearish case will be invalidated and the price could rise to $0.000016.


