If you want to know more about the crypto and get first-hand cutting-edge information, please visit Weibo Dolphin 1 for more good articles .
NEIRO
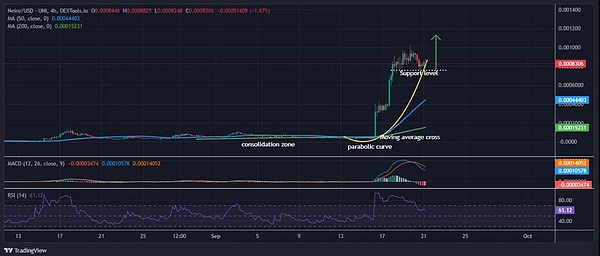
NEIRO/USD 4-hour price action suggests that NEIRO is in the early stages of a potential bullish reversal. According to data from GeckoTerminal, the recent transition from a consolidation phase to a sharp uptrend marked by a parabola suggests strong bullish momentum.
The current price is around $0.0008557 and it has crossed the 50-period simple moving average (SMA) at $0.0004439, while the 200-period SMA is slightly below the current price at $0.0001523.
Furthermore, these are key indicators that the underlying trend has changed from bearish to bullish. The 50-SMA is currently acting as potential support that could stabilize the price in the event of a pullback, while the 200-SMA is still trending down, indicating a bullish long-term trend.

The Relative Strength Index (RSI) is 61.12, pointing to overbought conditions, suggesting that Neiro prices are facing significant buying pressure. A cautious approach should be adopted as they may face a retracement or consolidation in the short term.
Support levels to watch include the recent low of 0.0007579 and the rising 50-SMA. The next key resistance is near 0.001156, where the price could encounter selling pressure. Despite the current bullish momentum, the RSI is close to overbought conditions, warning of possible volatility.
SUI
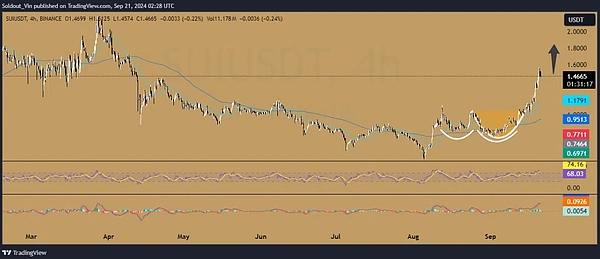
SUI/USDT price analysis on the 4-hour chart shows that in August and early September, Sui price bulls struggled to push the price above the $1.06 resistance level.
The support level of $0.77 allowed the price of Sui to form a Double Botto pattern. In the final rounding bottom pattern, the bulls used the support level to push the price of Sui up continuously.
SUI price is currently trading above the 50-day and 200-day Simple Moving Averages (SMAs), which are currently acting as immediate support levels at $1.179 and $0.095, respectively. The coin trading above both SMAs also confirms a bullish bounce.
Furthermore, the Relative Strength Index (RSI) has also climbed into the overbought zone of 70 and is currently at 68, indicating that SUI is currently facing significant buying pressure.
The moving average convergence divergence (MACD) crossing above its neutral line also supports the bullish trend.

SUI is currently in a bullish trend and the bulls are aiming to sustain this trend. The RSI and MACD further support the positive trajectory as investors continue to pour into the coin.
If the current momentum continues, SUI could surge further as the bulls are currently targeting $1.84.
In the opposite scenario, if the bears take control of the price, the SUI could drop to the $0.95 support, which coincides with the 200-day SMA.
SXP
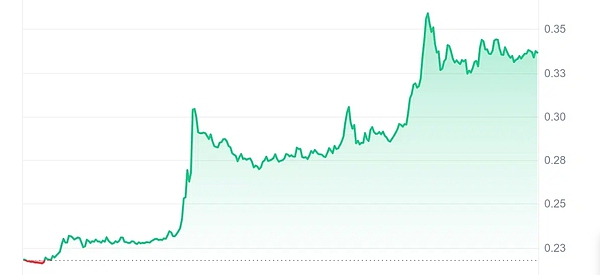
Solar became the biggest gainer on our list, surging a staggering 53.05% in just 24 hours! This surge is astounding, especially since there was no obvious news driving it. Such a leap could indicate increased interest or a change in market dynamics rather than a specific announcement. This highlights the token’s utility in the Solar blockchain ecosystem, where staking and governance are key components.

Currently, SXP is 1.16% below its 200-day simple moving average (SMA), which could dampen bullish expectations. Its price has risen by only 18% over the past year, outperforming only 31% of the top crypto assets. However, its foundational role in the Solar blockchain remains important, making it a key player in the ecosystem.
The article ends here. Follow Weibo Dolphin Dolphin 1 for more good articles. If you want to know more about the relevant knowledge of the crypto and first-hand cutting-edge information, please consult me. We have the most professional communication community, publishing market analysis and high-quality potential currency recommendations every day. There is no threshold to join the group, and everyone is welcome to communicate together!


