FET is a leading force in the AI crypto space, outpacing its competitors in both market cap and trading volume. With 75% of addresses reporting profits and a recent golden cross suggesting strong bullish momentum, FET could be on the verge of a major rally.
As key resistance levels are approached, the possibility of a new all-time high is becoming increasingly likely.
FET is ahead of its AI competitors
FET is a leader in the AI cryptocurrency space, and several factors are solidifying its lead. Currently, FET has the largest market cap among AI-related coins, at $4.22 billion.
Bittensor is close behind with a market cap of $4.19 billion, but FET’s lead is even more pronounced when compared to the rest of its competitors: Render, Worldcoin, and Akash Network combined are less than FET’s market cap.
In 2024, FET recorded a whopping $499.2 billion in trading volume, which is more than 4.5 times that of its closest competitor, Bittensor. This volume gap is a significant indicator of the level of market interest and liquidity through FET.
Read more: How to Invest in Artificial Intelligence (AI) Cryptocurrencies?
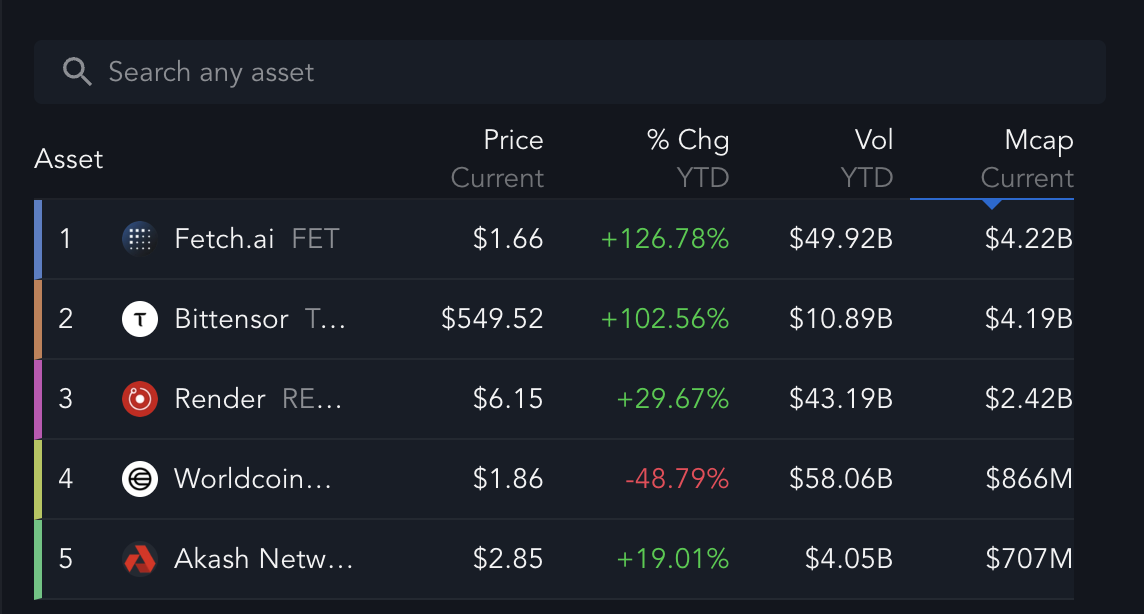
Also, FET’s year-to-date price has risen by an impressive 126.78%, outperforming Bittensor, which has posted a strong but relatively low 102.56%. The high trading volume reflects strong demand and wide participation, which is favorable for the FET price.
Investors and traders are clearly taking notice of FET, which could create a positive feedback loop that could continue to grow liquidity, visibility, and market prominence, which could establish FET as a leading AI coin in the market.
FET Profitable Address Could Lead to New Price Rise
Currently, about 75.25% of FET addresses are in profit, which means that roughly 85,010 addresses are making a profit at the current price of $1.70. Meanwhile, about 21.44%, or 24,220 addresses are in loss, and a small minority of 3.31%, or 3,740 addresses are at break-even.
This distribution suggests that the majority of FET holders are confident in the future of the asset and are already seeing positive returns on their positions. When a large percentage of holders are seeing returns, this usually indicates strong market sentiment and the potential for further upside momentum.
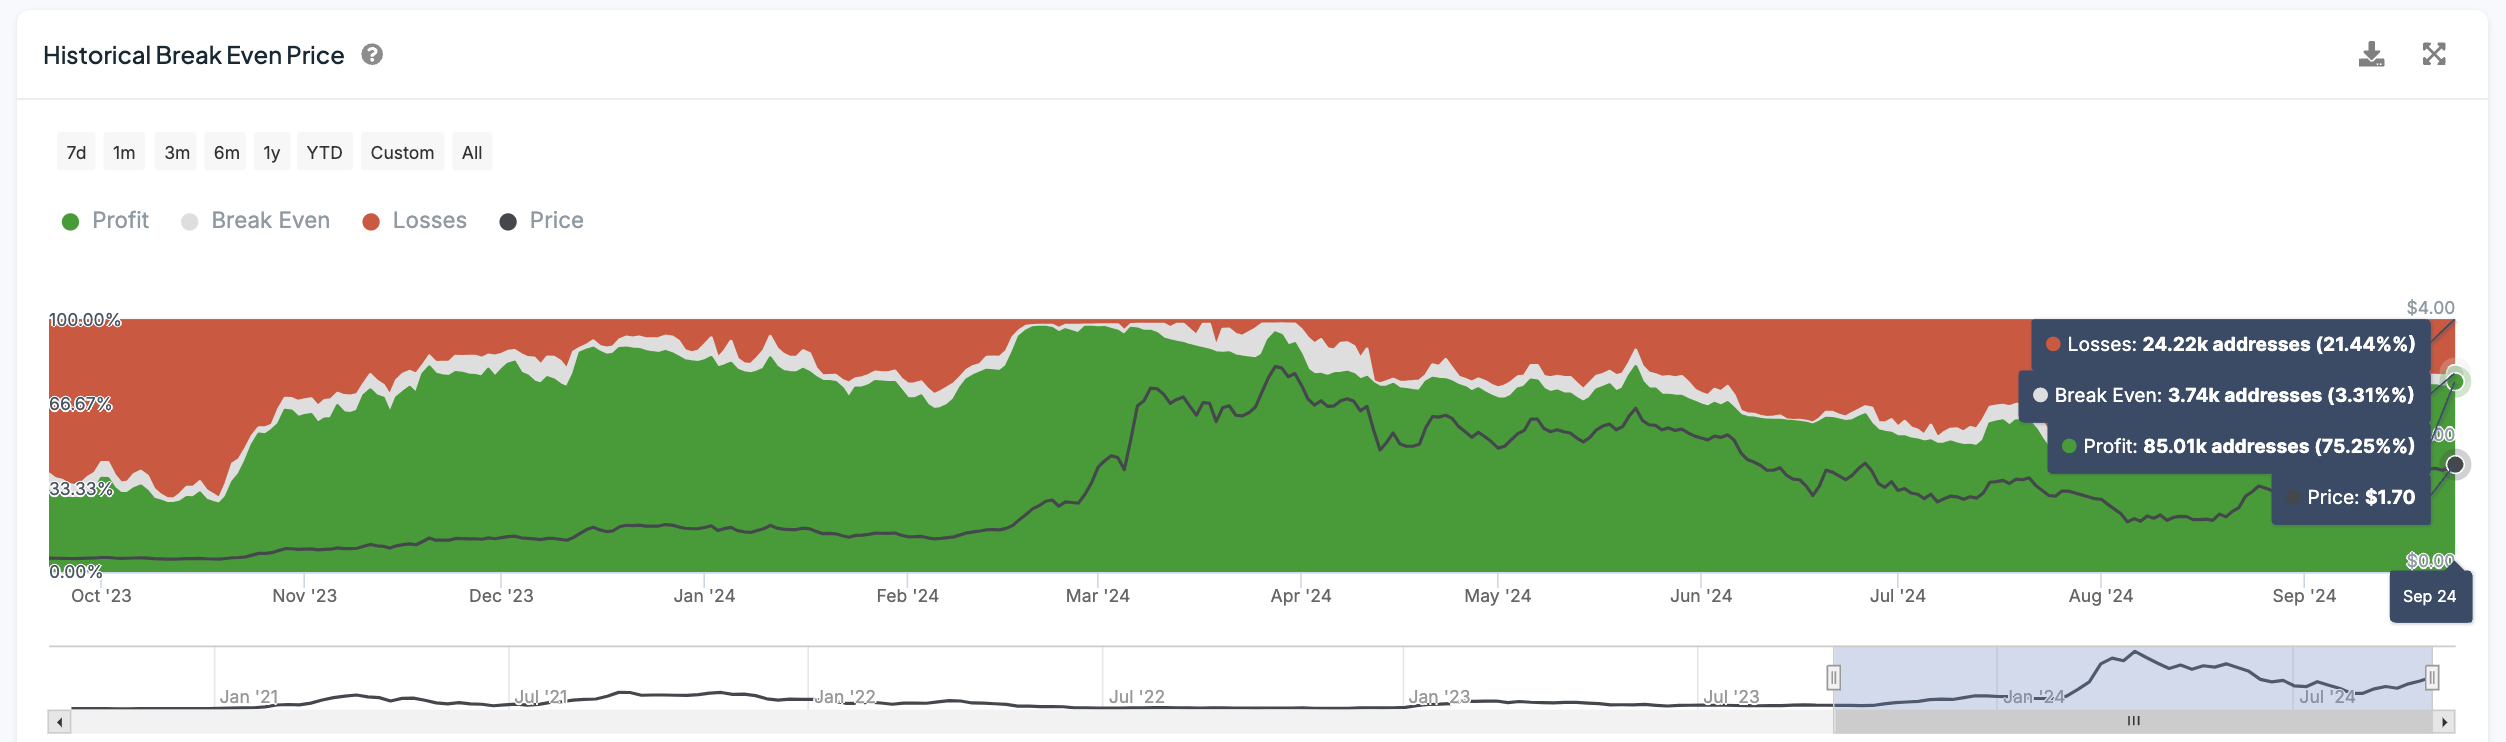
Historically, during FET’s uptrends, a similar percentage of profitable addresses have driven price increases of over 500% in a single month. This past performance suggests that conditions could be ripe for rapid price appreciation if demand continues to grow while many holders are already profiting.
Considering the current ratio of profitable addresses, the FET price may be gearing up for another major rally that could be compared to previous bull runs.
FET Price Prediction: Breaking All-Time Highs Soon?
FET recently formed a golden cross, which is a bullish technical pattern where the short-term exponential moving average (EMA) crosses above the long-term EMA. This pattern usually indicates that bullish momentum is building, and further price gains are likely to follow. In the case of FET, the various EMA lines on the chart are in a bullish alignment, with the short-term EMAs being above the long-term EMAs.
EMA is used to smooth price data and identify trends more clearly. Unlike simple moving averages, EMA gives more weight to recent price changes, making it more sensitive. Traders usually track various EMAs such as 20-day, 50-day, 100-day, and 200-day to assess trend strength and direction. In the case of FET, these EMAs show a clear upward trajectory, reinforcing the bullish outlook.
Read more: Top 9 AI Cryptocurrencies in 2024
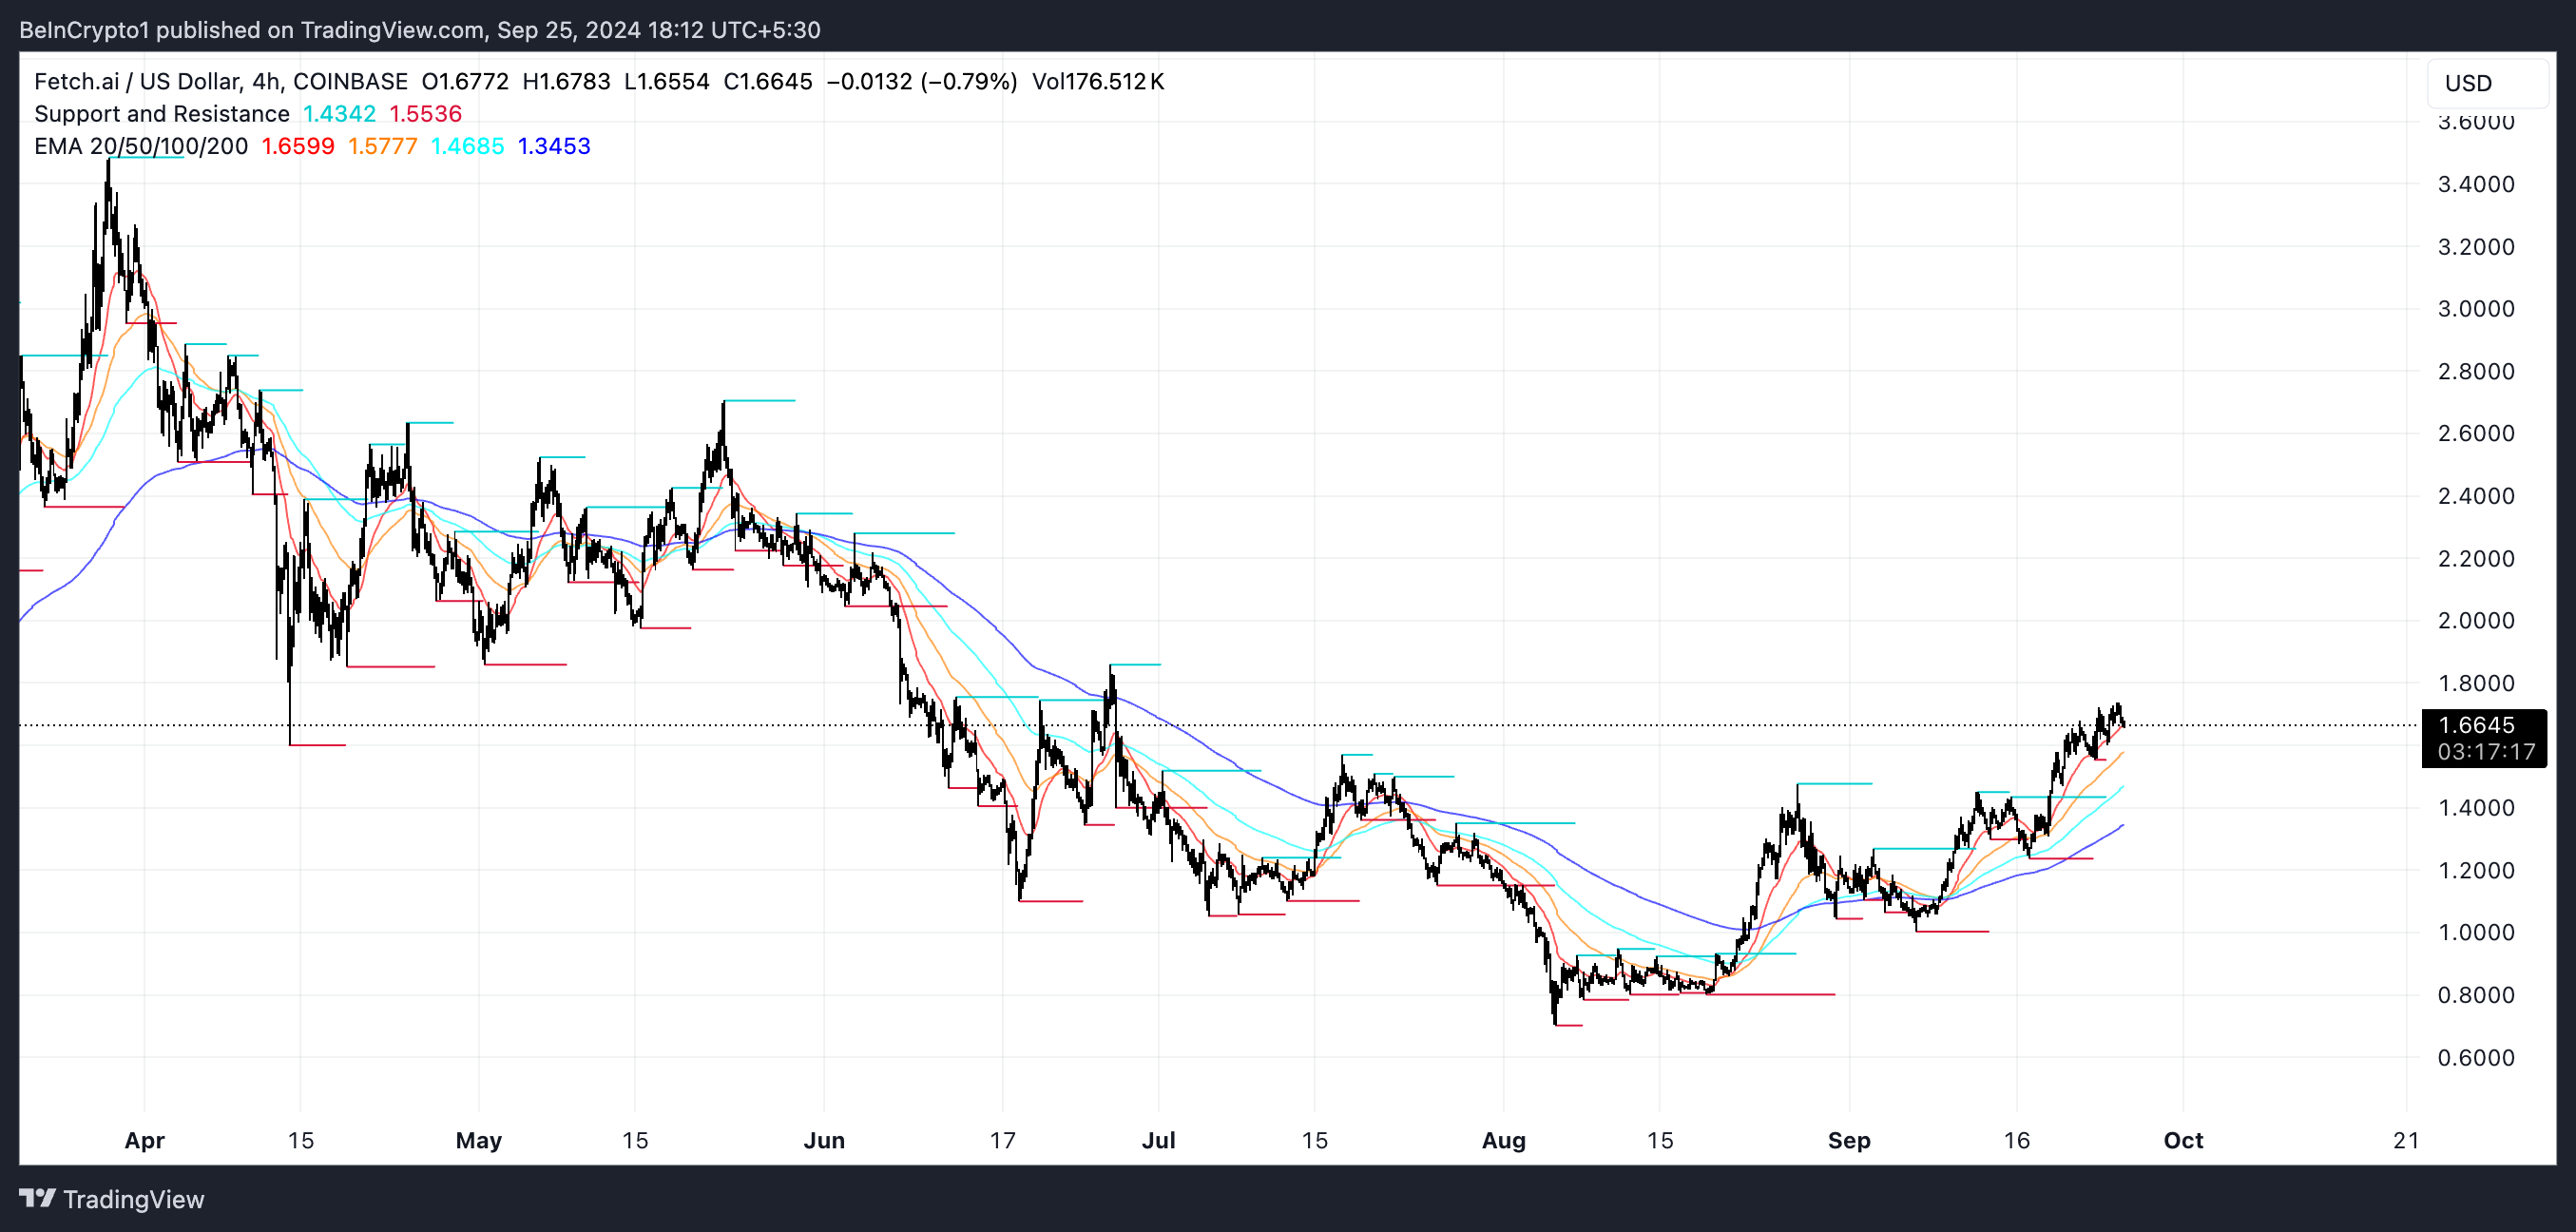
If this uptrend continues, FET could test the major resistance levels of $1.86 and $2.28. A break above these levels could strengthen the bullish case, leading to additional resistance levels of $2.70 and $3.48. A break above these could push FET towards new all-time highs , suggesting a strong bullish move.
However, if the uptrend weakens and the price of FET reverses, the support levels of $1.24 and $1.00 may become important. If the bearish sentiment continues, the price may fall further to $0.80. These key levels will determine whether FET can maintain its bullish momentum or if a deeper correction is coming.