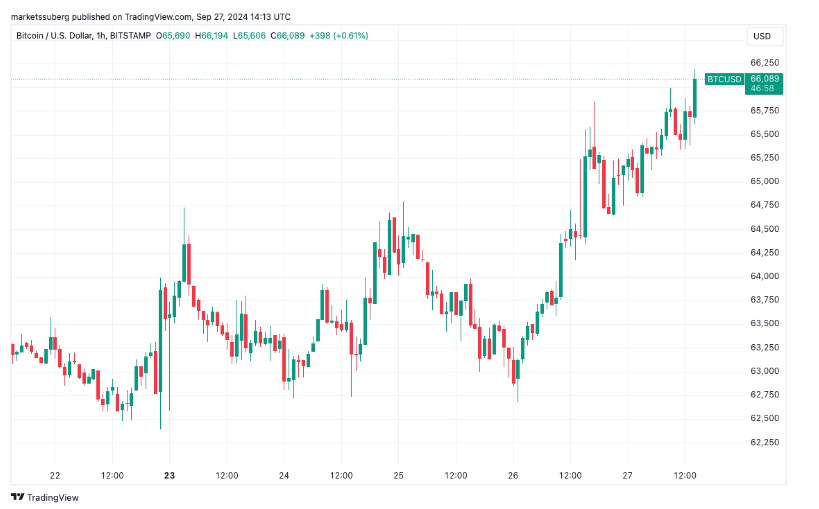
BTC price activity has market watchers excited as China’s stock market has had its best week in 16 years. Bitcoin hit a two-month high, returning above $66,000, driven by China’s economic stimulus policies.

BTC/USD 1-hour chart. Source: TradingView
Bitcoin follows Chinese stock market surge on stimulus measures
Data from Cointelegraph Markets Pro and TradingView tracked a new high for BTC price on Bitstamp, reaching $66,194.
BTC/USD has gained 3% so far this week , with the added impact of China’s financial policies, which saw the Shanghai Composite Index post its best weekly performance since 2008 following a series of stimulus measures.
"This feeling is very familiar," wrote trading resource Kobeissi Letter in response to X.
Since the Federal Reserve announced its policy easing measure of 50 basis points in rate cut on September 18 , the S&P 500 index has hit record highs.
The key US macro data released that day - the August personal consumption expenditure (PCE) index - was basically in line with expectations.
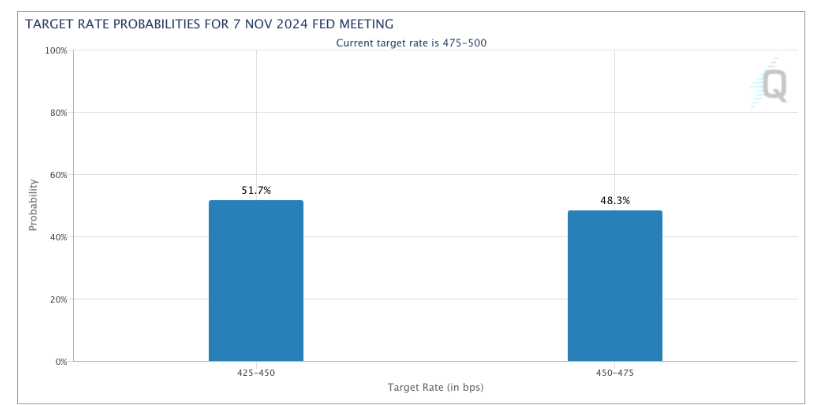
“The next Fed meeting is in November and the market is hoping for another 50 basis point rate cut,” Kobeissi continued on the topic.
Although Kobeissi believes that "a 50 basis point rate cut is not needed in September or further rate cuts in the future," data from the CME Group's FedWatch tool shows market demand.

The probability of the Fed's target interest rate. Source: CME Group
Skew, a popular Bitcoin and cryptocurrency trader, described the PCE results as “pretty good” for the market.
“Keep an eye on yields and the dollar as we close this week,” he told X’s followers.
BTC price support remains at $65,000
Meanwhile, Bitcoin itself continues to hold key support levels after a slight pullback from two-month highs. “Price is once again colliding with sell liquidity, with some passive selling around $658K,” Skew noted in another post about trading activity on Binance, the world’s largest exchange . He added that buy liquidity is shifting from below towards $63,000.
The post continued: “So I noticed the other day that if the market remains strong and momentum moves above $65,000, the ask depth in the spot order book could turn into bid depth.”
“We can see this happening as takers absorb sell liquidity starting at $65,000 while more passive buyers flow into the market.”
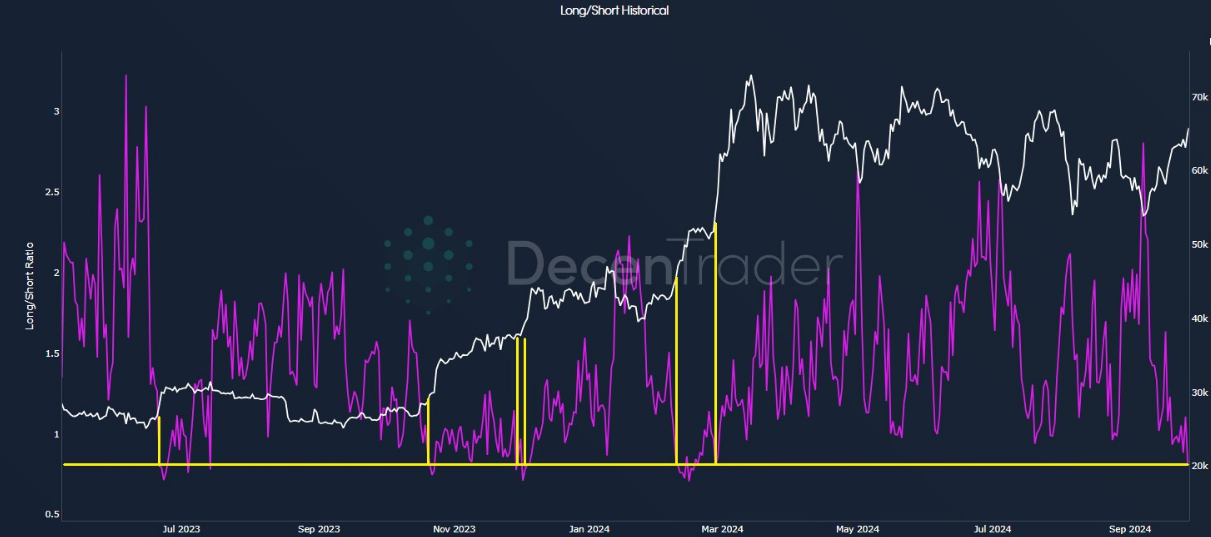
Filbfilb, co-founder of trading suite DecenTrader, revealed that the ratio of BTC long to short positions is “very low,” which could be an additional sign of bullish price action ahead.
The accompanying chart shows that a similar situation occurred before a BTC price increase.
After discussing various other promising indicators, he concluded : “I think there’s a particularly familiar air of bullishness about Bitcoin.”
“Right now, technically we are lacking a higher high to put a dent in these calls, let’s see if FOMO kicks in.”

BTC long/short ratio. Source: Filbfilb/X


