

The relative strength index (RSI) of Toncoin (TON) has risen sharply, moving from an overbought state to a neutral level. Despite this increase, the RSI remains in the neutral range, not indicating a clear trend dominance.
Additionally, the TON supply on exchanges is stable, causing traders to hesitate in making significant moves. The EMA lines are showing a weak downtrend, suggesting that TON is in a corrective phase.
TON RSI is in a neutral state
The current RSI of TON is 45.56, a significant increase from the 30 on October 9th. This recent rise indicates that buying momentum has improved, and the asset has recovered from an oversold condition a few days ago. The rise from 30 suggests that selling pressure has greatly weakened, leading to stabilization in price action.
However, despite this increase, the RSI is still within the neutral range. The current level reflects a transitional market where neither buyers nor sellers have a firm control.
The RSI, or Relative Strength Index, is a momentum indicator that measures the speed and magnitude of recent price changes. An RSI value above 70 suggests the asset may be overbought, implying a possible pullback. Conversely, values below 30 often indicate an oversold condition, hinting at a potential reversal.
Read more: The 6 Best Toncoin (TON) Wallets in 2024
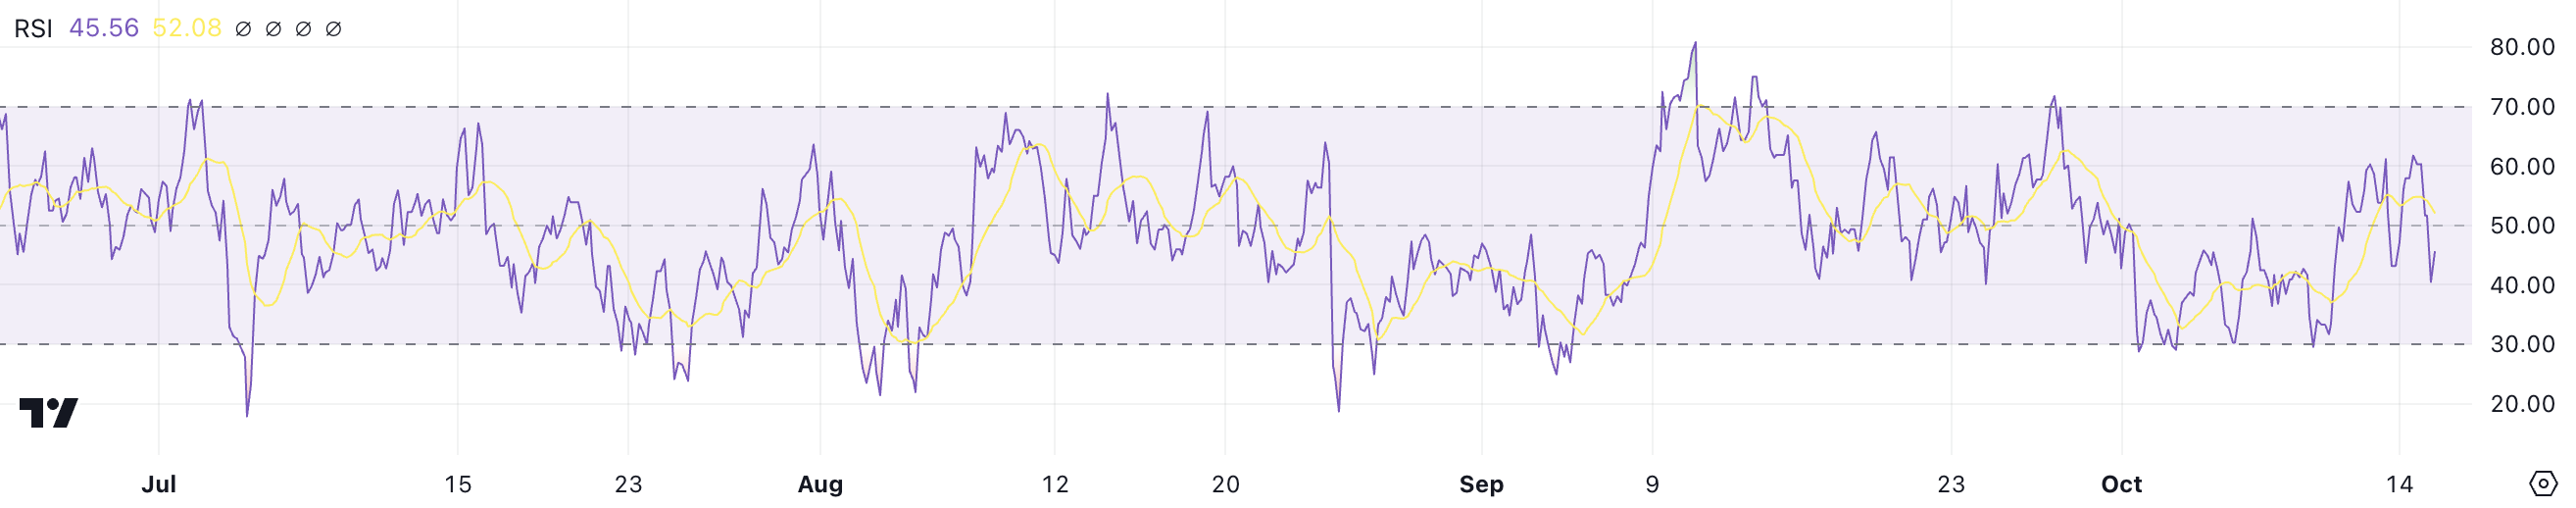
The current TON RSI of 45 is comfortably positioned between these extremes. In this neutral zone, the RSI does not provide a clear directional signal, suggesting that TON's price may continue to consolidate.
The market is seeking clarity, and the current momentum is not strong enough to drive a decisive breakout or breakdown. As a result, TON may move within a range in the short term, awaiting a more definitive catalyst to change the trend direction.
Toncoin supply on exchanges is stable
Between September 29th and October 2nd, the TON supply on exchanges decreased significantly from 2.29 million to 1.56 million. This notable decline suggests that many holders have withdrawn tokens from exchanges to their personal wallets. However, the supply has since slightly increased, reaching the current level of 1.63 million.
This partial recovery may indicate that some traders are preparing to re-enter the market, seeking trading opportunities. Despite this bounce, the overall supply remains much lower than the late September levels, reflecting a shift in investor sentiment compared to the previous increase in exchange balances.
Generally, an increase in the exchange's coin supply is considered a bearish signal. Coins moved to exchanges are often for the purpose of selling, creating additional selling pressure.
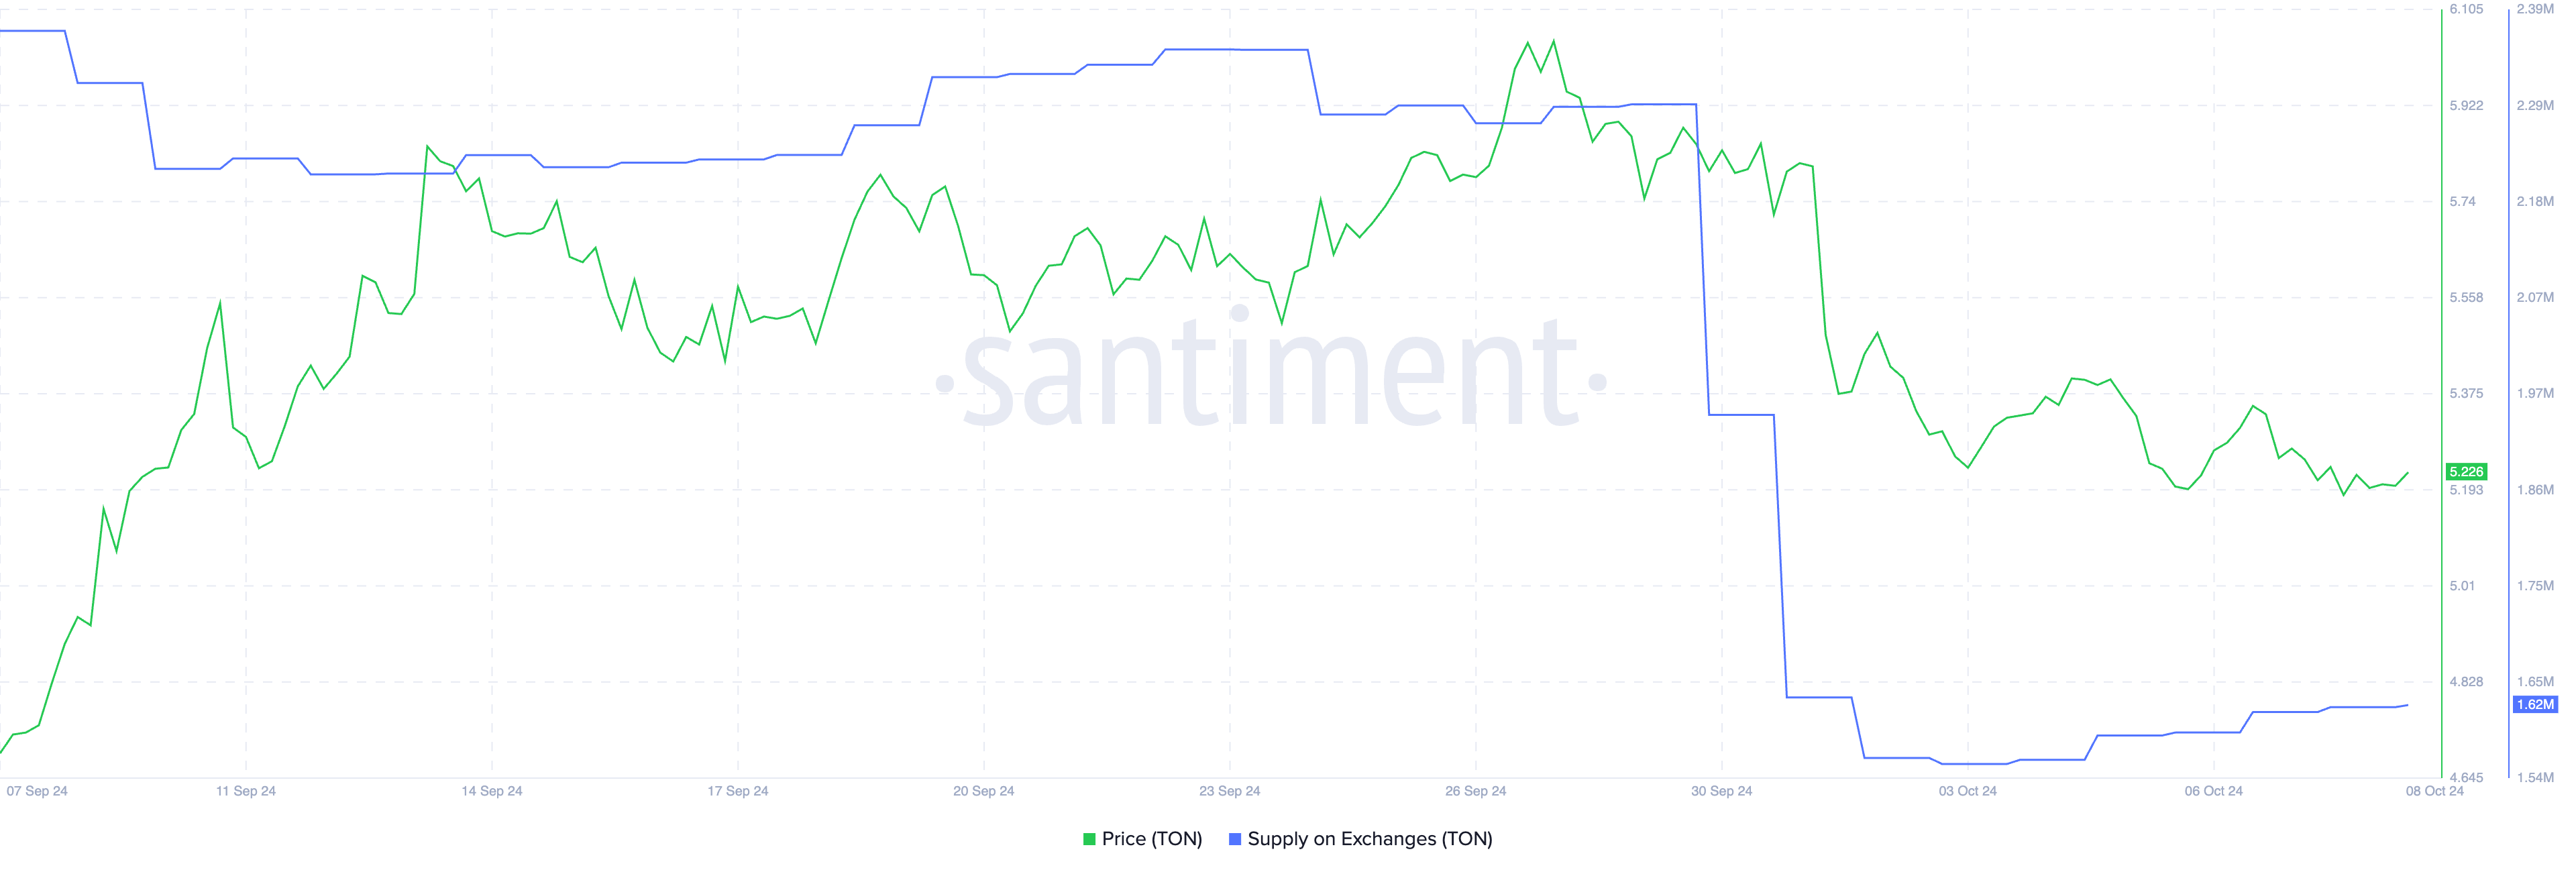
This was the case when TON's price declined from $5.88 to $5.34 in early October. However, the recent stability in TON's exchange supply suggests that the market may not have a strong directional bias at the moment.
The relative stability of around 1.63 million indicates that traders and investors are not heavily skewed in either direction. This quiet period suggests that market participants are waiting for clearer signals before deciding on additional moves.
This implies that TON may remain in a consolidation phase until it finds balance in either direction.
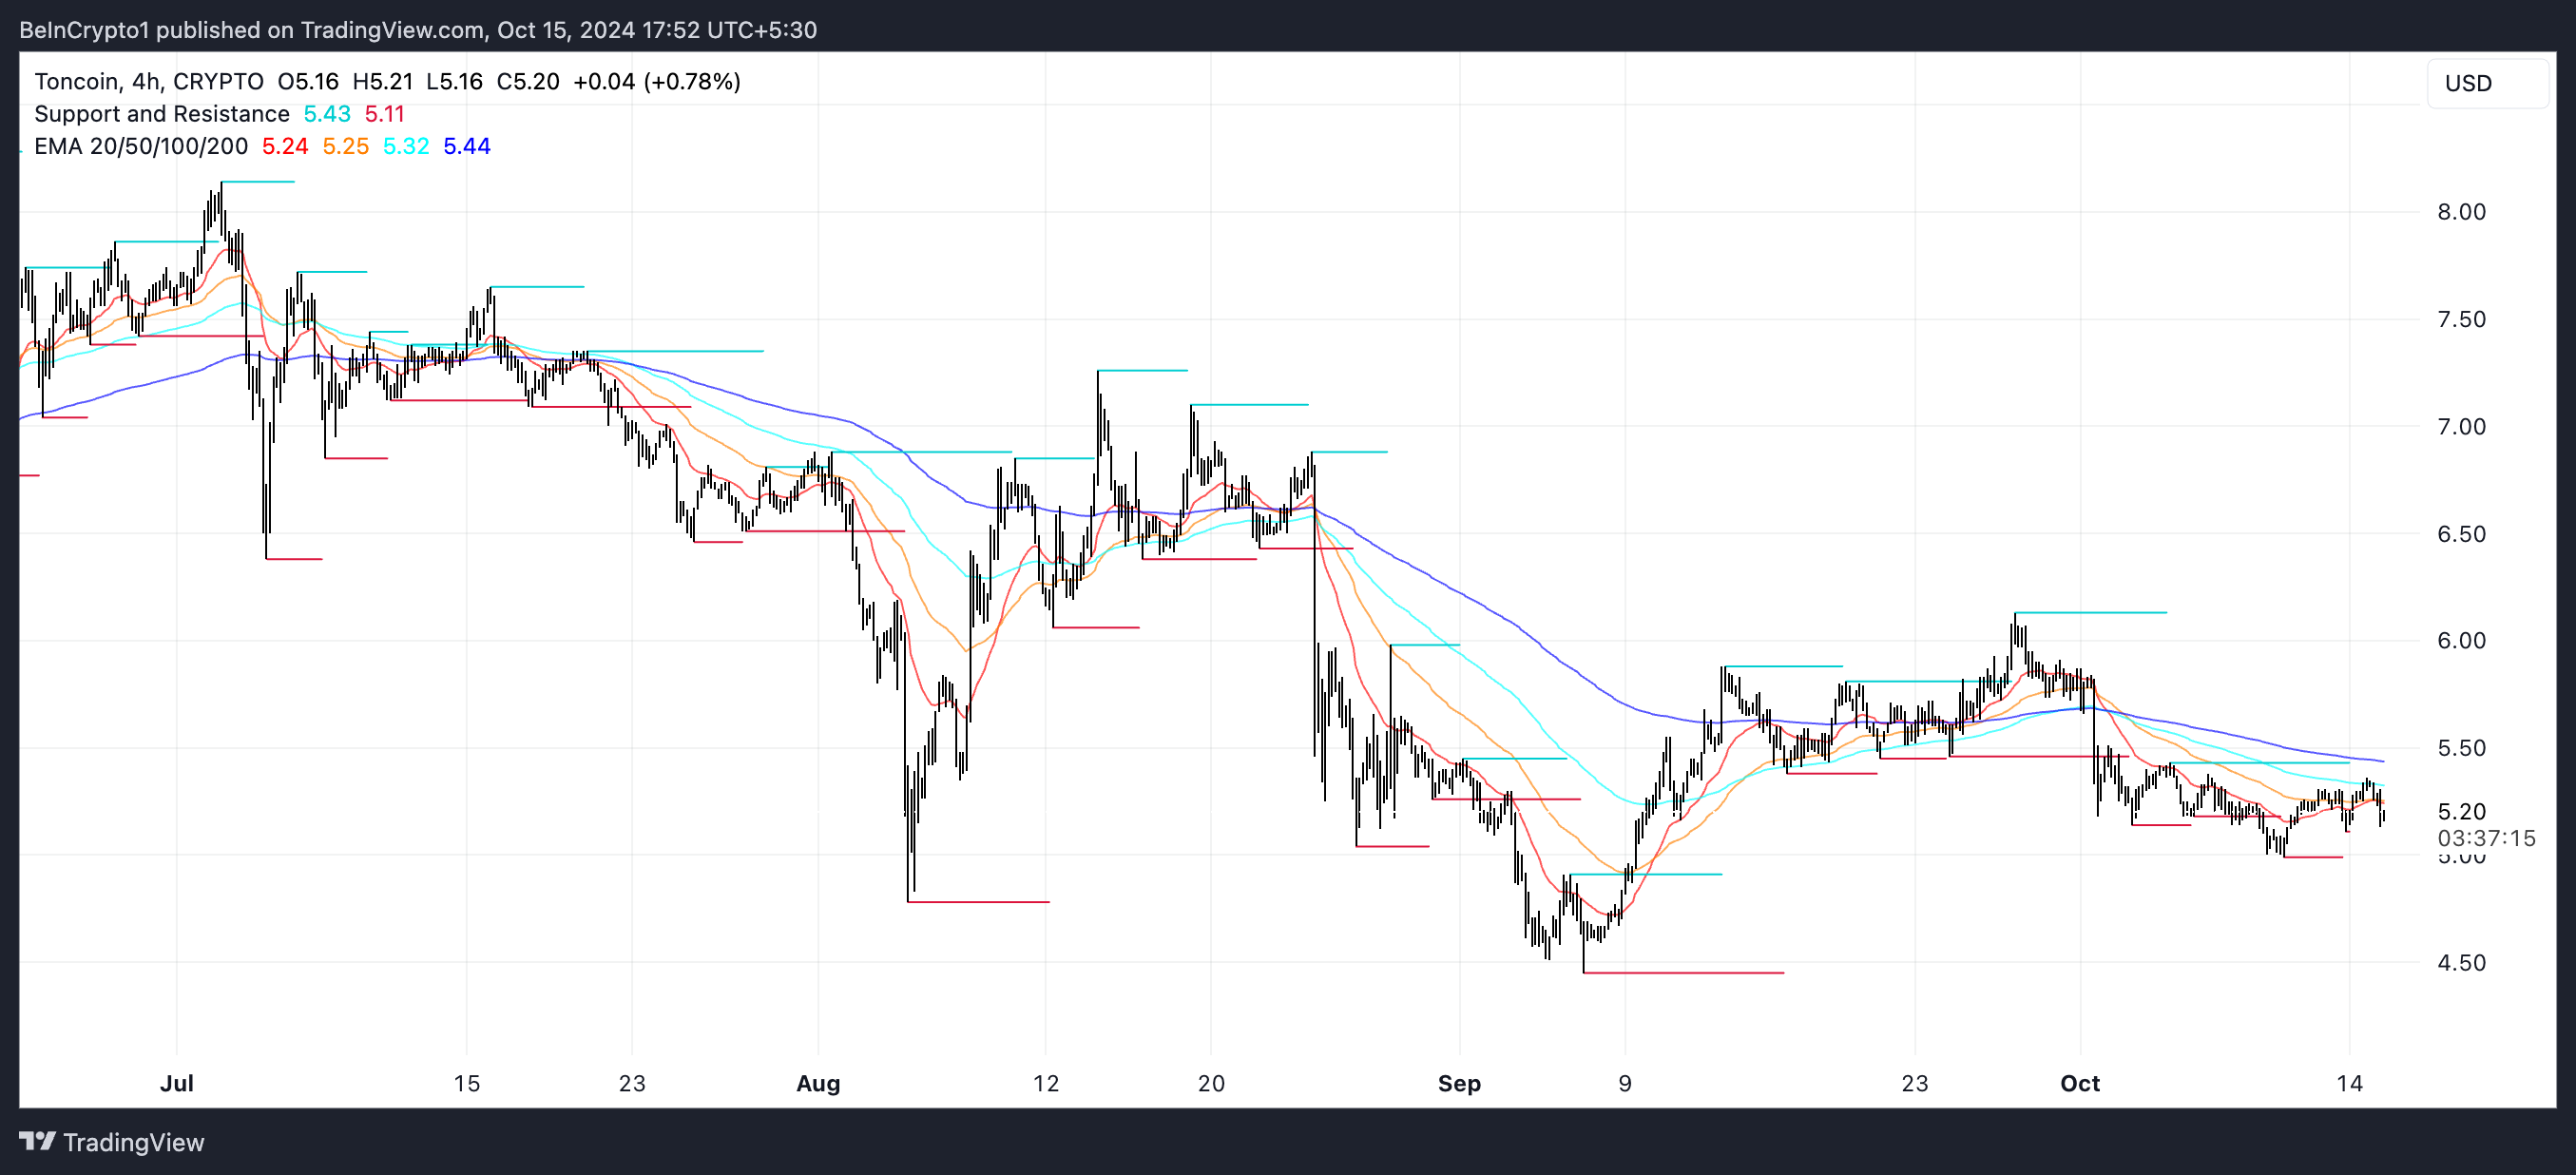
TON Price Prediction: Possible Rebound to $6.13?
Currently, the EMA lines for TON are showing a downtrend, with the short-term moving average below the long-term one. This alignment generally signals the dominance of bearish pressure. However, the distance between the short-term and long-term EMAs is very small, suggesting that the downtrend may not be particularly strong.
When these moving averages are close to each other, it implies that the price momentum is not decisively negative, and a shift in market sentiment can quickly change the trend direction. The convergence of these lines is a signal of uncertainty, indicating that traders should be cautious before assuming a persistent downtrend.
The EMA, or Exponential Moving Average, is a technical indicator that tracks the average price of an asset over a specific period. It gives more weight to recent price data, better reflecting momentum. The short-term EMA line reacts quickly to price changes, while the long-term EMA is slower to respond.
Read more: The 9 Best Free Crypto Signals Telegram Channels in October 2024
When the short-term EMA falls below the long-term EMA, it signals that the recent price movements are weaker than the long-term trend, which is generally interpreted as a bearish sign.
If TON's downtrend becomes more pronounced, the price may test the support level, potentially falling to $4.99 or $4.78. However, if the market sentiment improves and the trend reverses, TON's price could retest the $5.88 area and potentially rise to $6.13, presenting a new upward momentum.
The small gap between the EMA lines allows both scenarios to be possible, depending on the prevailing market forces.


