Solana [SOL] tested the $180 resistance area, but failed to convert it into a support area. The price trend indicates that although the momentum and sentiment are bullish, further upside may be difficult. More information Crypto Buns

Since June, Solana's trading price has fluctuated in the range of $122 to $187. On October 19, the $154 median level was broken, and SOL began to move towards the top of the range.
Over the past 7 months, Solana's price has been consolidating, struggling to maintain above the $200 level. However, with the cryptocurrency market recovering again in late October, the SOL token price is expected to break out of this long-term consolidation. Here, we delve into five key indicators that suggest Solana may soon reach new highs, solidifying its position among the top blockchain networks.
5 Key Indicators Suggest Solana Price May Hit New All-Time Highs
With Bitcoin surging above $70,000, the cryptocurrency market has seen a bullish resurgence in late October. The Altcoin market is mirroring the recovery trend, and Solana price predictions have caught investors' attention as these five indicators suggest it may set new highs.
Development Activity
According to Santiment data, on October 29, Solana's development activity suddenly spiked to 140. Typically, active development indicates that the ecosystem is maturing through continuous innovation, which is crucial for maintaining its leading position in the emerging cryptocurrency market. High development activity often boosts investor confidence, which can be a positive for its native cryptocurrency.
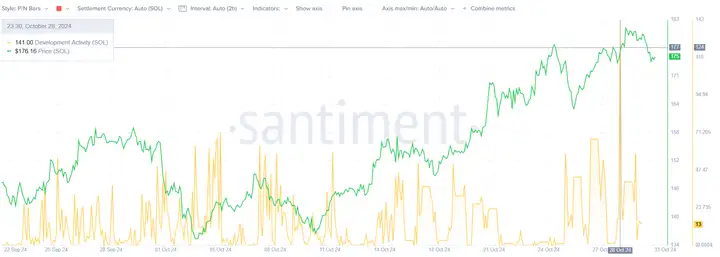
Development Activity | Sentiment
Social Dominance
Since last week, SOL's social dominance has been on an upward trend, reaching a high of 9.17 on Tuesday. This metric highlights the level of attention the cryptocurrency is receiving on social media platforms like X (formerly Twitter), Reddit, and other forums. Increased social engagement typically indicates increased interest from retail and institutional investors, reflecting market demand pressure.
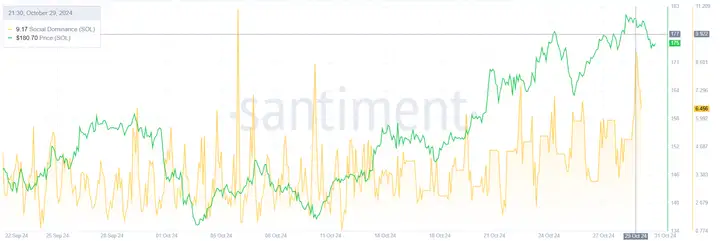
Social Dominance | Santiment
New Addresses and User Growth
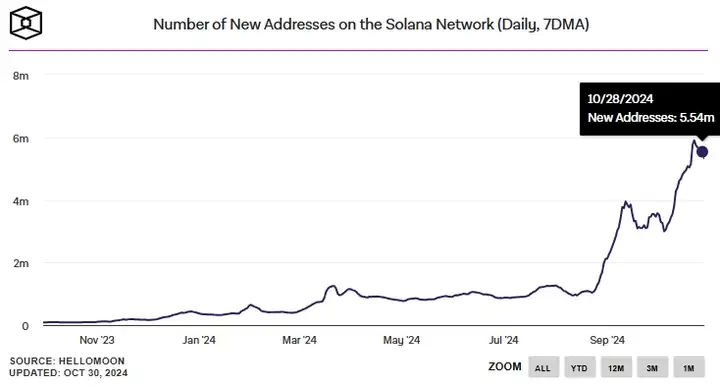
On-chain data shows that the number of new SOL addresses has increased sharply, from 2.99 million in October to 5.32 million. The influence of new users not only accelerates network growth, but also drives demand for the Solana price as new participants engage in transactions and more on-chain activities.
The growth in new addresses is considered one of the core developments of the network, as it indicates an increase in adoption.
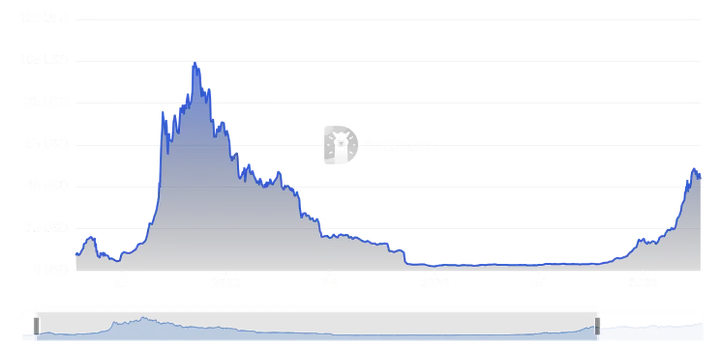
DeFi Total Value Locked (TVL)
According to defillama data, SOL's Total Value Locked (TVL) in DeFi has increased significantly from $3.8 billion to $6.25 billion, a 63% surge. This growth typically indicates growing investor confidence, as they lock more funds into the network's decentralized finance (DeFi) applications.
This metric highlights the outstanding user activity and a powerful network that is suitable for a significant reversal in SOL price.
Solana Futures Open Interest
In October, SOL's futures open interest surged from $2.14 million to $3.41 million, a 46% increase. The significant increase in open interest suggests that investors are actively speculating on Solana's future price movements, reflecting increased participation and confidence in its market potential.
Overall, the support from the growing OI data indicates that Solana's price recovery is sustainable, which will support the asset in setting a new ATH.

SOL Futures Open Interest | Coinglass
Price Analysis: Is SOL Facing Rejection or Breakout?
On the daily chart, after breaking above the $161 volatility high of September, the market structure has turned bullish. In the second half of October, the A/D indicator has been steadily rising, indicating an increase in buying pressure.
The MACD on the daily chart also reflects the bullish momentum. It has not yet issued an overbought signal, nor does it suggest the token may see a pullback.
However, the possibility of rejection at the $190-$200 range is high due to the range formation and liquidity factors.
Generally, it is best to trade the range as is, rather than looking for breakouts every time the extremes are retested. The July 29 surge to $194, followed by a 43.3% drop in the following week, is an example that highlights the importance of time in reclaiming the range highs as support.
The Northern Magnetic Zone Attracts Price
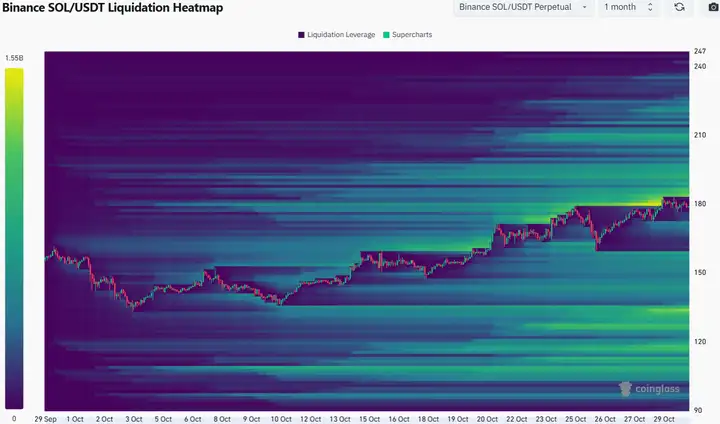
The liquidation heatmap with a one-month lookback period shows a considerable amount of liquidation levels in the $184-$196 area. Solana's price is likely to be attracted to this zone before a bearish reversal.
This reversal is not a certainty, especially with BTC [BTC] nearing its all-time high and the bullish sentiment increasing. However, traders should be prepared for both scenarios.
A breakout above $195 and a retest of $190 may provide a buying opportunity in the coming days.
Conclusion
Solana's price outlook has a bullish market structure, thanks to strong network activity, rising DeFi Total Value Locked (TVL), an active developer community, growing institutional interest, and positive market sentiment. These indicators collectively suggest that SOL may set a new all-time high.


