The price of Bitcoin (BTC) has recently shown signs of changing sentiment after approaching an all-time high. The DMI indicates that the upward momentum of BTC has weakened, suggesting a slight retreat in buying intensity.
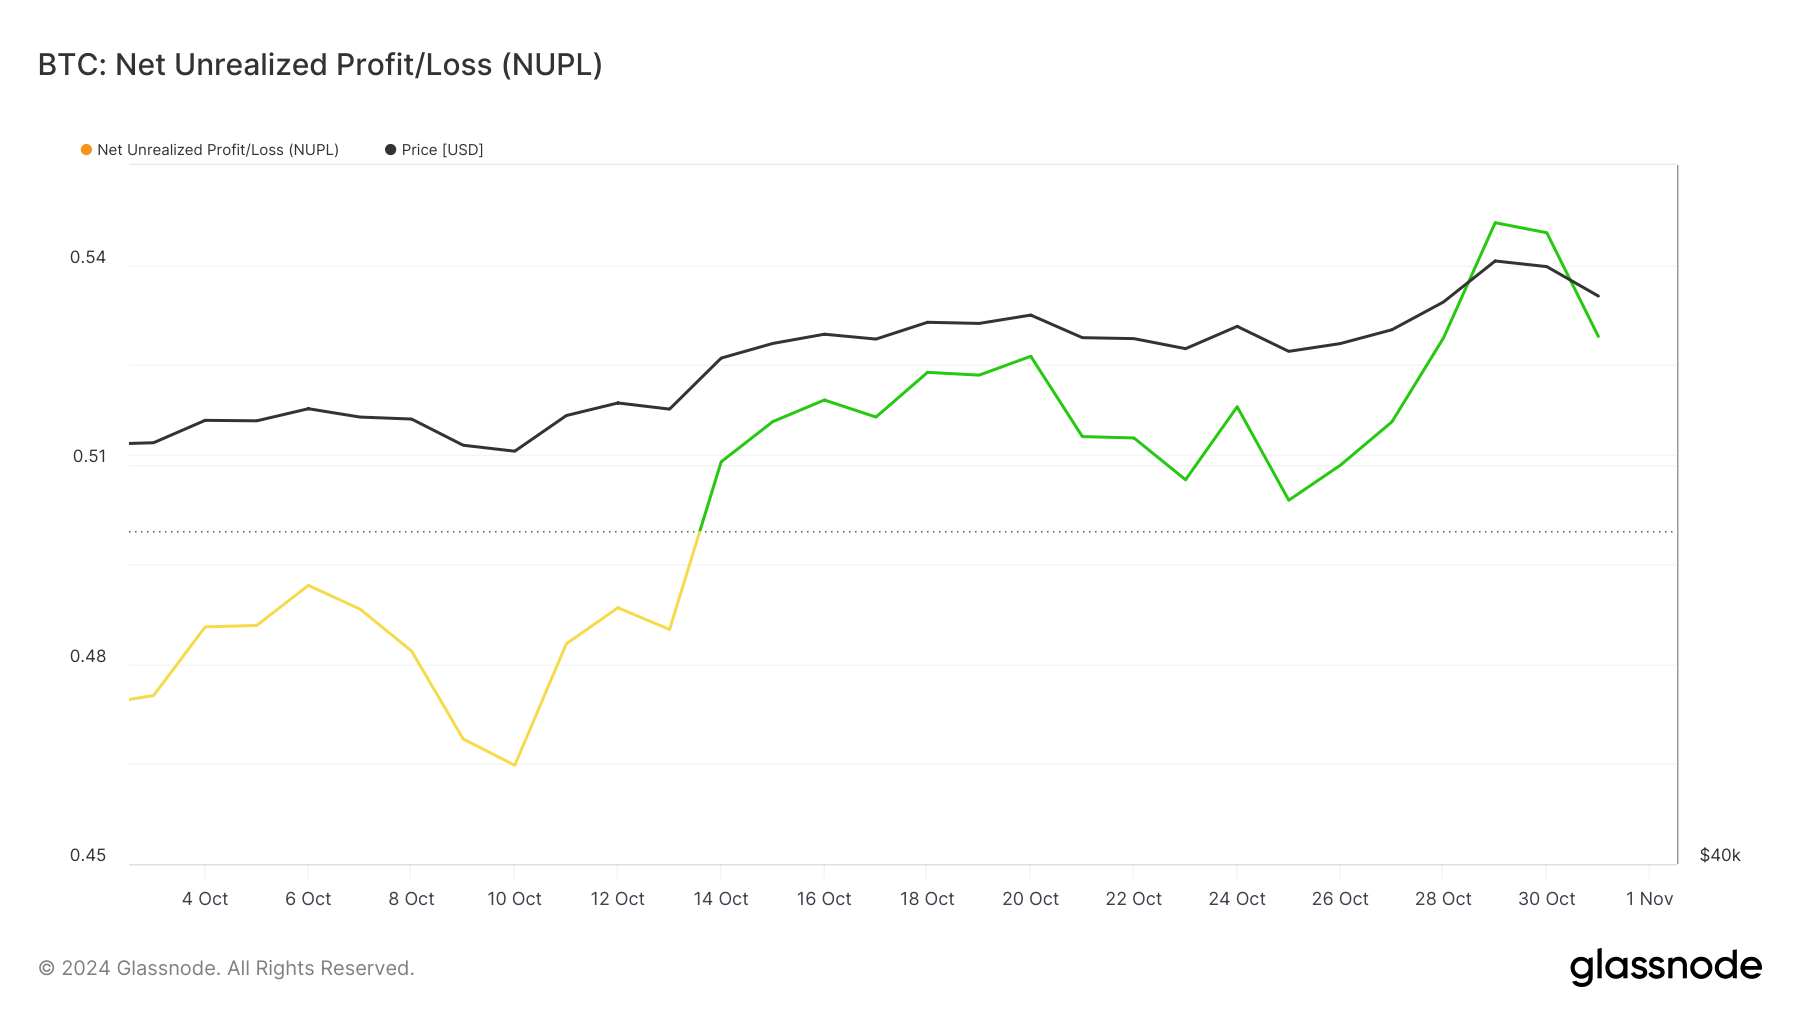
Similarly, the NUPL is in a positive phase, but it reveals a more cautious outlook among holders compared to the euphoric levels seen in past cycles. The BTC price chart, along with these indicators, suggests that there may be a consolidation or a minor correction before a move to new highs.
BTC DMI Shows Recent Shift in Sentiment
The BTC DMI chart shows that the current ADX is at 29.26, down from 40 days ago. ADX measures the strength of a trend, not the direction. An ADX above 25 indicates a strong trend, while below 20 indicates a weak or non-existent trend. The drop in ADX from above 40 suggests that the recent uptrend in BTC has weakened.
Read more: The 7 Best Cryptocurrency Exchanges in the USA

The DMI uses two lines, D+ and D-, to indicate the direction of the trend. Currently, BTC's D+ is at 20.6, and D- is at 24.5, suggesting that sellers are temporarily stronger than buyers.
However, a few days ago, BTC was in a stronger uptrend, with D+ above 40 and D- around 10, indicating that buying pressure significantly outweighed selling. Technically, the rising price of Bitcoin has seen a slight shift in the balance between buying and selling, with D- now higher than D+.
Bitcoin NUPL Distant from Euphoric Levels
BTC's NUPL currently stands at 0.529, slightly lower than the 0.546 level reached a few days ago. This decline reflects a slight decrease in unrealized gains among holders, indicating either recent profit-taking or a temporary pause in overall market optimism.
Despite the decrease, BTC's NUPL remains positive, meaning that most holders are still in profit, but it is approaching a more cautious sentiment.

NUPL, or Net Unrealized Profit/Loss, is an indicator that calculates the difference between unrealized gains and losses among holders, reflecting the general market sentiment.
While BTC's NUPL has decreased, it remains in the belief-disbelief phase and is currently much lower than the euphoric-greed levels that have historically occurred.
BTC Price Outlook: Larger Correction Before New Highs?
The BTC price chart shows that the short-term EMA line is above the long-term EMA, indicating an uptrend. This alignment suggests that recent momentum is stronger than the long-term trend, often a sign of increased buying interest and positive sentiment, potentially signaling further upside.
Read more: Bitcoin (BTC) Price Prediction 2024/2025/2030

However, the narrowing gap between the EMAs suggests that the upward momentum has slowed down in recent days. If the uptrend regains strength, BTC could target a new high above $73,618. Conversely, BTC may first test support at $65,503, and if this level is not maintained, it could drop 11.4% to $62,043.


