BNB is working hard to break through and stabilize above $600. If successful and the price consolidates the gains, it may target a new rally above $605.More information Crypto团子

BNB: Sentiment Complex and Cautiously Optimistic
BNB's technical data shows a cautiously optimistic market sentiment. The Relative Strength Index (RSI) has been holding around 60, indicating a balanced market sentiment without significant buying or selling pressure.
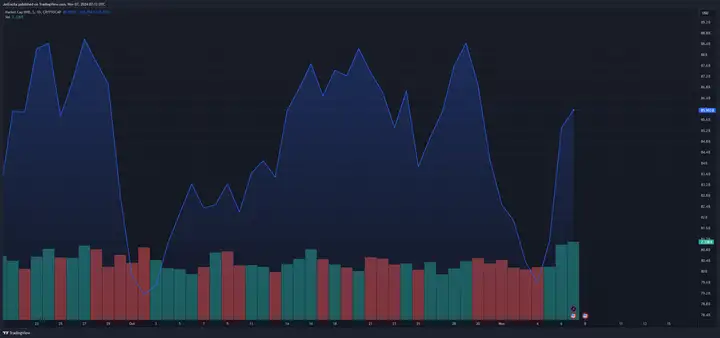
This neutrality itself suggests the market is not overheated, so BNB may see a significant upside without a clear, pronounced trend. Another very important indicator to monitor is the Chaikin Oscillator, currently at -35K. This indicates almost no buying accumulation.
At the same time, the lack of capital inflow due to the unchanged market sentiment may be a factor limiting further BNB price appreciation.
BNB's trading volume has increased by 31% in 24 hours, so market activity and interest are on the rise. Investor interest can be observed through the trading volume to market cap ratio, currently at 2.46%, and based on this growth, but the test is whether the interest supports the price increase.

Short-term Pressure and Trading Volatility
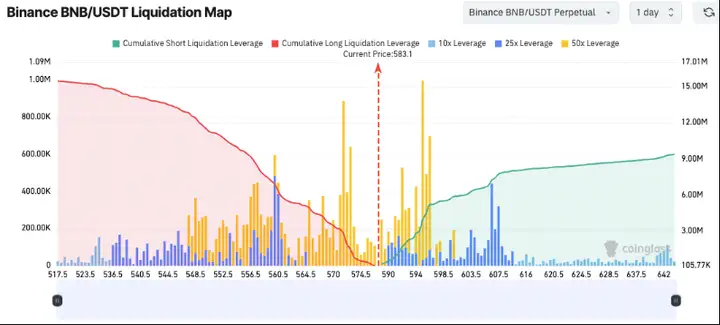
BNB's liquidation chart shows concentrated areas that may threaten price stability in the short term. If BNB exceeds $590, there is a possibility of price volatility; short positions are highly concentrated at the $583 level.
This could drive up these short positions, subsequently triggering a domino effect that may push the price higher. When the price drops below $570, long liquidations will be triggered. This means that if the BNB price declines, the selling may accelerate as positions near their end.

These levels are key points that short-term traders should focus on. Based on market behavior, price fluctuations around these levels may bring both risks and opportunities.
BNB Price Finds Support
After closing above $585, the BNB price has continued its upward trend. However, unlike Ethereum and Bitcoin, BNB's upside potential above $610 is limited, and the price remains constrained.
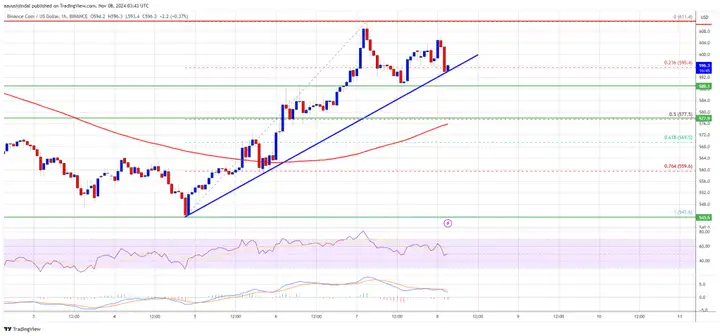
The price has dropped below the $605 and $600 levels. It even fell below the 23.6% Fibonacci retracement level from the low of $543 to the high of $611. But the price has now warmed up and is retesting the $600 level.
The price is currently trading above $598 and the 100-hour simple moving average, and a bullish trend line has formed on the hourly chart, with support at $595.

If a new uptrend emerges, the price may face resistance around $605. The next resistance level is near $612. If the $612 area is convincingly breached, the price may rise further. In this case, the BNB price may test $620. If the closing price is above the $620 resistance, it may lay the foundation for a move towards the $632 resistance level. If the uptrend continues, the $650 level may need to be tested in the short term.
Long-term Outlook
Forecasts show that BNB may rise 60% in the next three months and 30% in the following six months, indicating an overall optimistic outlook for BNB (although caution is still important). Additionally, the 53% expected growth rate suggests a strong 12-month forecast, which is good news for investors.
BNB's recent token burn activity - resulting in an estimated 1.77 million tokens (worth around $1 billion) being destroyed - is a major driver of this positive sentiment.
For long-term investors, reducing the supply is crucial for price stability and BNB's growth. Each burn increases the value of the remaining tokens, but the volatile market makes it uncertain how these dynamics will play out.


