BONK price today has shown a high level of bullish sentiment, with technical indicators showing a 14.8% increase. The Elliott wave pattern and potential breakout targets are positive signs for further price increases.
If you want to learn more about the crypto world and get the latest newsWeibo Dolphin Dolphin1More great articles await you~
BONK Price Chart Analysis
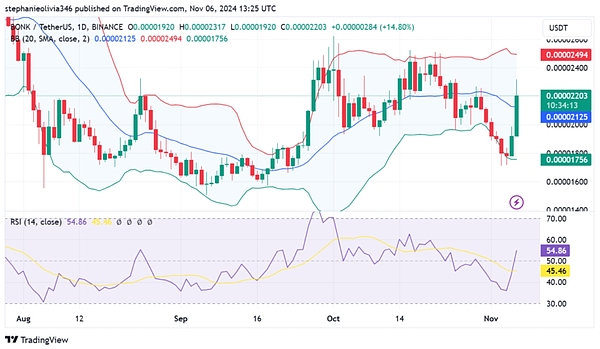
The current trading price of BONK is $0.00002203, indicating the emergence of a new bullish trend. The meme coin is currently above the 20-day simple moving average, suggesting a bullish outlook in the short term. If this trend continues, the SMA will act as a support level, ensuring the upward trend of BONK remains intact.
The current resistance is above the Bollinger Bands, currently at $0.00002494, which may provide short-term resistance before the bulls take control of the market. A breakout above this level would signal further bullish momentum, potentially attracting more investors.
Bollinger Bands Indicate Increased BONK Price Volatility
The current price of $0.00002203 has BONK approaching the upper Bollinger Band, and if the price fails to break through the upper Bollinger Band at $0.00002494, it may act as a resistance level.
However, if the price pulls back, the middle band at $0.0002125 may serve as a key support level for the bulls to temporarily retreat to.
If BONK experiences a more significant decline within the recent price range, the lower Bollinger Band at $0.00001756 would be a stronger support level. These swings indicate that while the current trend is bullish, traders should look for breakouts or consolidation around these levels.
RSI Suggests Moderate Bullish Momentum
The Relative Strength Index (RSI) is at 54.86, indicating moderate buying pressure, but it has not yet broken into overbought territory (above 70).

The RSI remains within the range, suggesting there is more upside potential, and there are no signs of a reversal in the short term. Furthermore, if the RSI indicator continues to rise to 60 or above, it will provide a solid and positive signal for the bulls of BONK.
BONK Price: Potential for a Bullish Wave
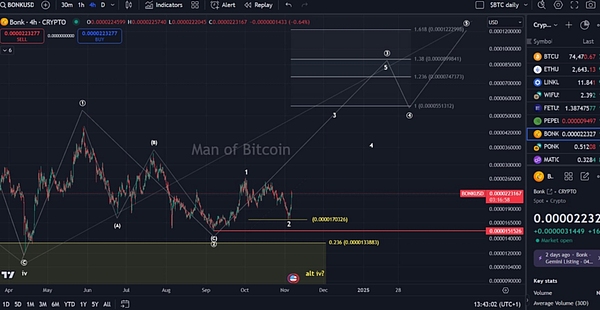
BONK may be experiencing an early bullish Elliott wave, and it may have bottomed in the second wave.
However, if there is a more significant breakout above $0.0000262, it would indicate the start of the third wave, which is crucial for a stronger bullish trend. Any breakout above this level would lead to a more robust bullish trend, attracting more buying pressure.

The target for wave 3 is $0.0000899, which is the 1.618 Fibonacci extension level suggested by the Elliott wave trading theory, where there is a typical resistance level.
Overall Market Conditions
The meme coin's trading price has declined 15% to $0.0000174, followed by a 32.2% rebound, which may indicate the presence of bullish pressure.
A daily close above $0.0000227 would be a key level to break the current bearish market structure of BONK and confirm a trend reversal.
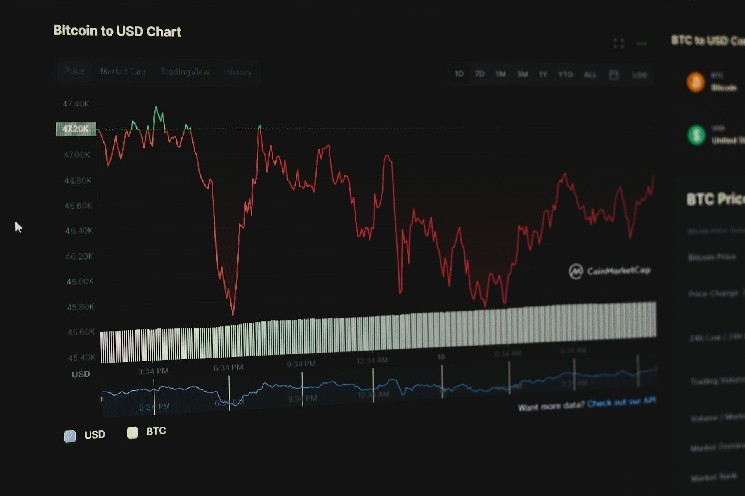
The continued rise of Bitcoin may have a positive impact on the recovery of BONK, strengthening the buying pressure. If Bitcoin continues to rise, it will provide more bullish prospects for BONK and other cryptocurrencies.
That's the end of the article, followWeibo Dolphin Dolphin1for more great articles~If you want to learn more about the crypto world and get the latest news, feel free to consult me, we have the most professional exchange community, publishing daily market analysis and recommended potential coins. No threshold to join the group, welcome everyone to discuss together!


