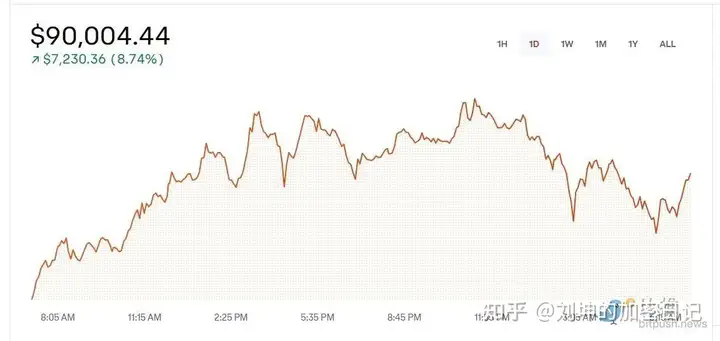
Bitcoin broke through $90,000 on November 12, setting a new all-time high once again.
According to TradingView data, at 12:56 Pacific Standard Time on November 12, Bitcoin surged above $90,000 on Coinbase, up 11% over the past day, just one step away from entering the 100,000s.

It is worth noting that on the Coinbase platform, the trading price of Bitcoin is often slightly higher than other platforms, which is called "premium trading". This means that even though the overall market price of Bitcoin is already very high, there are still a large number of buyers willing to buy at a higher price on Coinbase, further demonstrating the strong market demand for Bitcoin.
As of the time of writing, the Bitcoin trading price has fallen back to $88,223, up 0.4% in the last 24 hours.
Altcoins have seen mixed performance, with Bonk (BONK) seeing the largest gain of 27.7% among the top 200 Altcoins, AIOZ Network (AIOZ) up 23.2%, and Akash Network up 18.8%. EigenLayer (EIGEN) led the decline, down 12.8%, followed by DOGS (DOGS) and Artificial Super Alliance (FET), down 11.6% and 11.5% respectively.
The current total cryptocurrency market capitalization is $2.98 trillion, with Bitcoin's market share at 59.5%.
CoinGlass data shows that over the past 24 hours, the violent price fluctuations have led to a total of nearly $940 million in crypto liquidations across the network, the largest single-day liquidation since August 5.
In the US stock market, the S&P 500 index, Dow Jones index, and Nasdaq index all closed lower, down 0.29%, 0.86%, and 0.09% respectively.
Analysts: Some indicators are worth watching
Due to the expected relaxed regulatory environment from a Republican-controlled Congress, market FOMO sentiment is high, and analysts generally believe that cryptocurrencies will continue to rise in the short term.

However, Shubh Varma, co-founder and CEO of Hyblock Capital, pointed out: "One indicator worth noting is the True Retail Longing percentage, which is unusually low at only 40%, in the 20th percentile over the past 90 days. Additionally, the Open Interest (OI) is in the 99th percentile, a dynamic that echoes the situation on November 7, when the True Retail Longing percentage was even lower, in the 12th percentile, and the OI was also very high. Historically, when OI is high and retail Longing positions are low, it often leads to short positions being squeezed, resulting in a significant price increase."
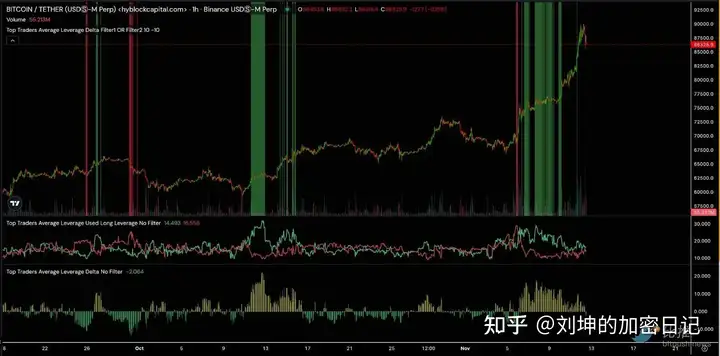
Furthermore, the leverage data in the derivatives market shows that top traders continue to favor Longing positions, with the average leverage difference between Longing and shorting positions exceeding +10 again, which is a strong bullish indicator.

The analyst explained that this leverage pattern typically appears after a price decline, but this time it has appeared after a significant price increase. If the Longing leverage continues to increase after the recent BTC surge, this divergence may indicate a persistent bullish trend.
Varma suggests using pullbacks as buying opportunities and believes that given the strength of this rebound, buying on dips may provide favorable entry points. However, he warns traders to closely monitor indicators such as retail Longing positions and leverage imbalances, as these can help investors assess market risks and potential turning points. Additionally, other factors such as fundamentals and policies should also be comprehensively considered.


