The price of the major meme coin Dogecoin (DOGE) has recently surged. Last week, it rose 111% and is currently trading at $0.40, the highest level in 3 years.
However, according to technical indicators, the uptrend is slowing down and a correction may be imminent.
DOGE in overbought state...Correction concerns arise
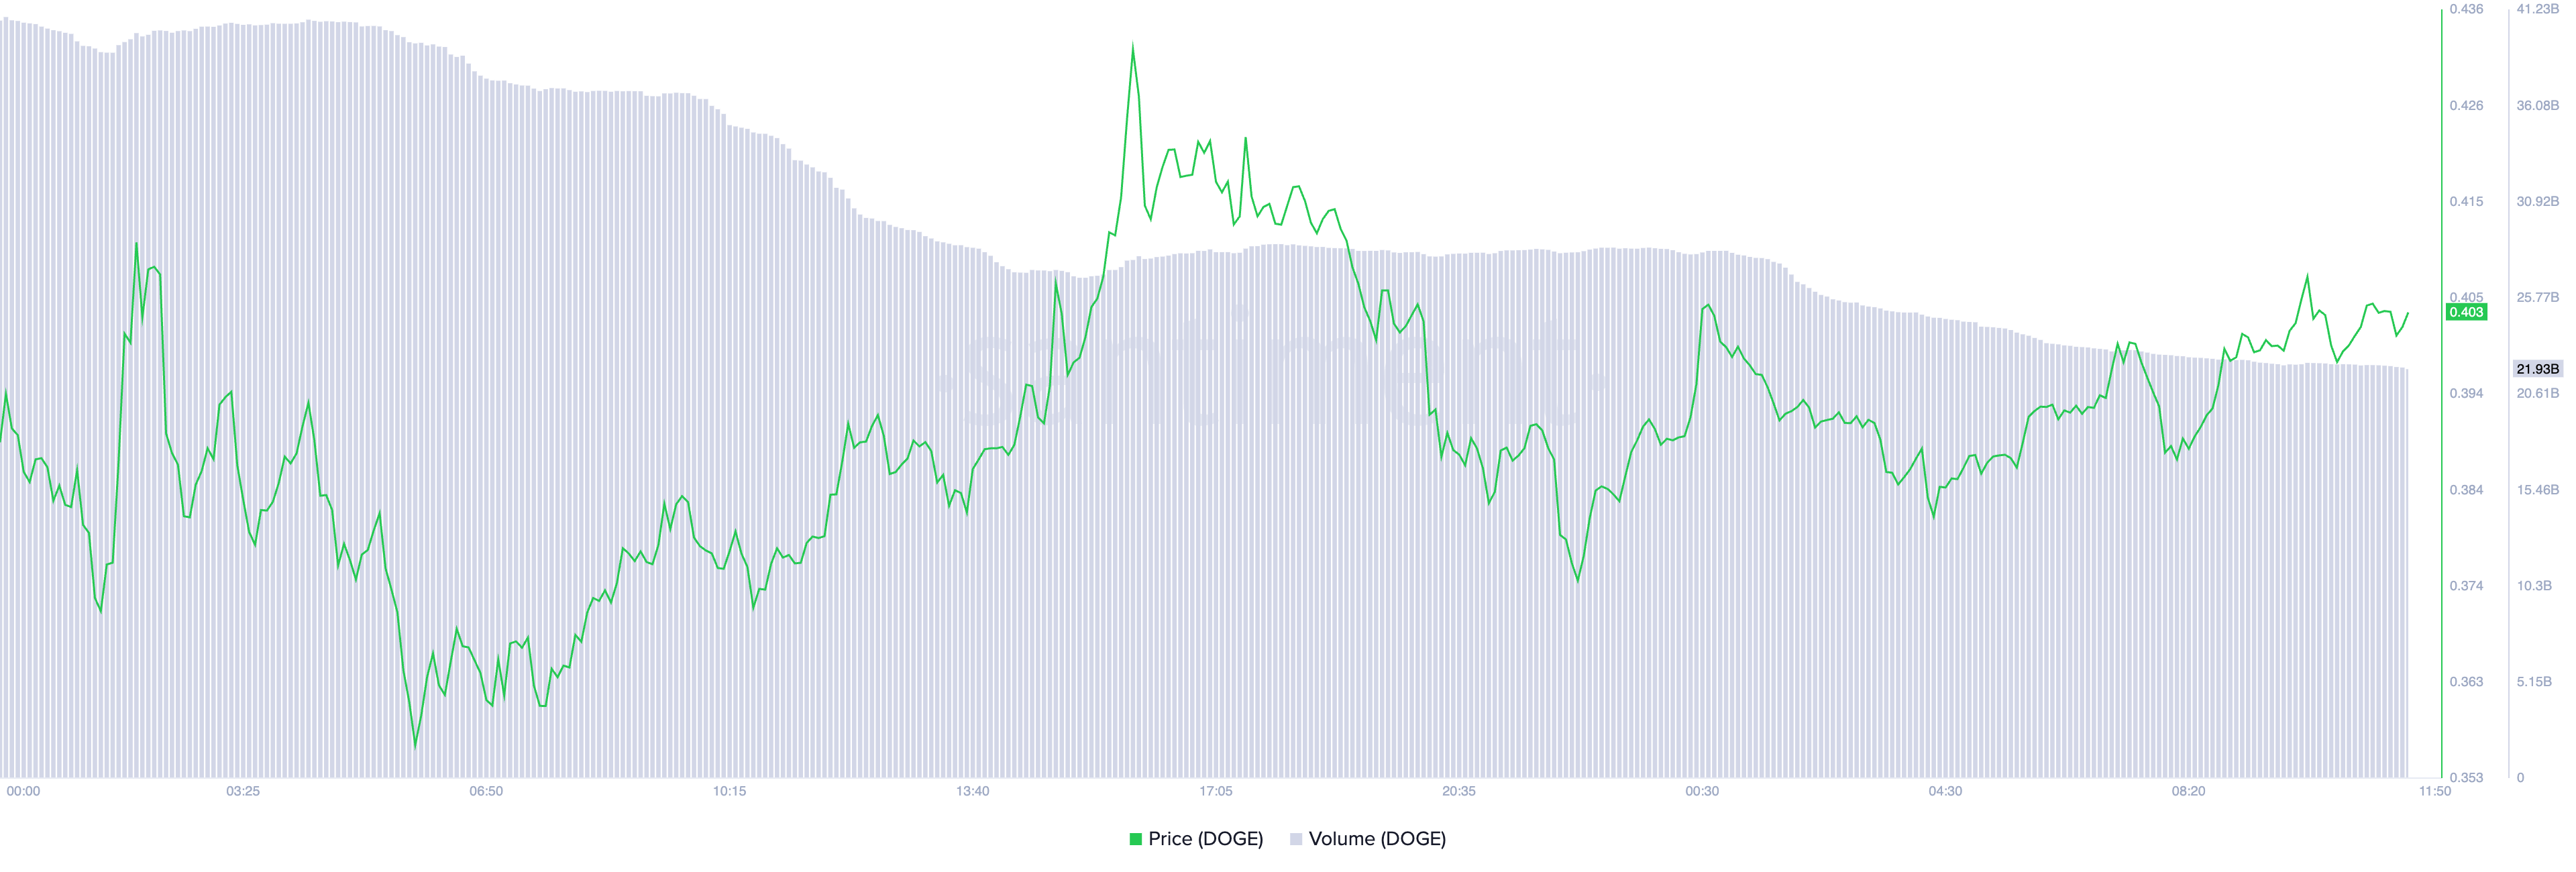
Dogecoin's price has risen 7% in the last 24 hours. However, trading Volume has decreased by 33% over the same period, confirming that the selling pressure on the meme coin is gradually increasing.
When the price of an asset rises while Volume decreases, it indicates that the upward momentum is weakening. Low Volume during a price increase means that fewer investors are actively buying at higher prices, which is a bearish signal indicating decreased demand.

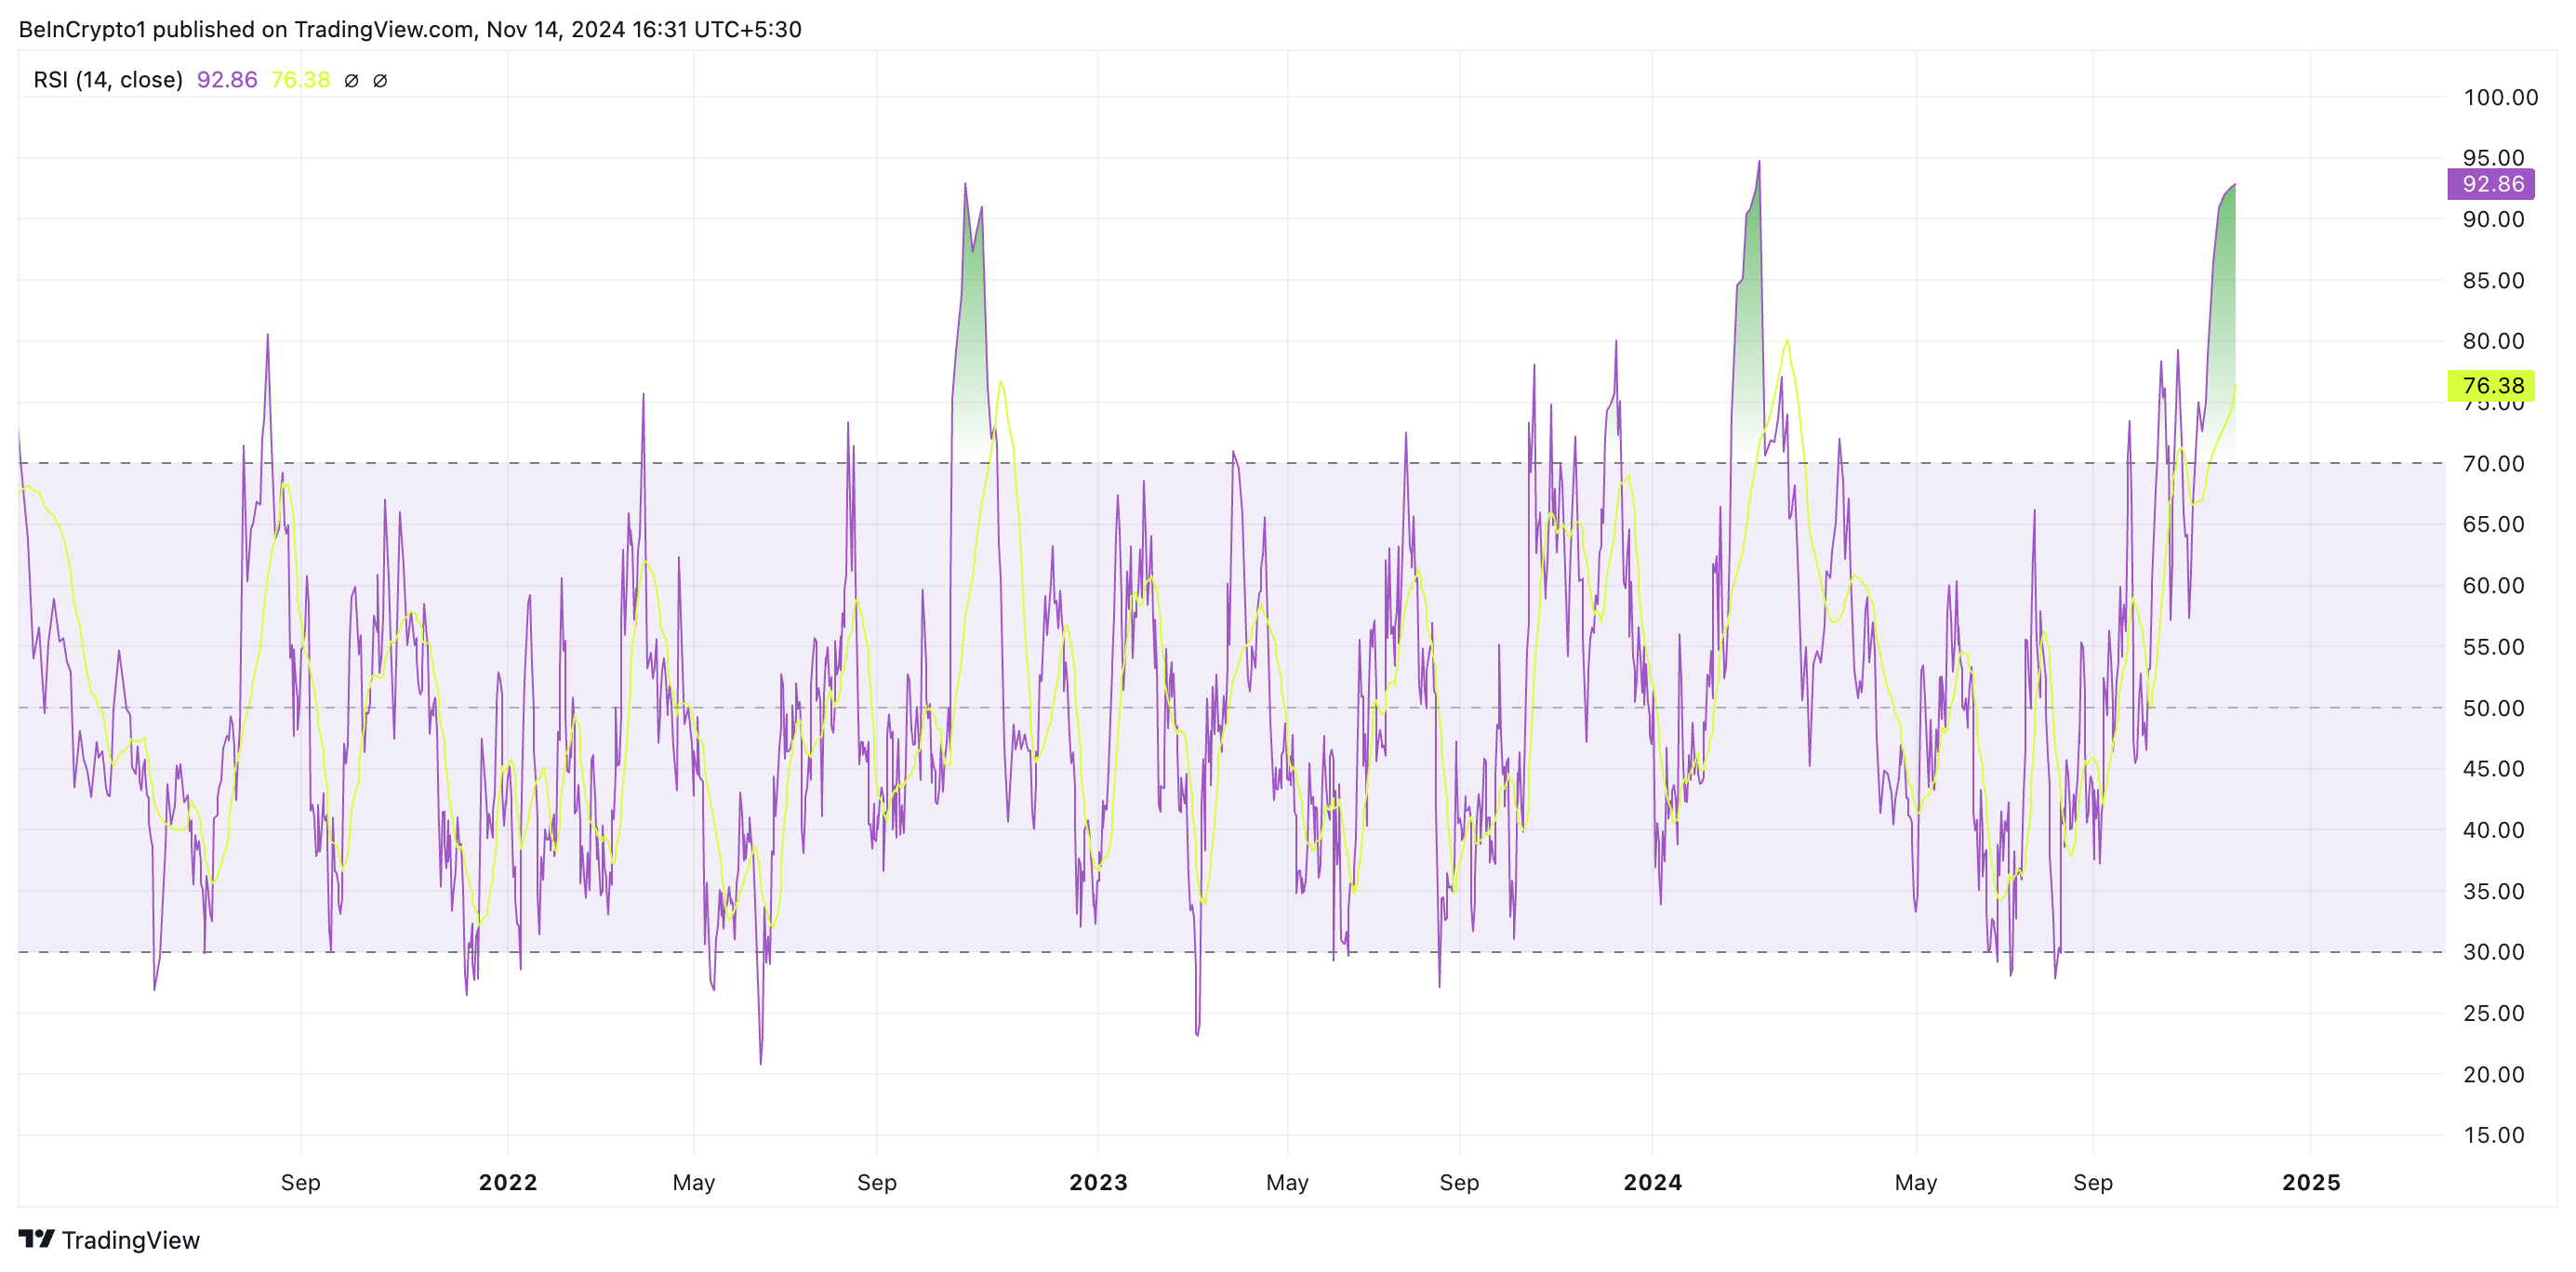
The DOGE/USD daily chart shows that the altcoin is in an overbought state and a correction is needed. The Relative Strength Index (RSI) is the first to indicate this. The current indicator value is 92.86, the highest since March.
The RSI measures the overbought and oversold market conditions of an asset, ranging from 0 to 100. Values above 70 indicate that the asset is overbought and a correction is needed. Conversely, values below 30 suggest the asset is oversold and a rebound may occur.

Dogecoin's RSI value of 92.86 indicates a significantly overbought state, and a price correction is inevitable in the near future.
May drop to $0.30
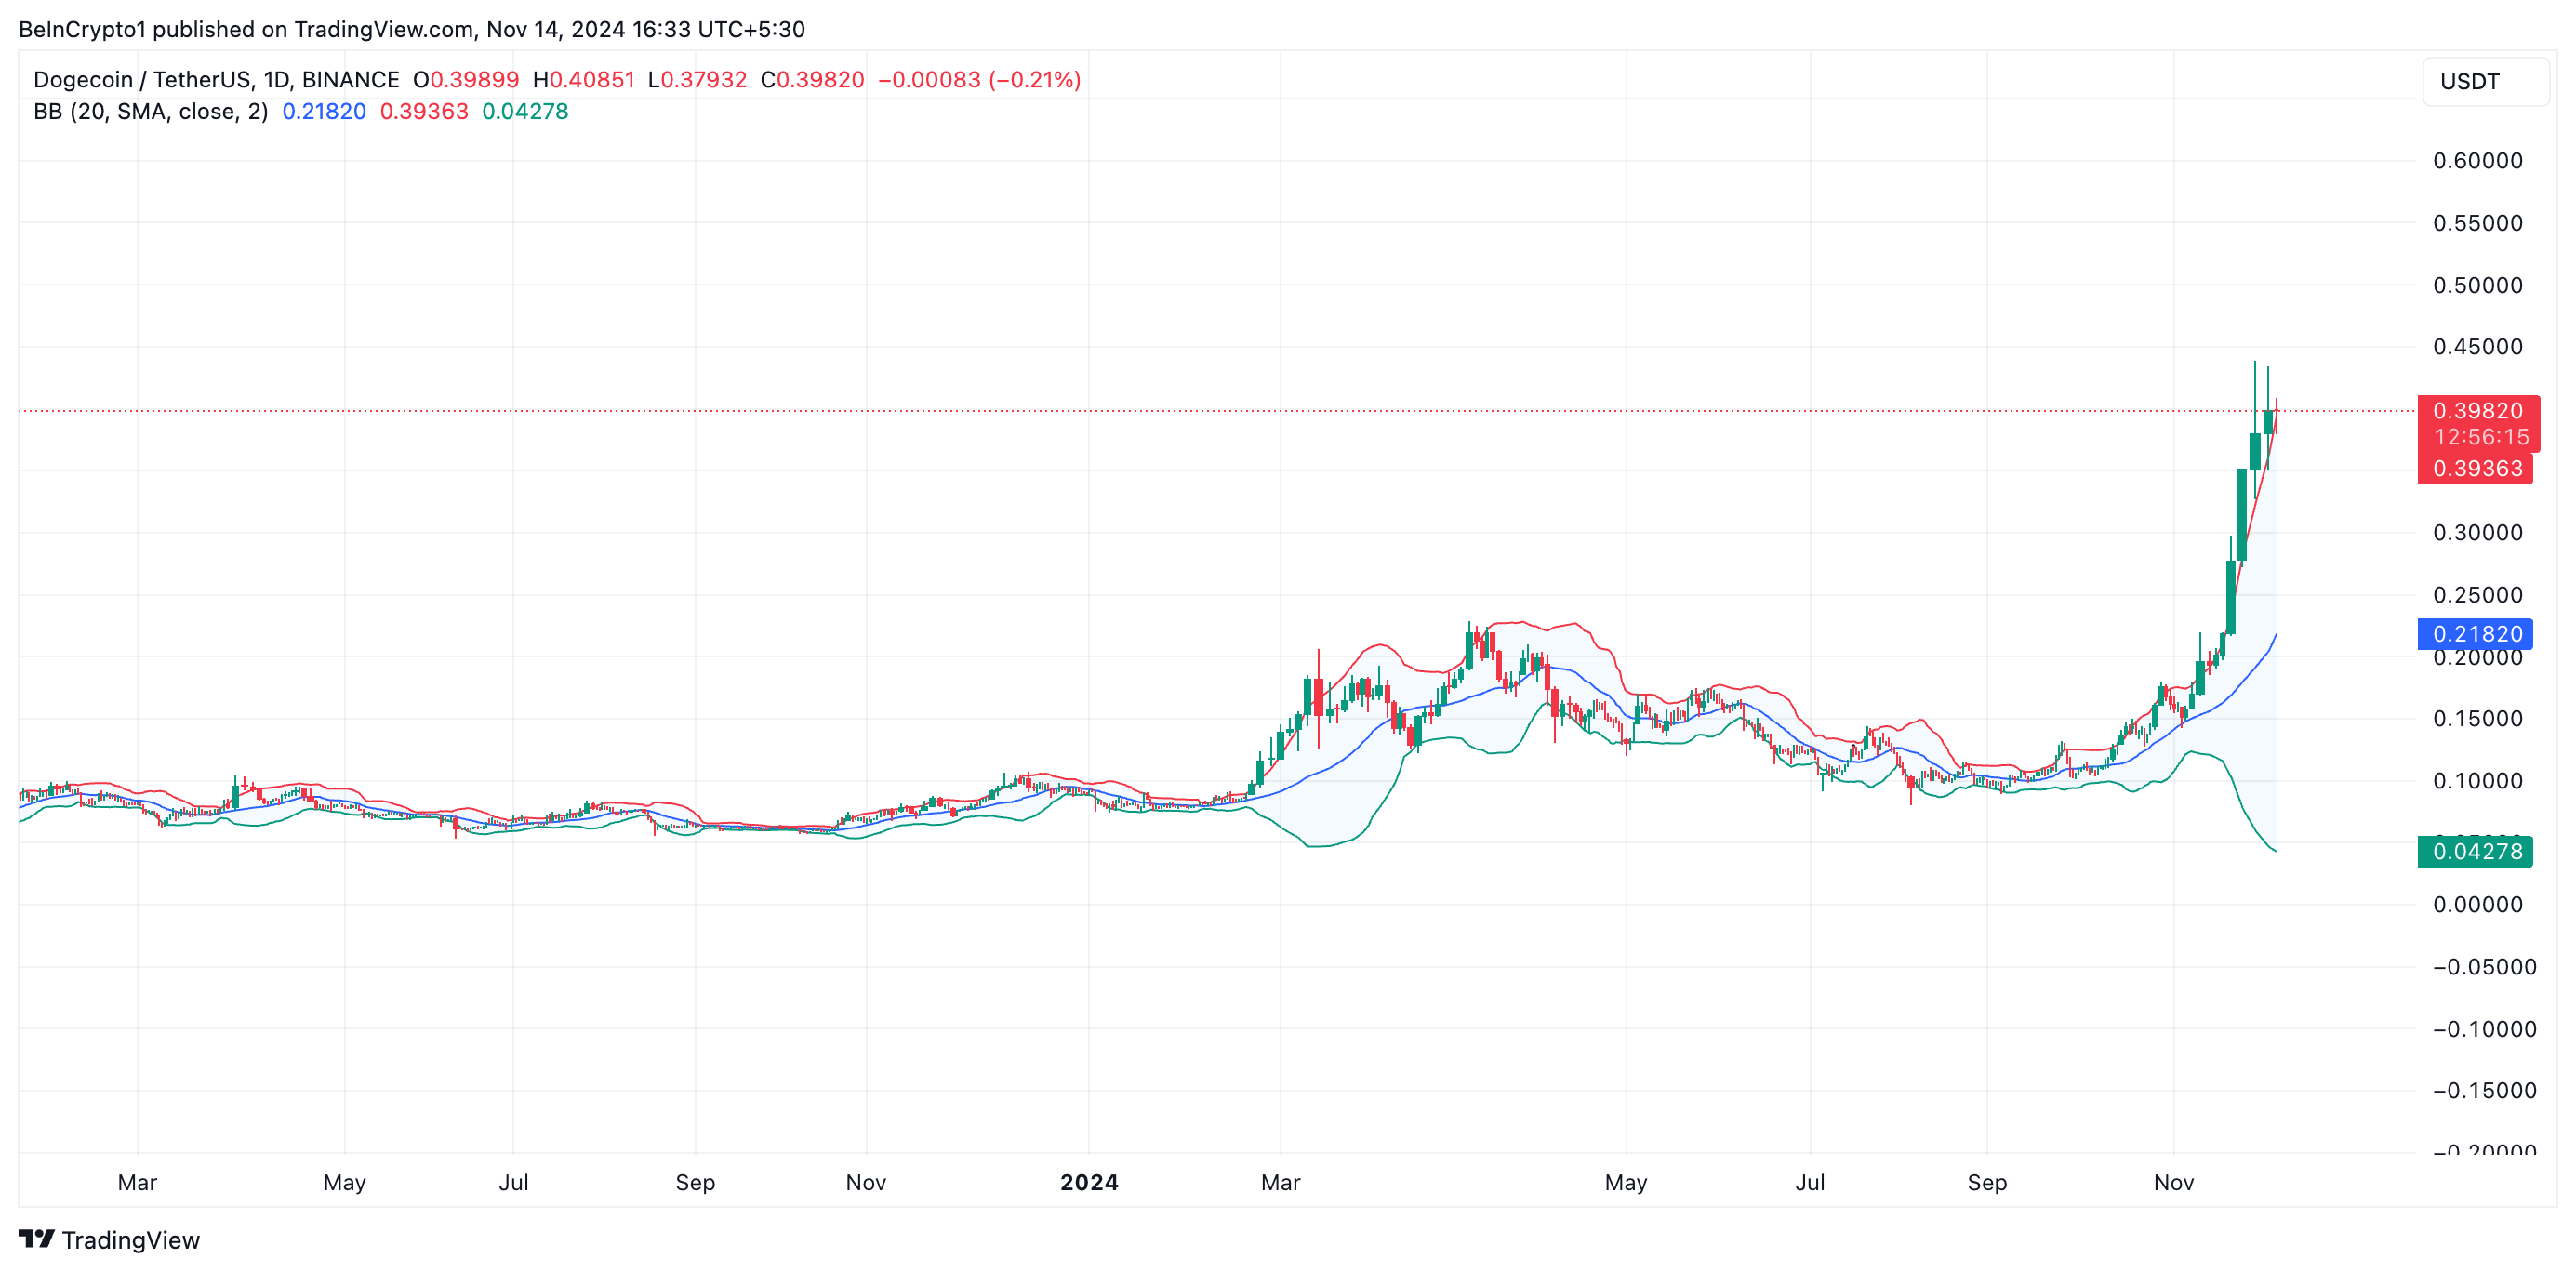
Currently, Dogecoin's price is above the upper Bollinger Band, confirming the possibility of a short-term price reversal.

The Bollinger Bands indicator measures market volatility and identifies potential buy and sell signals. It consists of three main components: the middle band, the upper band, and the lower band.
When the asset price exceeds the upper band, it indicates that the asset is overbought and excessively extended. Traders interpret this as a possibility of downward pressure and consider it an opportunity to lock in profits by selling.
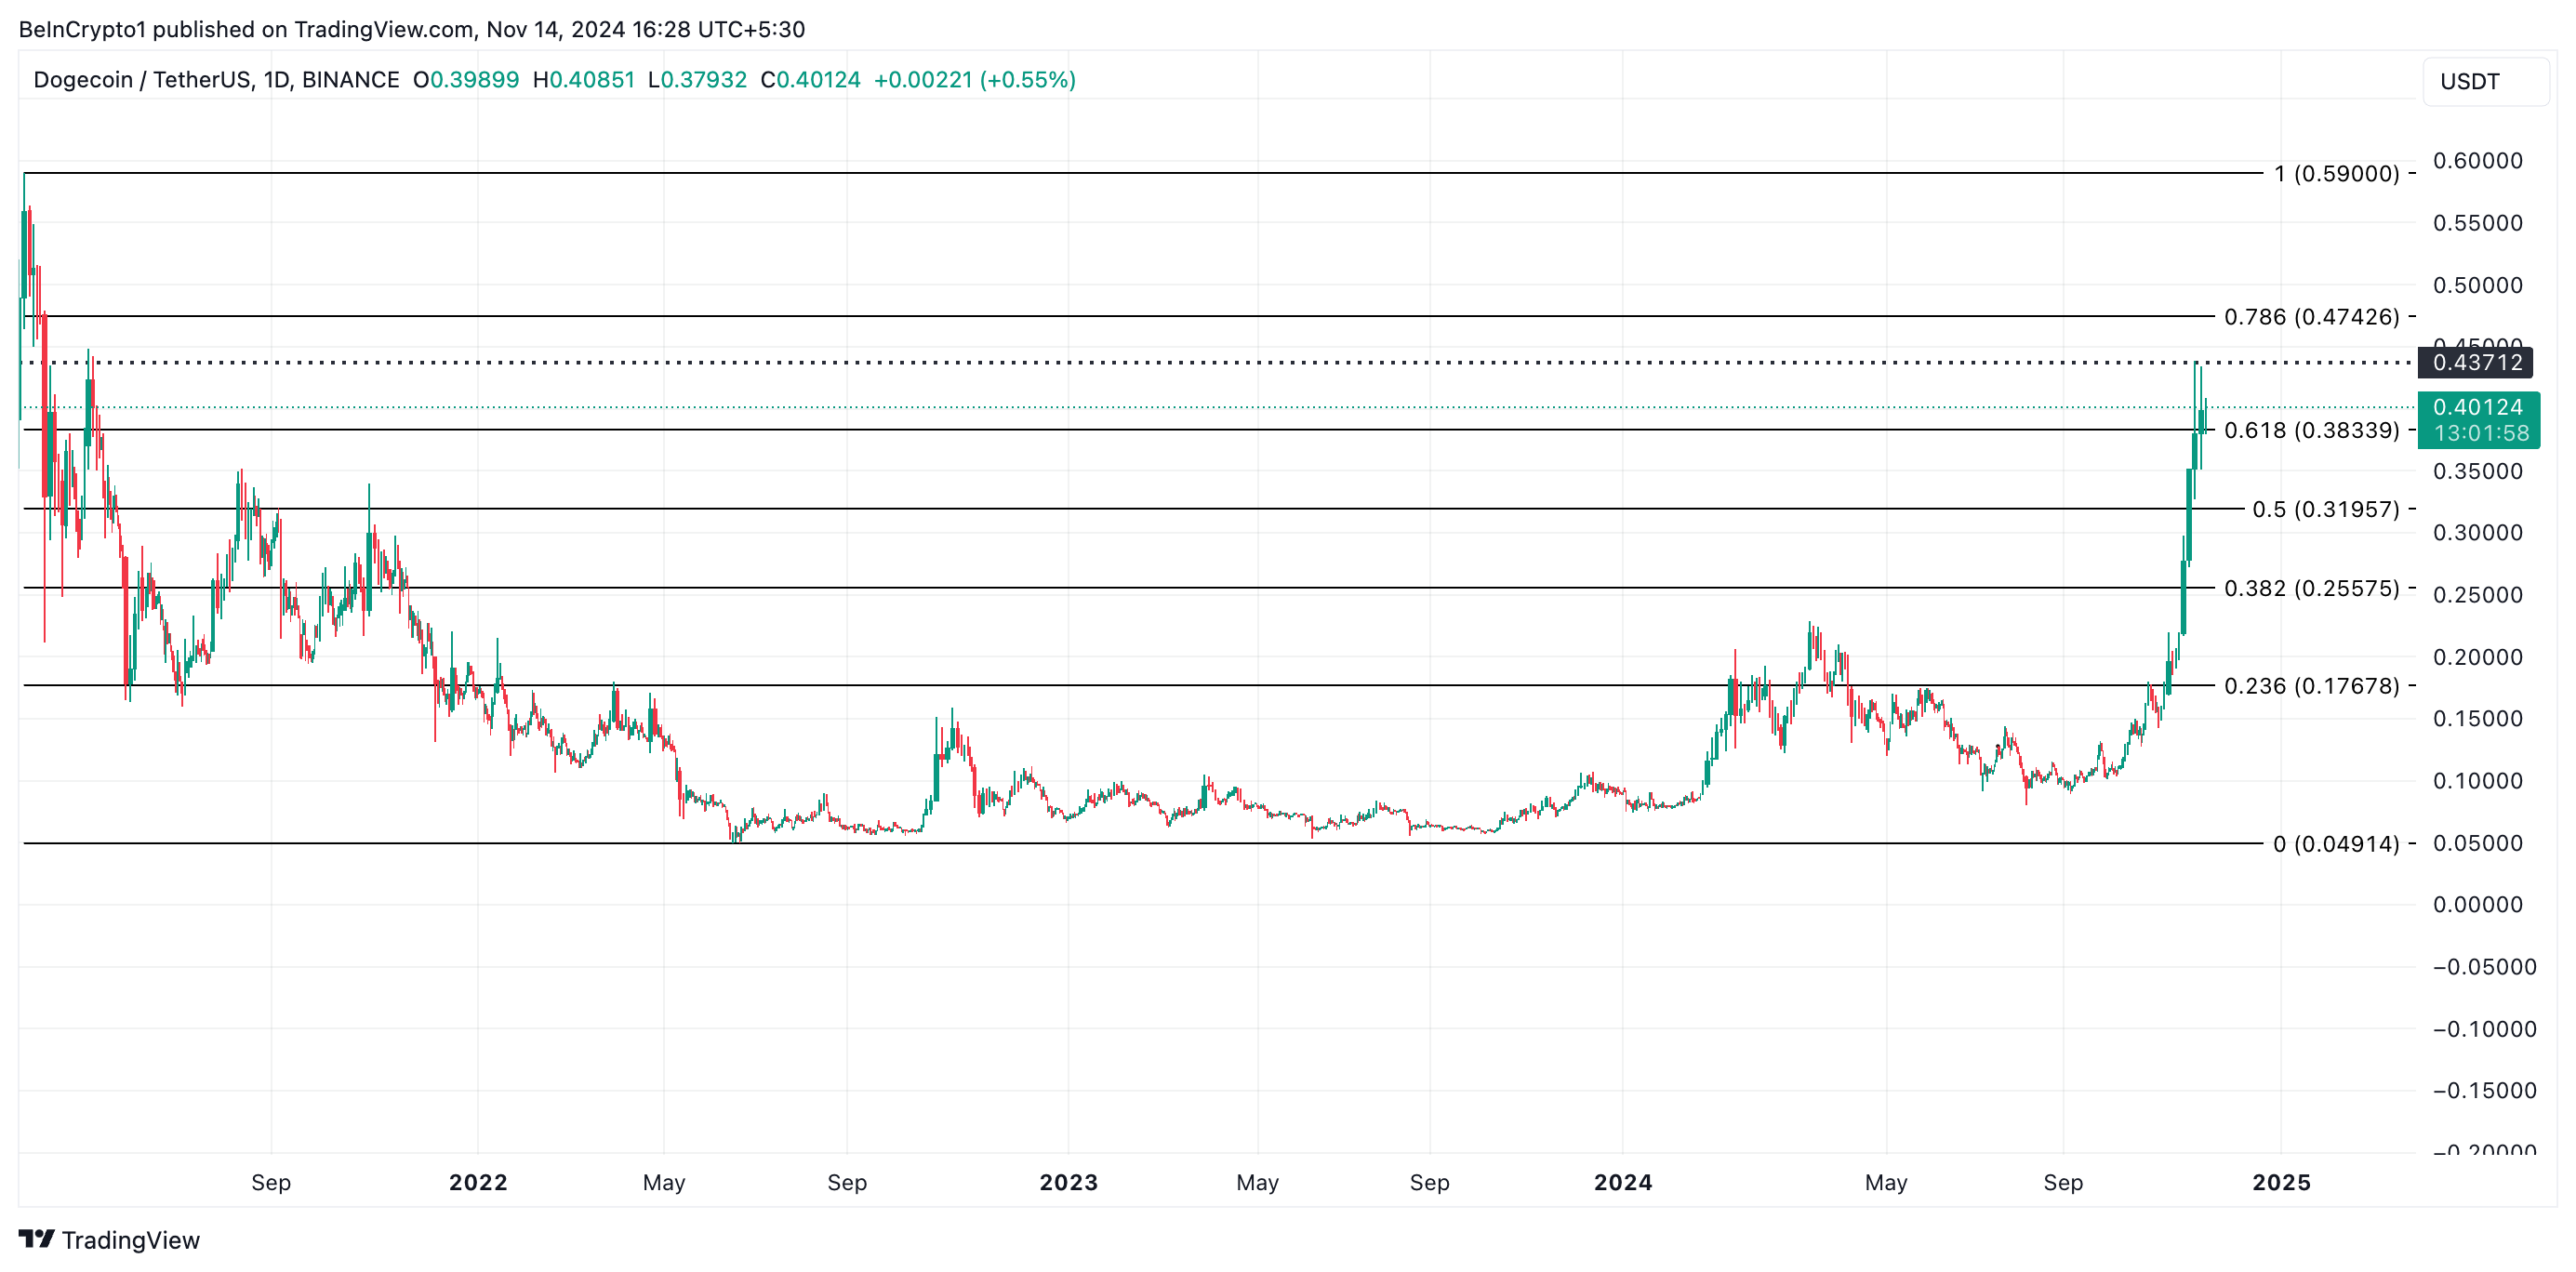
Dogecoin is currently trading at $0.40. If the price correction begins, Dogecoin may find support around $0.38. However, if buying pressure is weak and the bulls fail to defend this line, the coin price could plummet sharply to $0.31.
If additional selling occurs at this point, the price could further decline to $0.25.

If demand strengthens, the Dogecoin price uptrend could reach its previous high of $0.43 during this rally cycle, and potentially move towards $0.47 for the first time since May 2021.


