In the coming days, Bitcoin traders will seek to create new BTC price records - if a large-scale "fear of missing out" (FOMO) sentiment begins, can the market avoid a significant correction?
Bitcoin has started a new week, just one step away from a new all-time high, and has set the highest weekly closing price ever.
- Bitcoin traders expect price discovery to return this week, while viewing $80,000 as an "buy the dip" opportunity.
- This week's closing price has set another new record, but the BTC price trend in November 2024 is still within expectations.
- The market is divided on how the Federal Reserve will address the "stagflation" issue.
- Although the $93,500 all-time high last week triggered a short-term reaction, whales are still buying BTC, and ETF inflows remain high.
- Meanwhile, the crypto market sentiment indicator shows increasingly overbought signs, with the "extreme greed" level reaching a typical market top area.
Traders prepare for BTC price fluctuations towards $100,000
After the record-breaking weekly close, Bitcoin has only seen a slight decline, with the bears forced to capitulate.
Data shows that as of the first Wall Street open this week, BTC/USD is holding above $90,000, with a 30% monthly gain. This data is from Cointelegraph Markets Pro and TradingView.
"Currently, the regular Monday buying pressure has driven the price higher," trader Skew said in his latest post on the X platform.
Skew noted that within the four-hour timeframe, the price is holding above the 21-week exponential moving average (EMA), and highlighted two key levels this week: $90,000 and $91,300.
"If the price can quickly reach $95,000-$96,000 this week, that would be great," another trader CrypNuevo said in a weekend X post.
CrypNuevo predicted that a large number of traders may choose to liquidate newcomers near the $100,000 price, leading to increased market volatility before this important psychological level.
"The main liquidation levels are above, but there is also a possibility of a quick spike to near $100,000 without actually reaching it, and then a decline," he wrote.
"Why? Because many new traders will enter the market for the first time due to FOMO, going long or spot buying, becoming easy prey."
He added that if the market shows signs of consolidation, $87,000 needs to be defended.
Others plan to "buy the dip" when BTC pulls back further. For trader Crypto Chase, the appropriate entry point is the "gap" area of the daily candle.
"We will ultimately retrace to the daily gap. In a bull market, the first gap is the buy zone. I still hold a 30% long position opened around $85,000. If it reaches $83,000, I will still buy," he told his X platform followers.
"The low gaps should remain unfilled before the market reverses or turns bearish."
BTC price weekly close sets a new record
For Bitcoin bulls, last week was undoubtedly a historic victory.
BTC/USD not only set the highest weekly close price near $90,000 for the second consecutive time, but also did not see a significant correction to test the new support.
Data from monitoring platform CoinGlass shows that Bitcoin gained 11.8% last week, with Q4 returns already exceeding 40%.
Looking at monthly performance, the BTC price performance in November 2024 is in line with the average of the past 10 years. But traders believe this situation may still change.
"Historically, this is usually the start of a 300+ day uptrend," trading account CryptoAmsterdam said on the X platform, accompanied by a comparative chart of Bitcoin bull market cycles.
Skew predicted a "series" of new weekly closing records, with BTC/USD attempting to fill the upper wick when it reached the $93,500 all-time high on November 13.
"BTC has just entered the parabolic phase of this cycle," trader and analyst Rekt Capital said, citing his own long-term BTC price analysis.
"Historically, this phase lasts about 300 days on average. And Bitcoin is currently only 12 days into the parabolic phase."
Questions about the Fed's next rate cut
This week, US macroeconomic data has been relatively calm, but future monetary policy may see divergence.
Recent data shows that inflation accelerated in October, putting the Fed in a "stagflation" (rising prices and rising unemployment) situation.
This has led to different views on whether the Fed will cut rates in December. According to the latest estimates from the CME Group FedWatch tool, the probability of a rate hike pause is 35%.
"Going into 2025, consumer expectations for lower rates are high," trading resource The Kobeissi Letter commented over the weekend.
"But now, the Fed seems to be abandoning the 'Fed pivot' expectation. While more rate cuts are coming, inflation will remain elevated."
Kobeissi pointed out that earnings data from tech giant Nvidia will be released this week, which could itself become a catalyst for volatility in risk assets. In addition, seven senior Fed officials will give speeches.
Meanwhile, unemployment data will be released on November 21, followed by the release of the Purchasing Managers' Index (PMI) and Consumer Confidence report the next day.
"The Fed's primary task has always been to avoid a situation of simultaneous rising unemployment and inflation, as in the 1970s," Kobeissi added, accompanied by a chart of the Consumer Price Index (CPI) and unemployment rate.
"Will the Fed fail to avoid stagflation once again?"
Whales continue to accumulate BTC, ETF fund flows complex
This month, the massive accumulation of Bitcoin whales and institutional investors has become an important factor supporting the bullish view.
As reported by Cointelegraph, as BTC/USD broke through historical highs and entered the price discovery phase, whale buying activity has never stopped.
On-chain analysis platform CryptoQuant's data confirms that both large whales and small whale entities are continuing to increase their BTC holdings.
In the case of US spot Bitcoin exchange-traded funds (ETFs), the trend is similar.
"Since its launch in January this year, the holdings of the Bitcoin spot ETF have increased significantly, from 629,900 BTC to 1,054,500 BTC, an increase of 425,000 BTC," MAC_D, a CryptoQuant contributor, wrote in a November 18 Quicktake blog.
"This represents an increase from 3.15% to 5.33% of the total supply (19.78 million BTC), a 2.18% increase in just eight months."
MAC_D stated that this supply-demand dynamic should drive price appreciation.
"The significant price increases in March and November demonstrate the strong correlation between accumulation and price," the article added.
"Therefore, as Bitcoin accumulation through spot ETFs increases, we can expect the price to continue an upward trend."
Net inflows of spot Bitcoin ETFs in the US (screenshot) Source: Farside Investors
Data from Farside Investors and others shows that spot ETFs are in a volatile state, with significant net outflows after a sharp net inflow last week.
Within two days as of November 15, the total net outflow exceeded $750 million, after Bitcoin had surged to a new all-time high.
The "FOMO" in the crypto market brings price warnings
Research shows that crypto social media "very reliably" marks the peak of each BTC price rally.
Related: Bitcoin breakout or black swan? $90,000 BTC price lacks the historical highs of gold and stocks
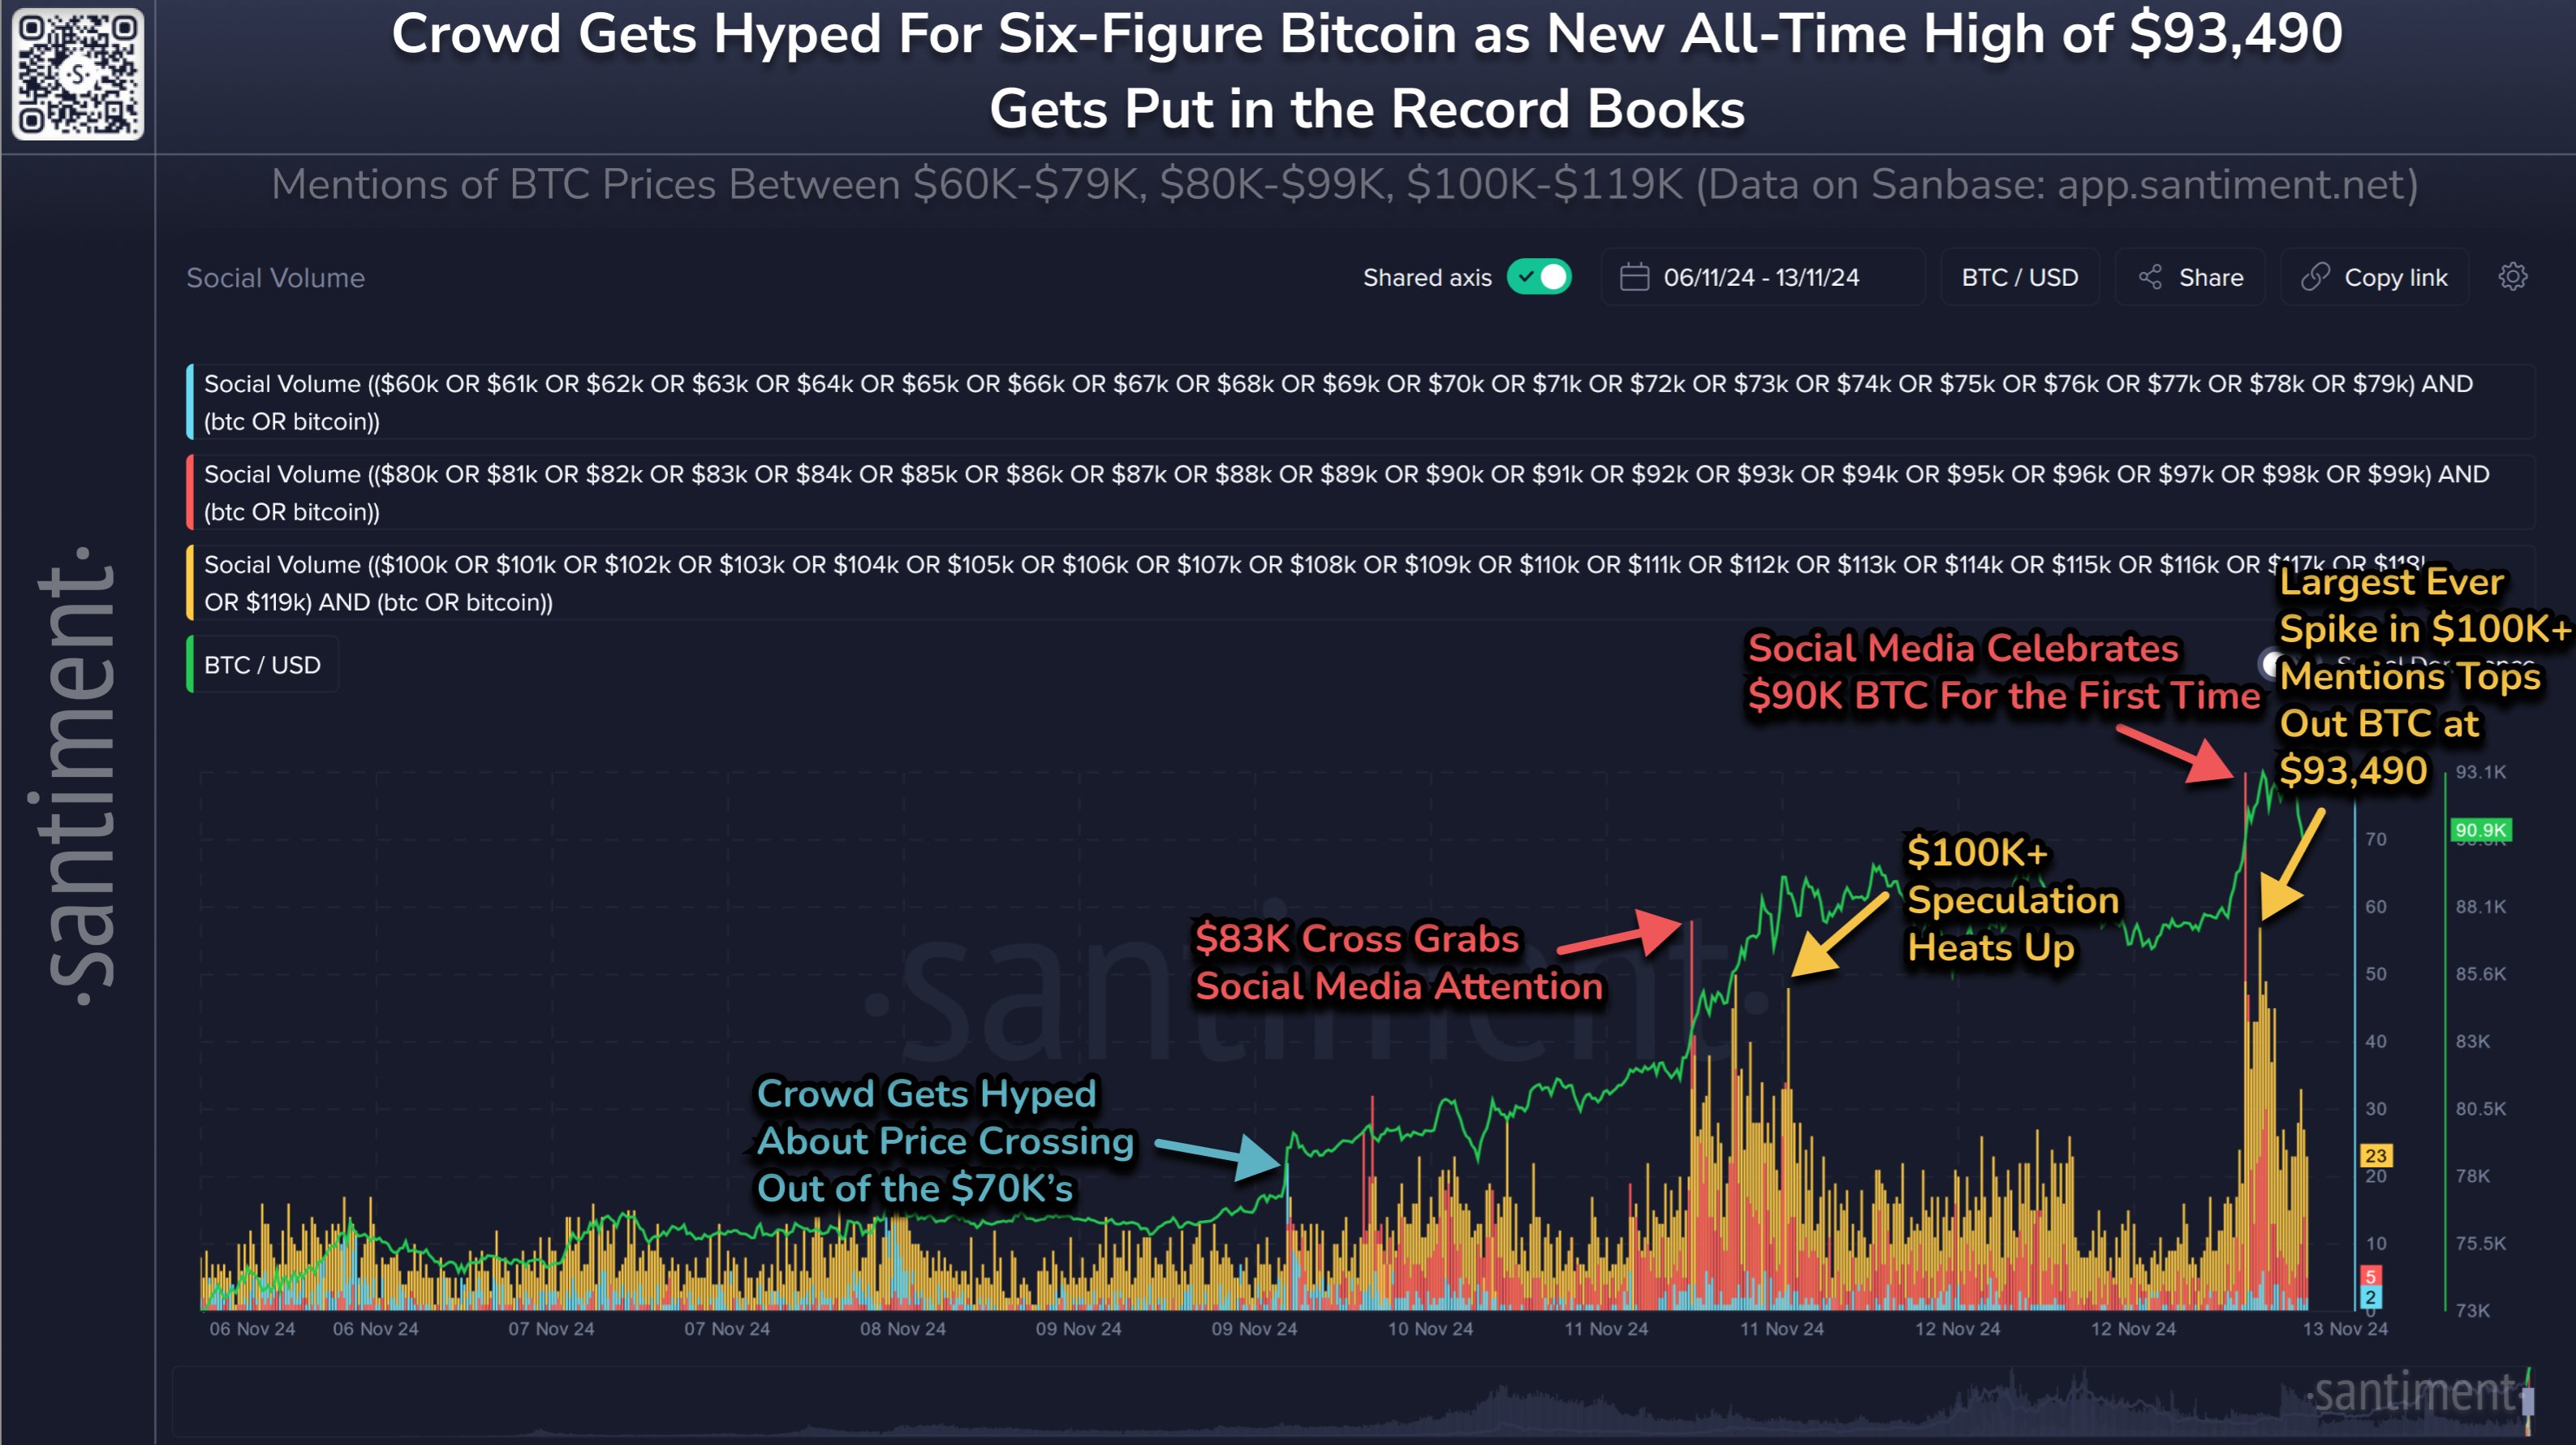
By analyzing the volume of social media discussions around specific terms (such as price), research firm Santiment said that the "hype" around the future will peak as the price itself rises.
"Bitcoin's incredible rise has now reached a new all-time high of $93,490," the company said on November 13.
"The hype on social media platforms very reliably marks the top, with the most pronounced signal appearing 4 hours ago when discussions about BTC prices above $100,000 flooded in."
 Crypto social media data Source: Santiment/X
Santiment added that signs of large-scale "FOMO" should be seen as a "warning signal" suggesting the market rally may reverse.
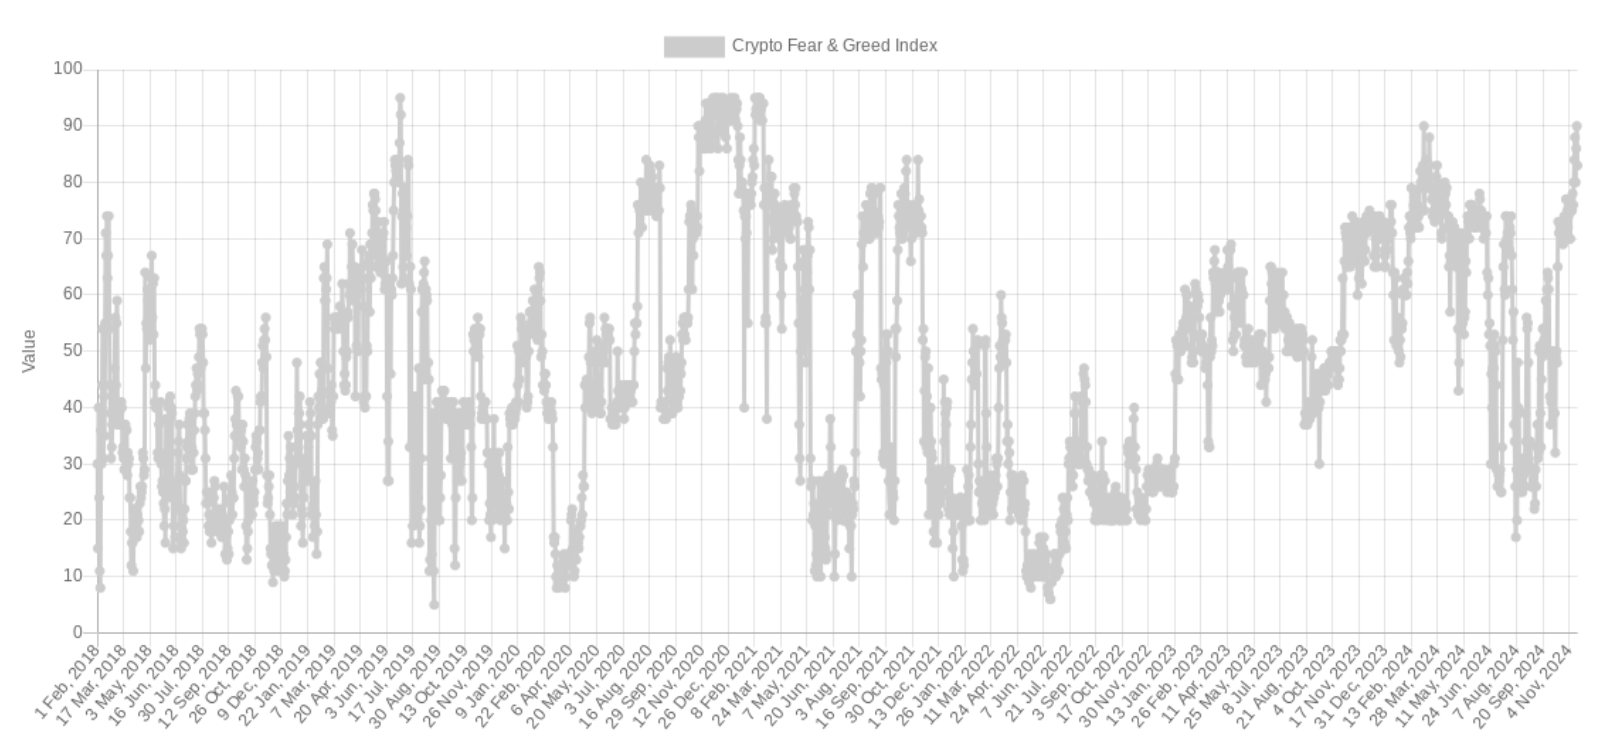
The latest reading of the Crypto Fear & Greed Index shows "extreme greed" levels not seen before the long-term Bitcoin peaks since March.
The index reached 90/100 on November 17, just 5 points below the typical market reversal zone.

Crypto Fear & Greed Index (screenshot) Source: Alternative.me
 Crypto social media data Source: Santiment/X


