The price of BONK has surged 74.63% in the past 7 days, nearing a market capitalization of $4 billion. The current uptrend is supported by bullish indicators, including an RSI of 62.95, suggesting further upside potential before entering overbought territory.
The Ichimoku Cloud chart and EMA lines also confirm a strong upward trend, with the price significantly exceeding key support levels. If this strength persists, BONK could test $0.00006 and reach new all-time highs, but a reversal could lead to a significant correction to $0.000033 or $0.000021.
BONK RSI Not Yet in Overbought Territory
BONK's RSI is at 62.95, having declined from over 70 when it reached new all-time highs a few days ago. This dip indicates a temporary pause in momentum, but the current uptrend suggests the coin is regaining strength.
The Relative Strength Index (RSI) tracks price momentum, with readings above 70 indicating overbought conditions and below 30 signaling oversold conditions. At 62.95, BONK remains in the bullish zone but has room to grow before reaching overbought levels.

The current RSI suggests BONK can continue to rise before exceeding 70, potentially testing new all-time highs.
The new momentum can push the price higher as buying pressure increases, and BONK is positioning itself as the fourth-largest meme coin and the largest in the Solana ecosystem.
BONK Ichimoku Cloud Signals Bullish Trend
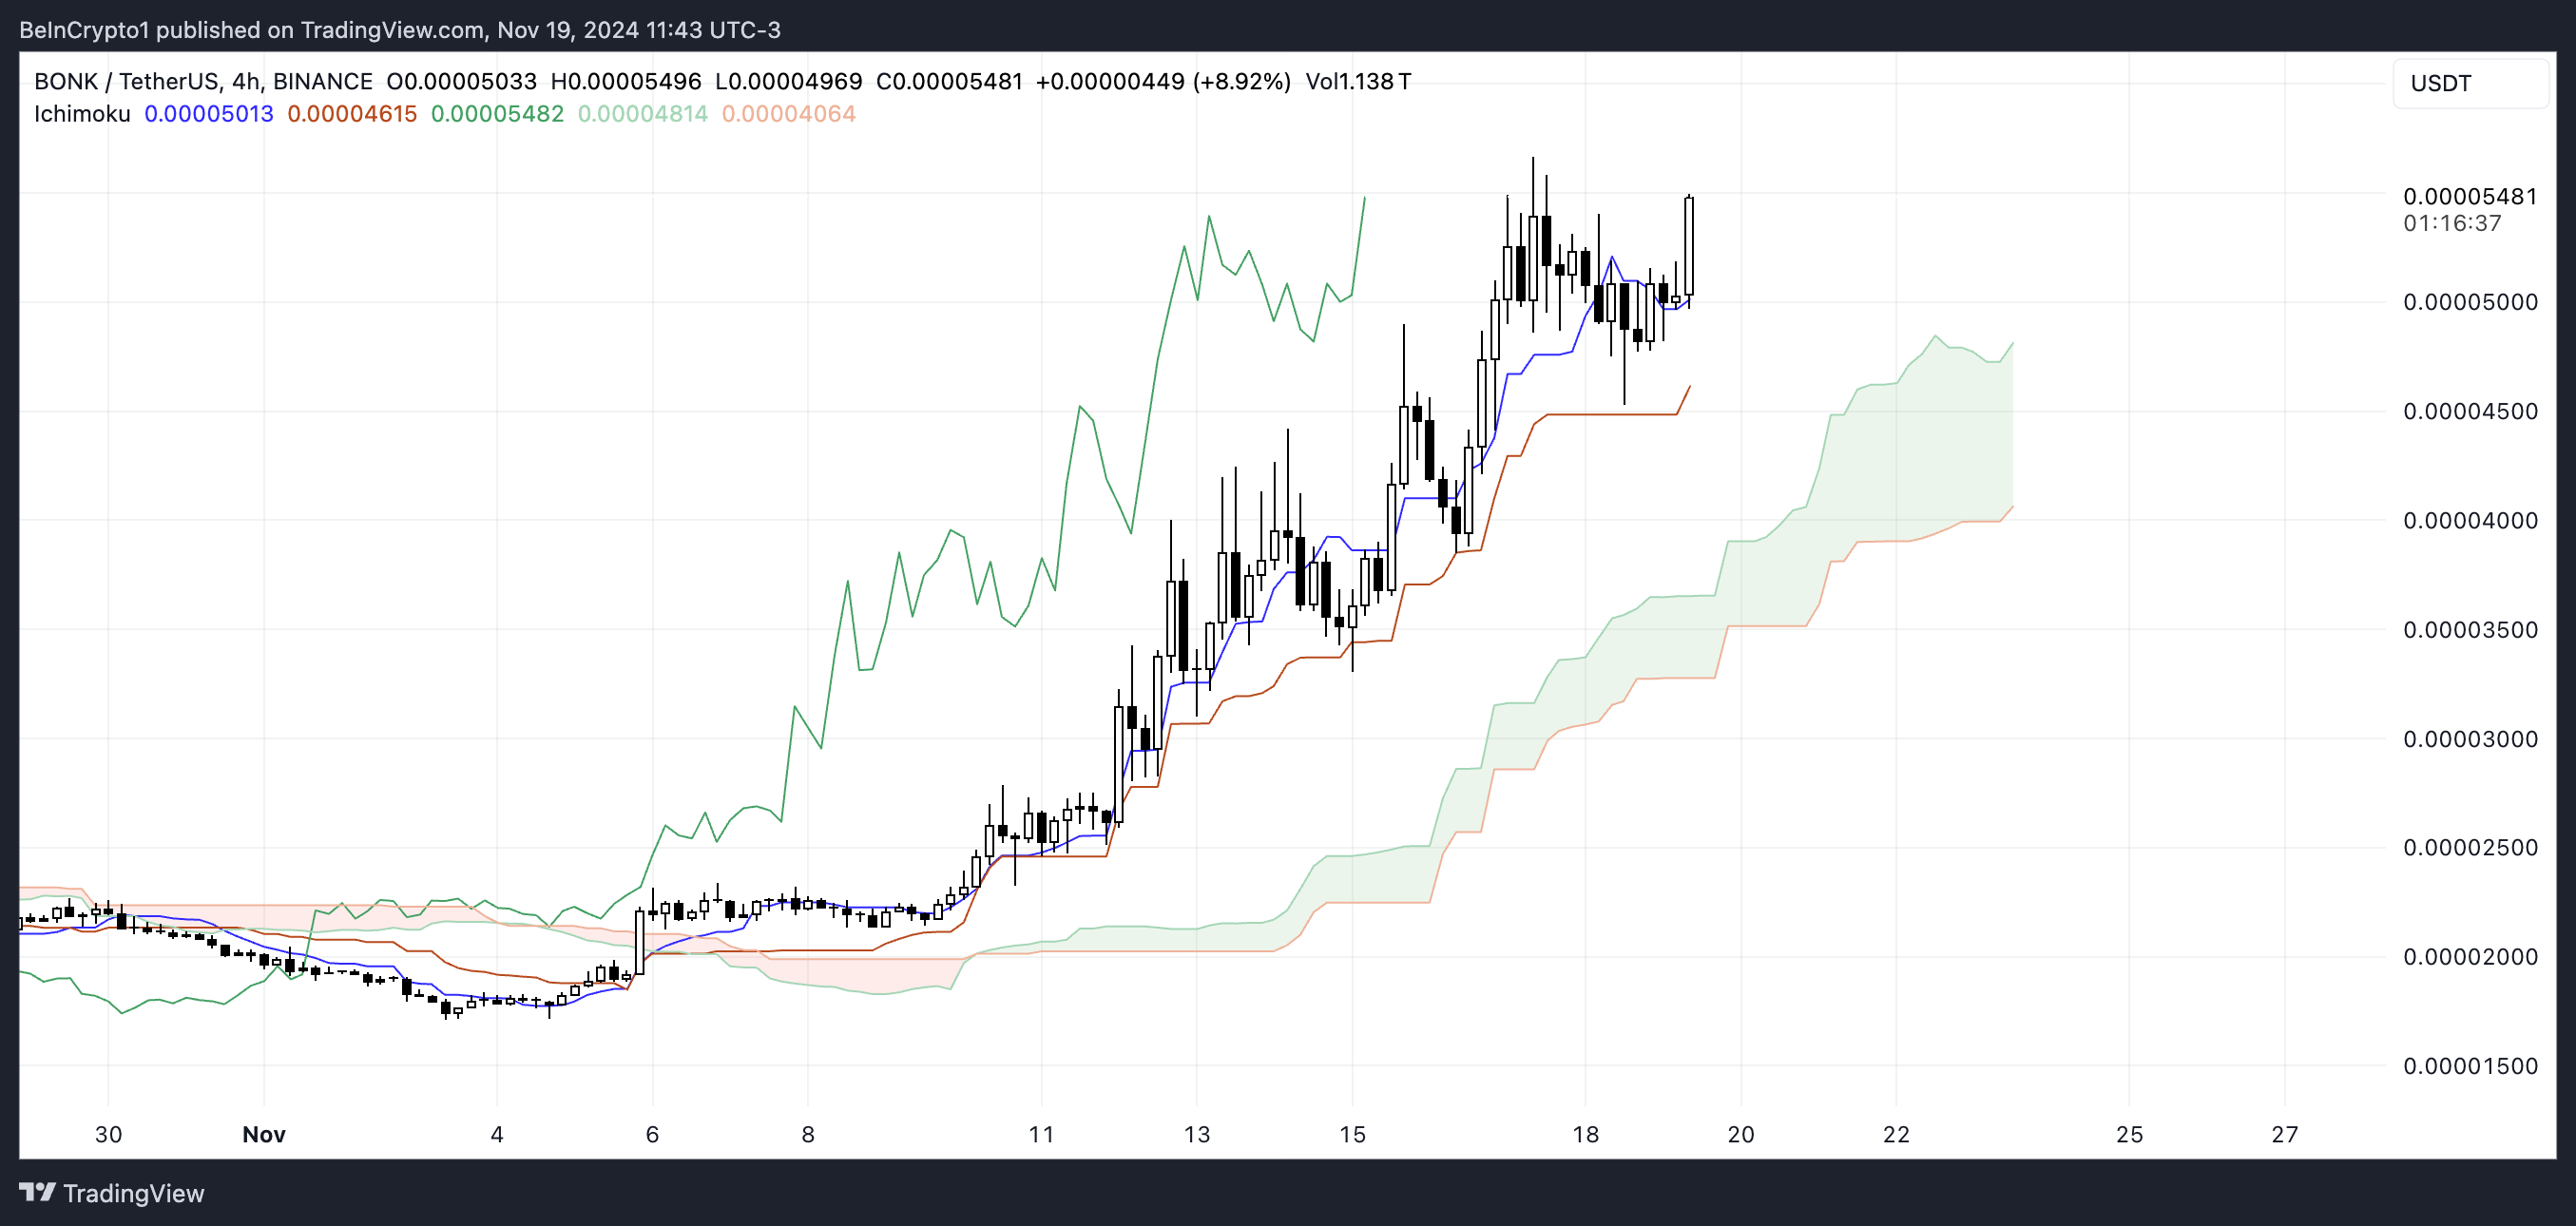
Analysis of the BONK Ichimoku Cloud chart shows the price significantly exceeding the cloud, indicating strong bullish momentum. The leading span (green cloud) is in a continuous upward movement, suggesting rising support levels.
The conversion line (blue line) and base line (red line) are positioned below the price, further strengthening the uptrend. This positioning emphasizes that the current market is dominated by buyers.

If the uptrend continues, BONK can continue testing higher levels as the cloud provides more support. The bullish structure is maintained, and there are no significant signs of momentum weakening.
However, a drop below the cloud or the key base line could signal a correction or trend reversal. For now, the Ichimoku Cloud suggests BONK price is likely to maintain its upward trajectory.
BONK Price Prediction: New All-Time High Soon?
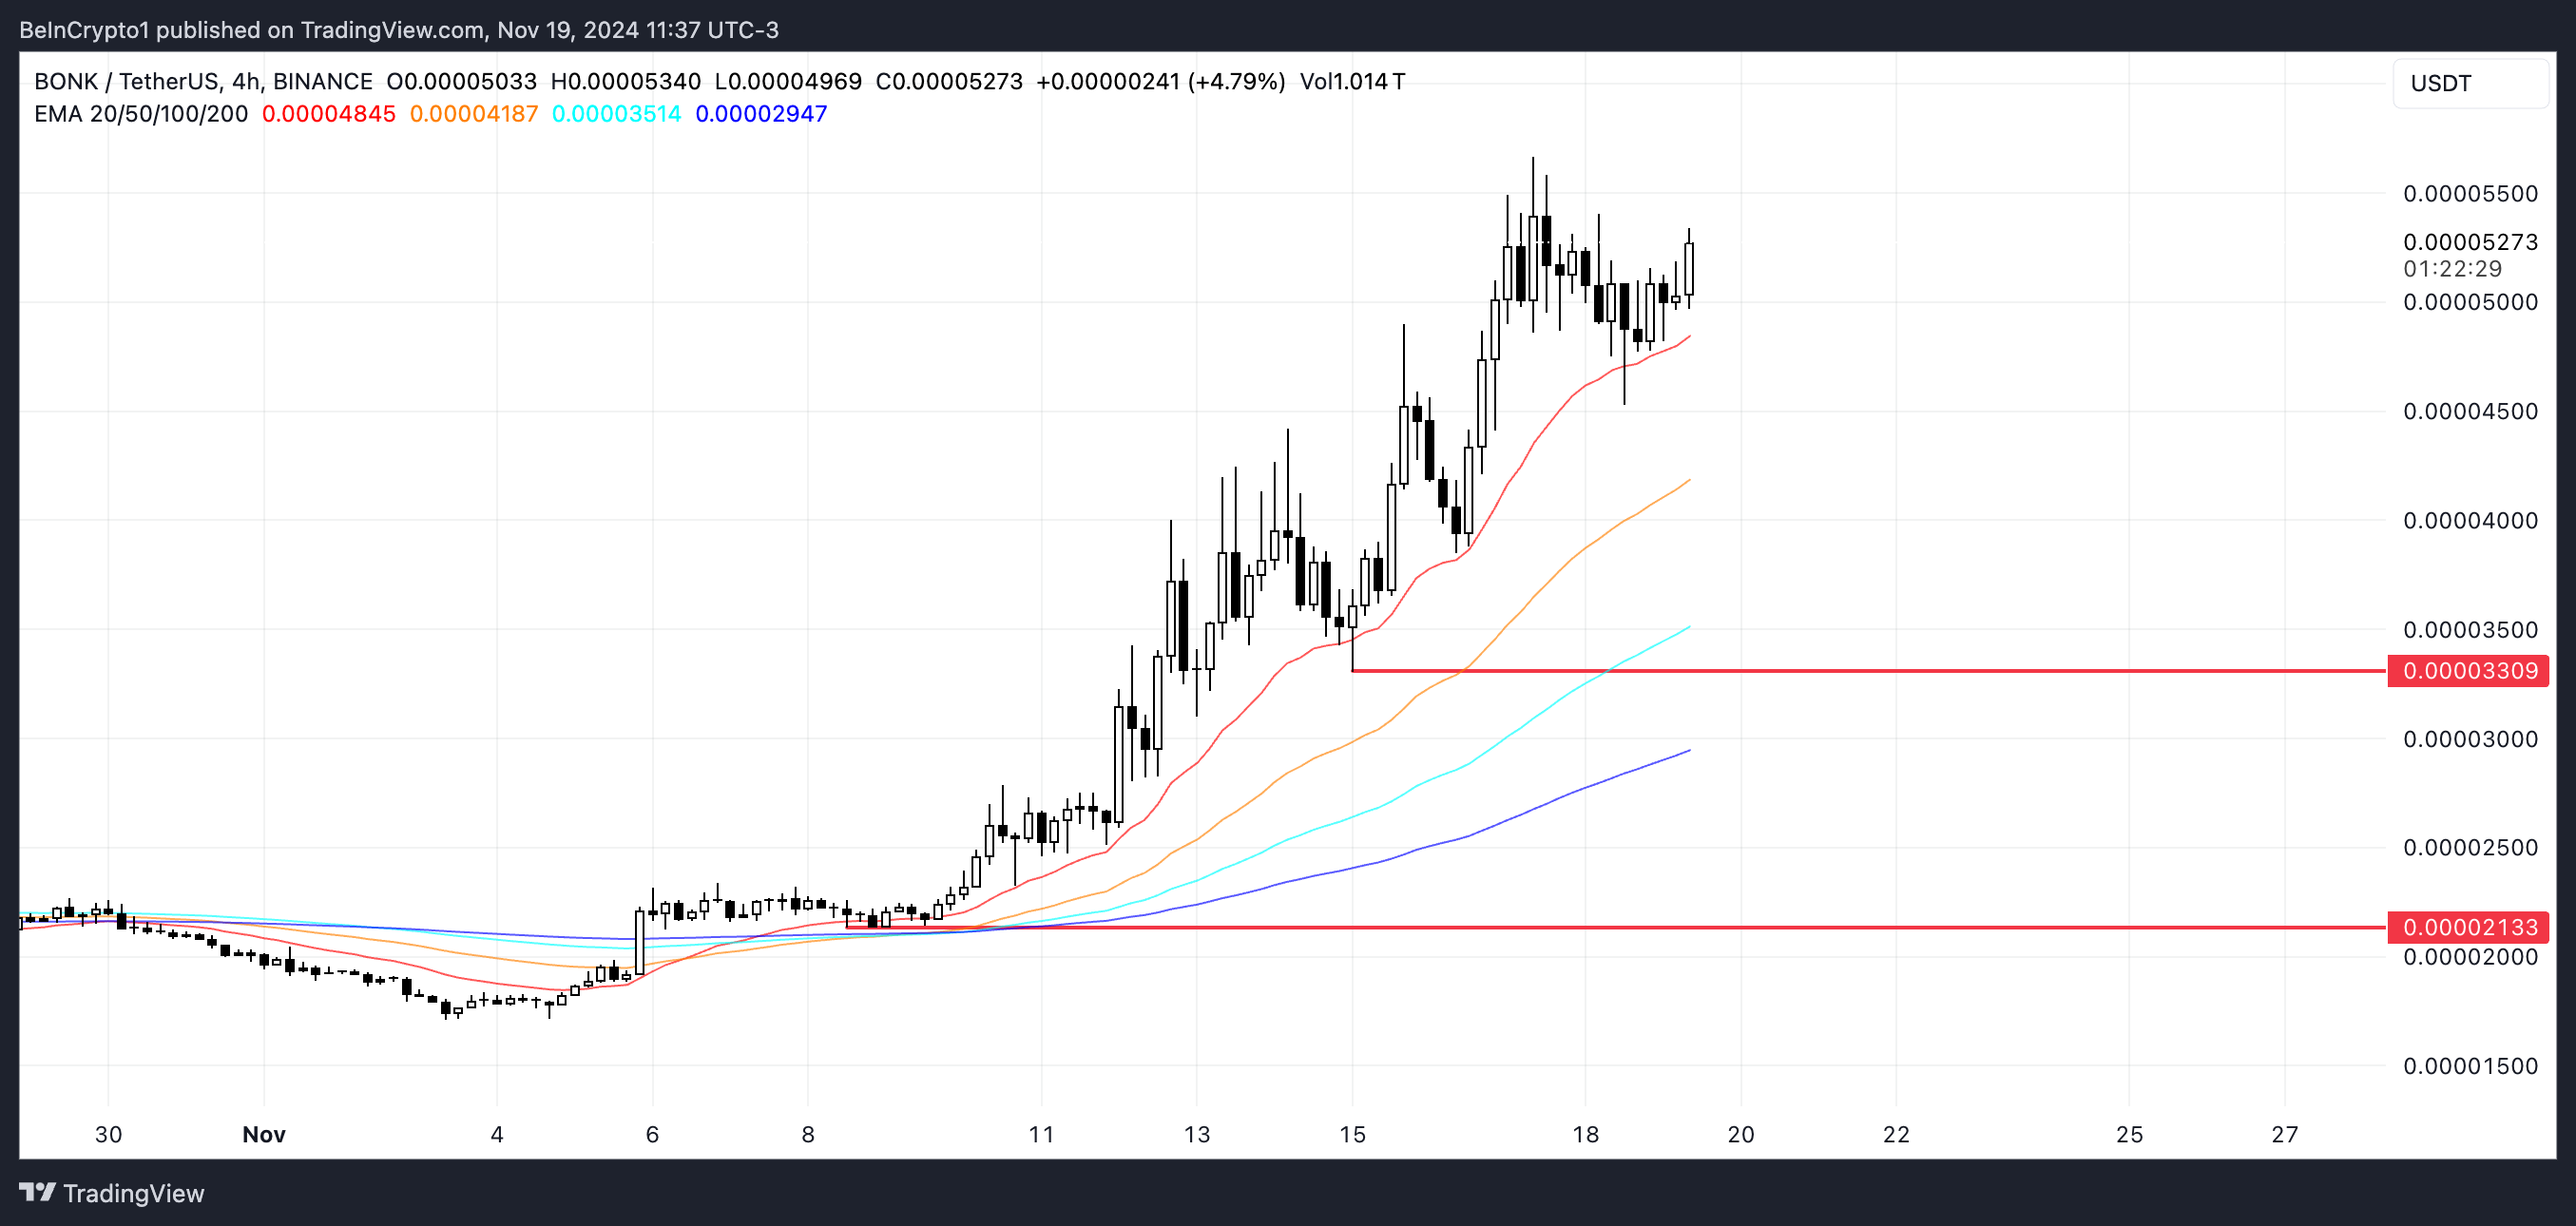
BONK's EMA lines display a strong bullish setup, with the short-term EMAs positioned above the long-term EMAs, and the price trading above all the lines. This alignment indicates the upward momentum is sustained, and the buyers are firmly in control.
The bullish structure suggests the uptrend is being maintained, reinforcing confidence in BONK's short-term performance.

If the current trend persists, BONK's price could reach new all-time highs and test the $0.00006 resistance level. However, if the momentum weakens and the trend reverses, BONK's price could experience a significant correction to the $0.000033 and $0.000021 support levels.
The latter would represent a 65% plunge, emphasizing the importance of maintaining bullish strength.


