Stellar (XLM) has experienced a 50% price surge in the past 24 hours, making it the best-performing asset during this period. This surge is attributed to Grayscale Investments LLC submitting a recent 10-K report for the Grayscale Stellar Lumens Trust.
At the time of reporting, this altcoin is trading at $0.45, which is the highest price observed since 2021. However, the analysis of the daily chart suggests the possibility of a short-term decline. The reasons are as follows.
Surge in Grayscale Stellar Lumens Trust's Net Assets
On Friday, the Grayscale Stellar Lumens Trust (XLM) of Grayscale Investments LLC filed a 10-K report for the fiscal year ended September 30, 2024. This report mentioned that the total net assets increased by 10% during the fiscal year.
The 10-K report is an annual report that publicly traded companies in the US must submit to the Securities and Exchange Commission (SEC). This report provides an overview of the company's financial performance, including the company's audited financial statements, business operations, risk factors, and management's discussion and analysis.
According to the report, the Grayscale Stellar Lumens Trust (XLM), which provides investment exposure to XLM, incurred losses. This was due to the decline in the token's price and fees paid to the trust's sponsor during the period. However, these losses were offset by the addition of 34,875,230 XLM tokens, valued at $3,923, to the trust. This resulted in a net increase in the trust's total assets.
XLM Reacts to the News
The positive sentiment around this report has led to a surge in the value of XLM. Over the past 24 hours, the token's price has surged by 58%, making it the largest gain in the market. At the time of writing, this altcoin is trading at $0.45, which is the last observed price in November 2021.
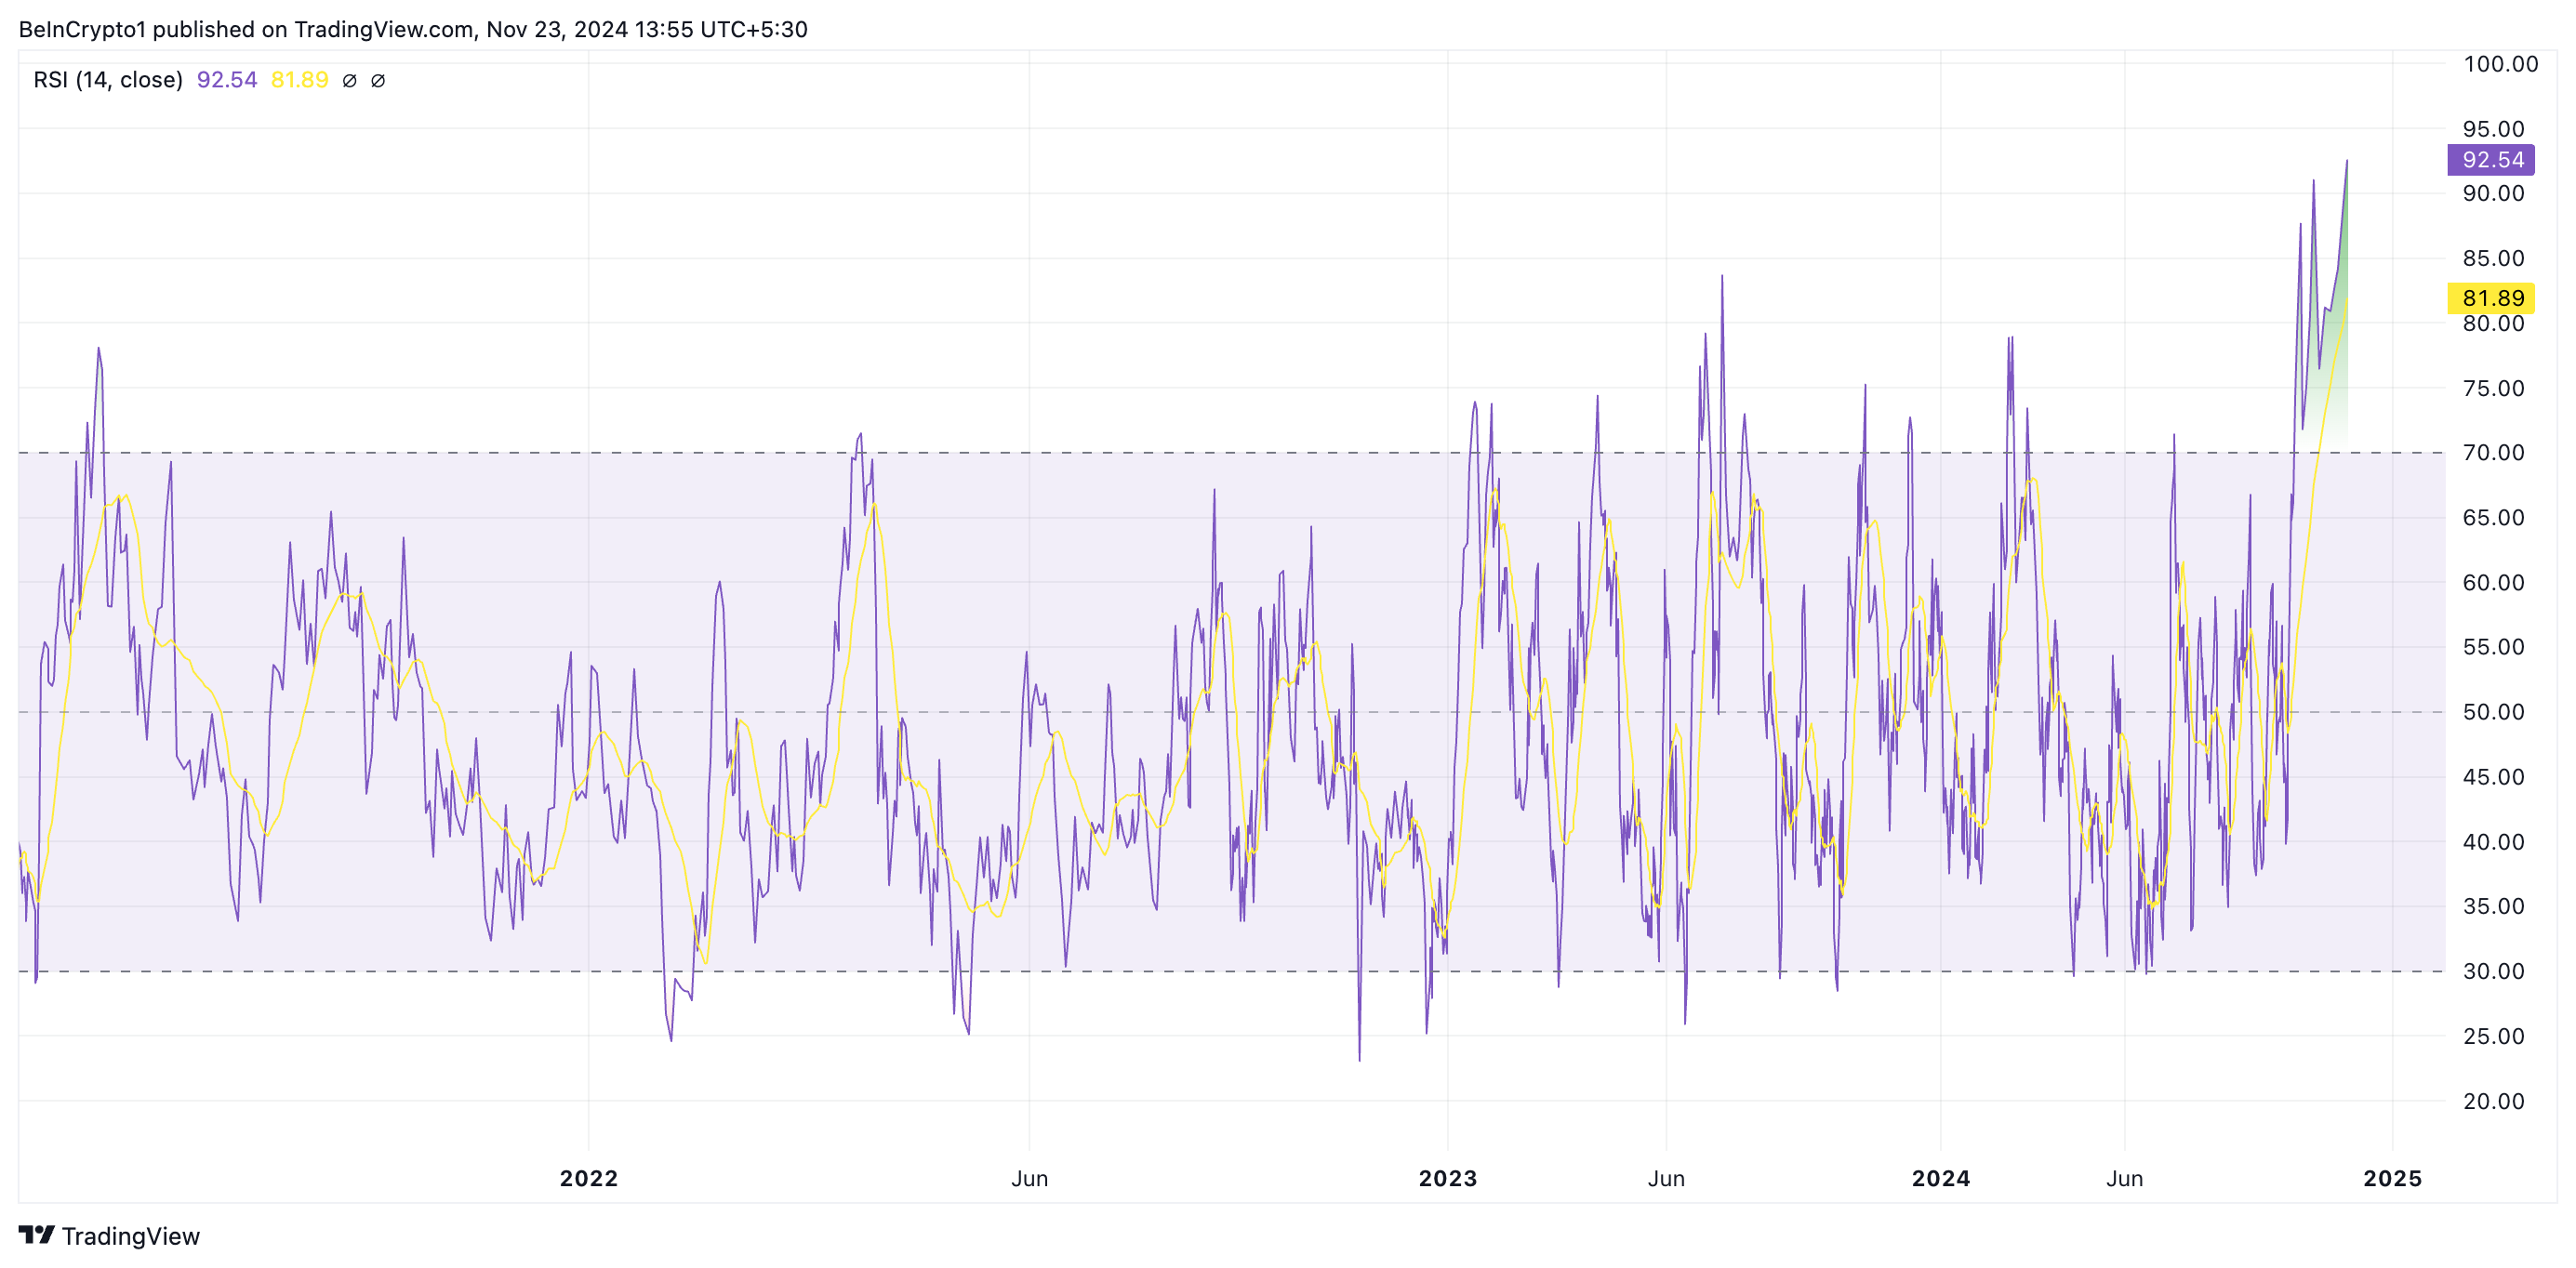
However, the analysis of the daily chart suggests that XLM may have become overbought among market participants, indicating that this rally may not continue. For example, the Relative Strength Index (RSI) has reached an all-time high of 92.54 at the time of reporting.
The RSI measures the overbought and oversold market conditions of an asset. It ranges from 0 to 100, with values above 70 indicating the asset is overbought and may require a correction, while values below 30 suggest the asset is oversold and may be due for a rebound. XLM's RSI of 92.54 indicates that the asset is significantly overbought and at risk of a correction.

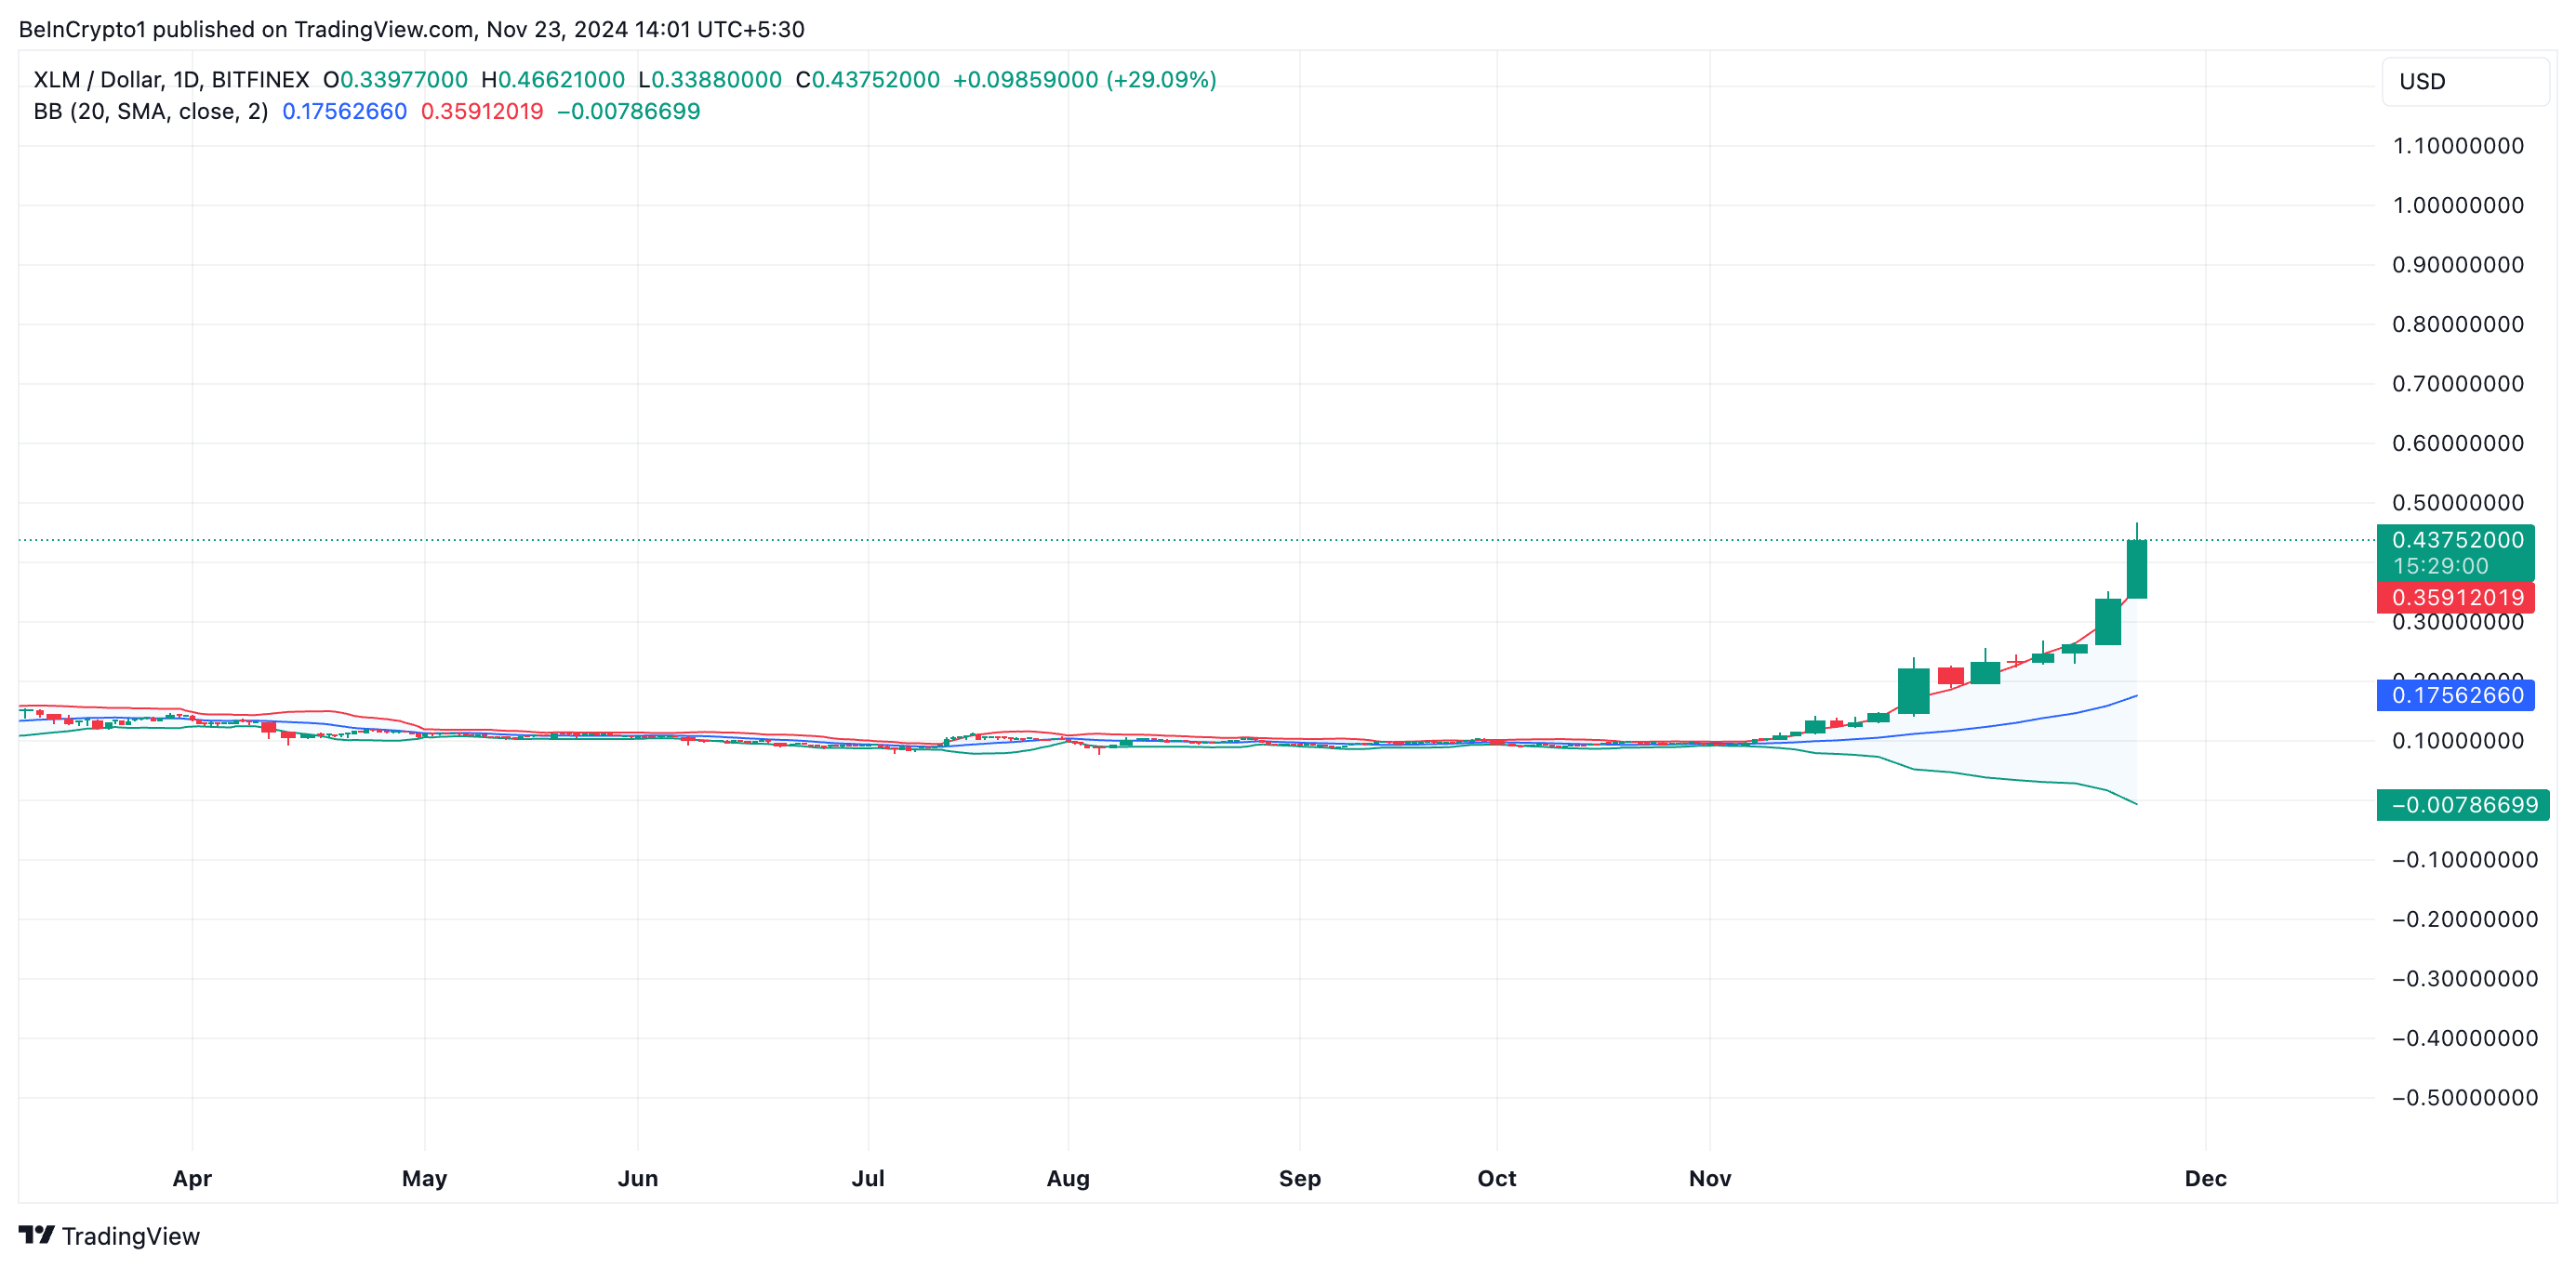
Furthermore, XLM's price is trading above the upper Bollinger Band, confirming the potential for price correction.
The Bollinger Bands indicator measures market volatility and identifies potential buy and sell signals. It consists of three main components: the middle band, the upper band, and the lower band.
When the price trades above the upper band, it suggests the asset is overbought. This means the asset's price has significantly deviated from its average price and is at risk of a short-term correction.

XLM Price Forecast: Potential Correction of Recent Surge
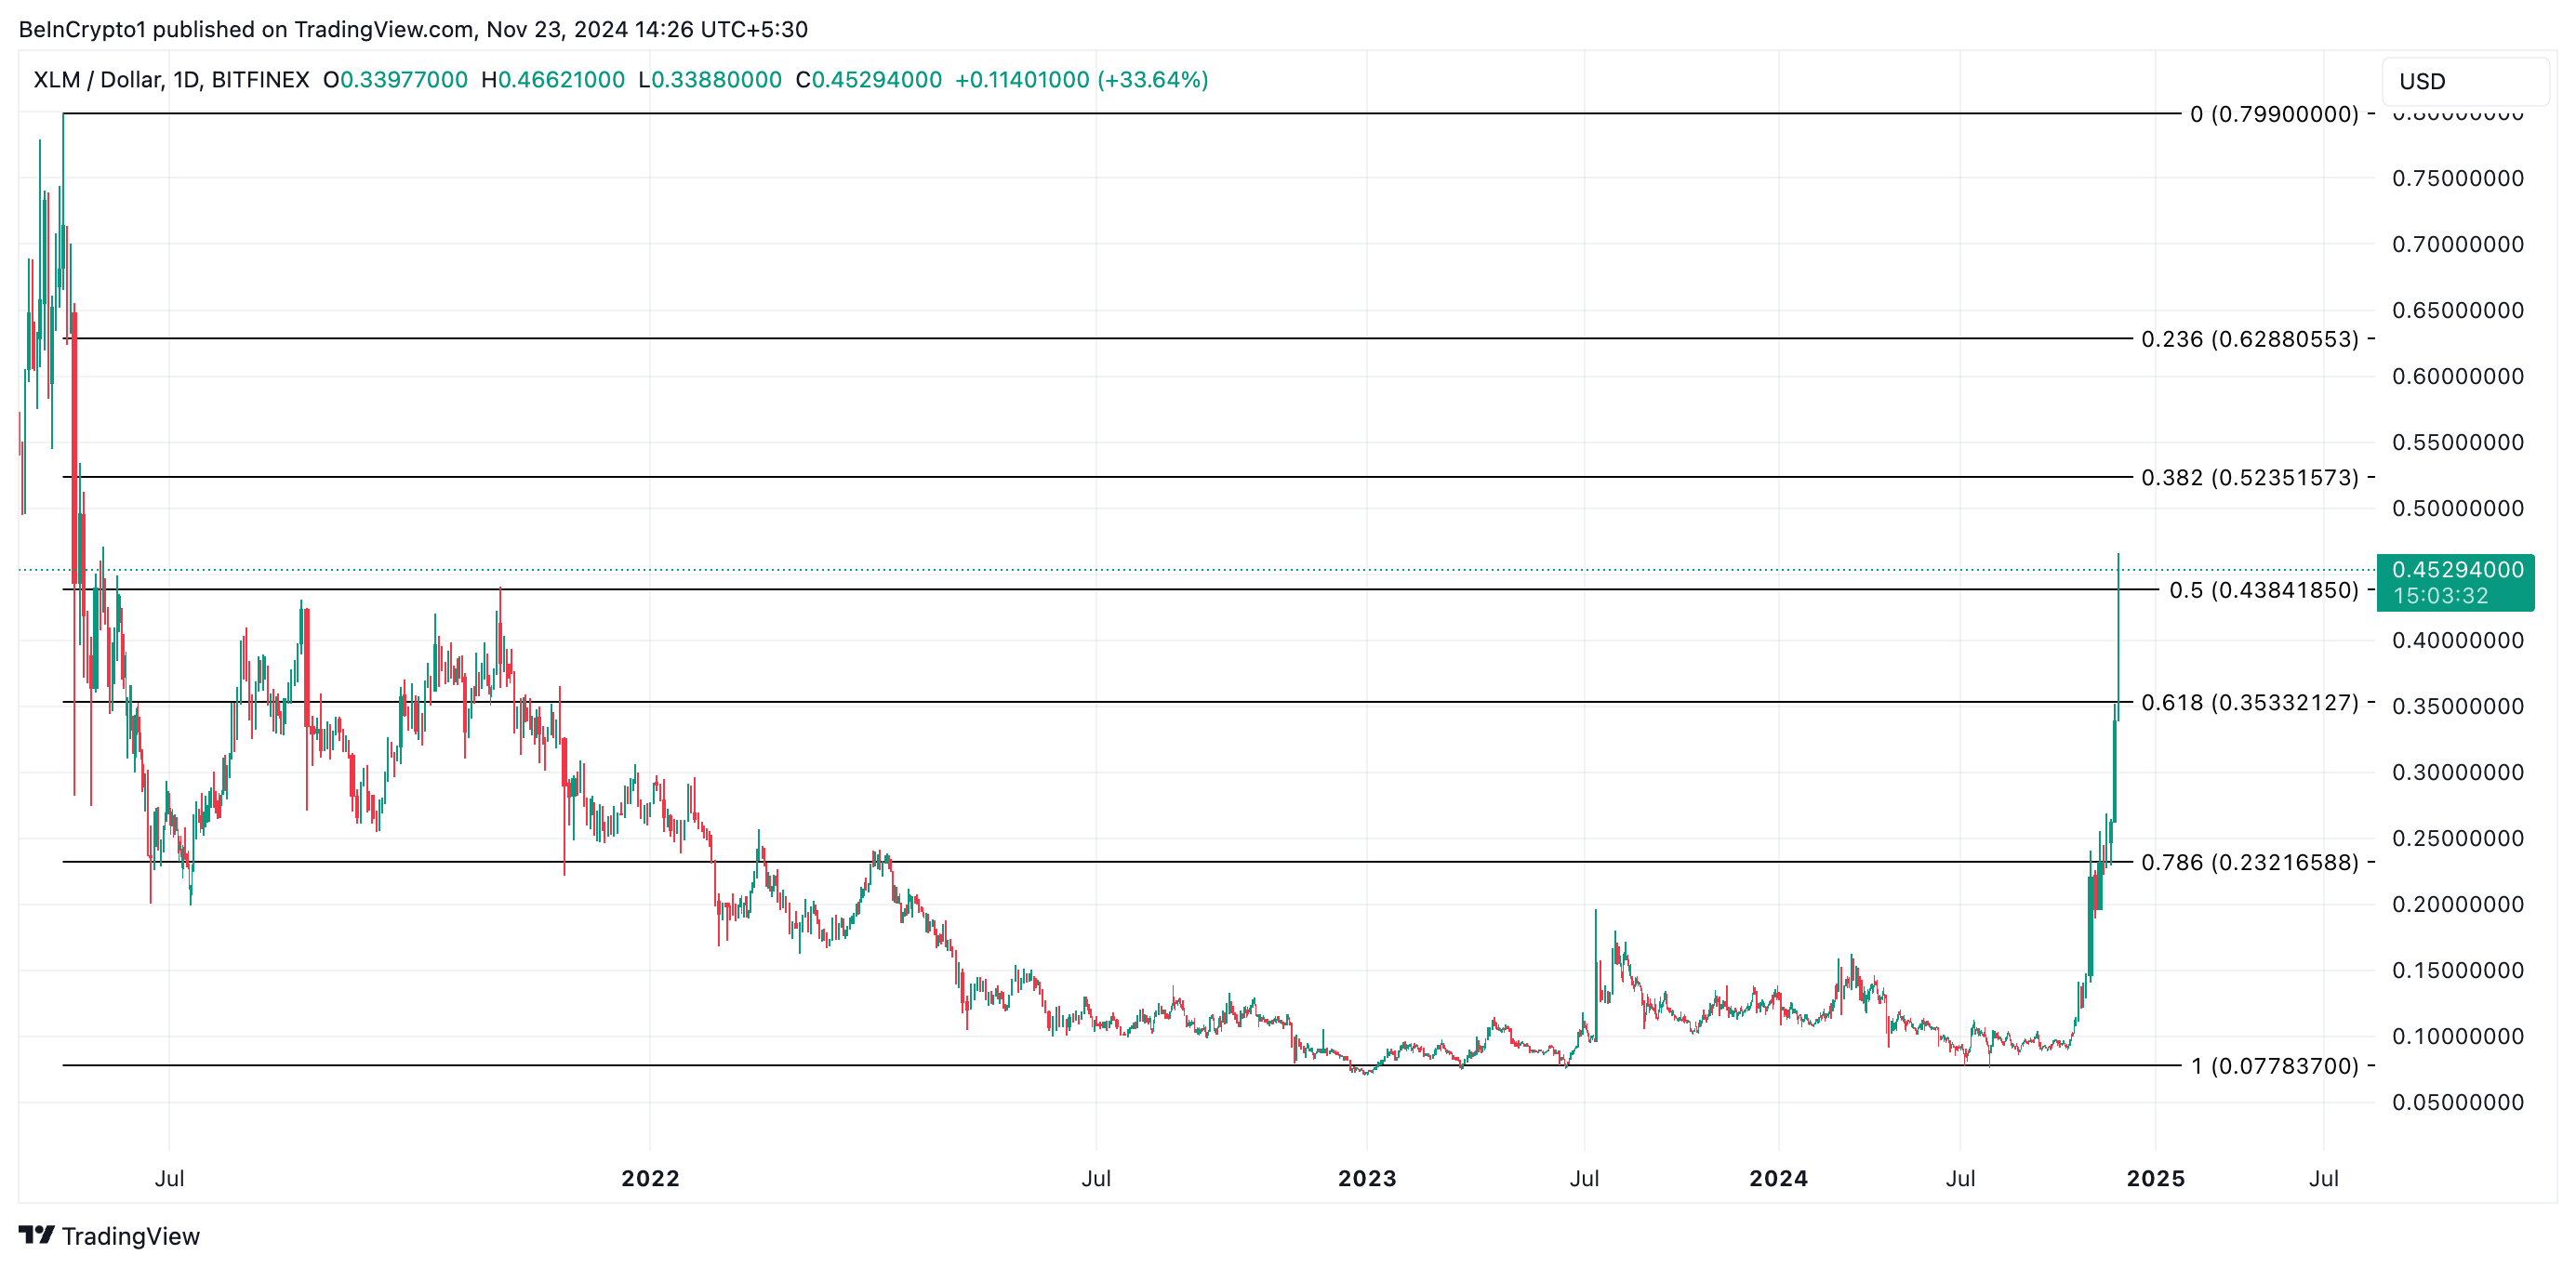
If buyer fatigue sets in, XLM's price is at risk of losing some of its recent gains. According to the Fibonacci retracement tool, if this occurs, the price target would be the support level formed at $0.35. If buyers fail to defend this level, the token's price could further decline to $0.23.

On the other hand, if buying pressure strengthens, the price of XLM tokens may continue to rise and attempt to break through the $0.52 level last reached in May 2021.


