Bitcoin miners have been actively reducing their holdings over the past few weeks. This is because the price of the coin has remained below the critical $100,000 level. At the time of reporting, Bitcoin was trading at $98,535, down 1% from the all-time high of $99,860 recorded in the Friday session.
As the BTC market has started to consolidate, miners may distribute more of their holdings to realize profits or offset increasing mining costs.
Bitcoin Miners Actively Selling Their Holdings
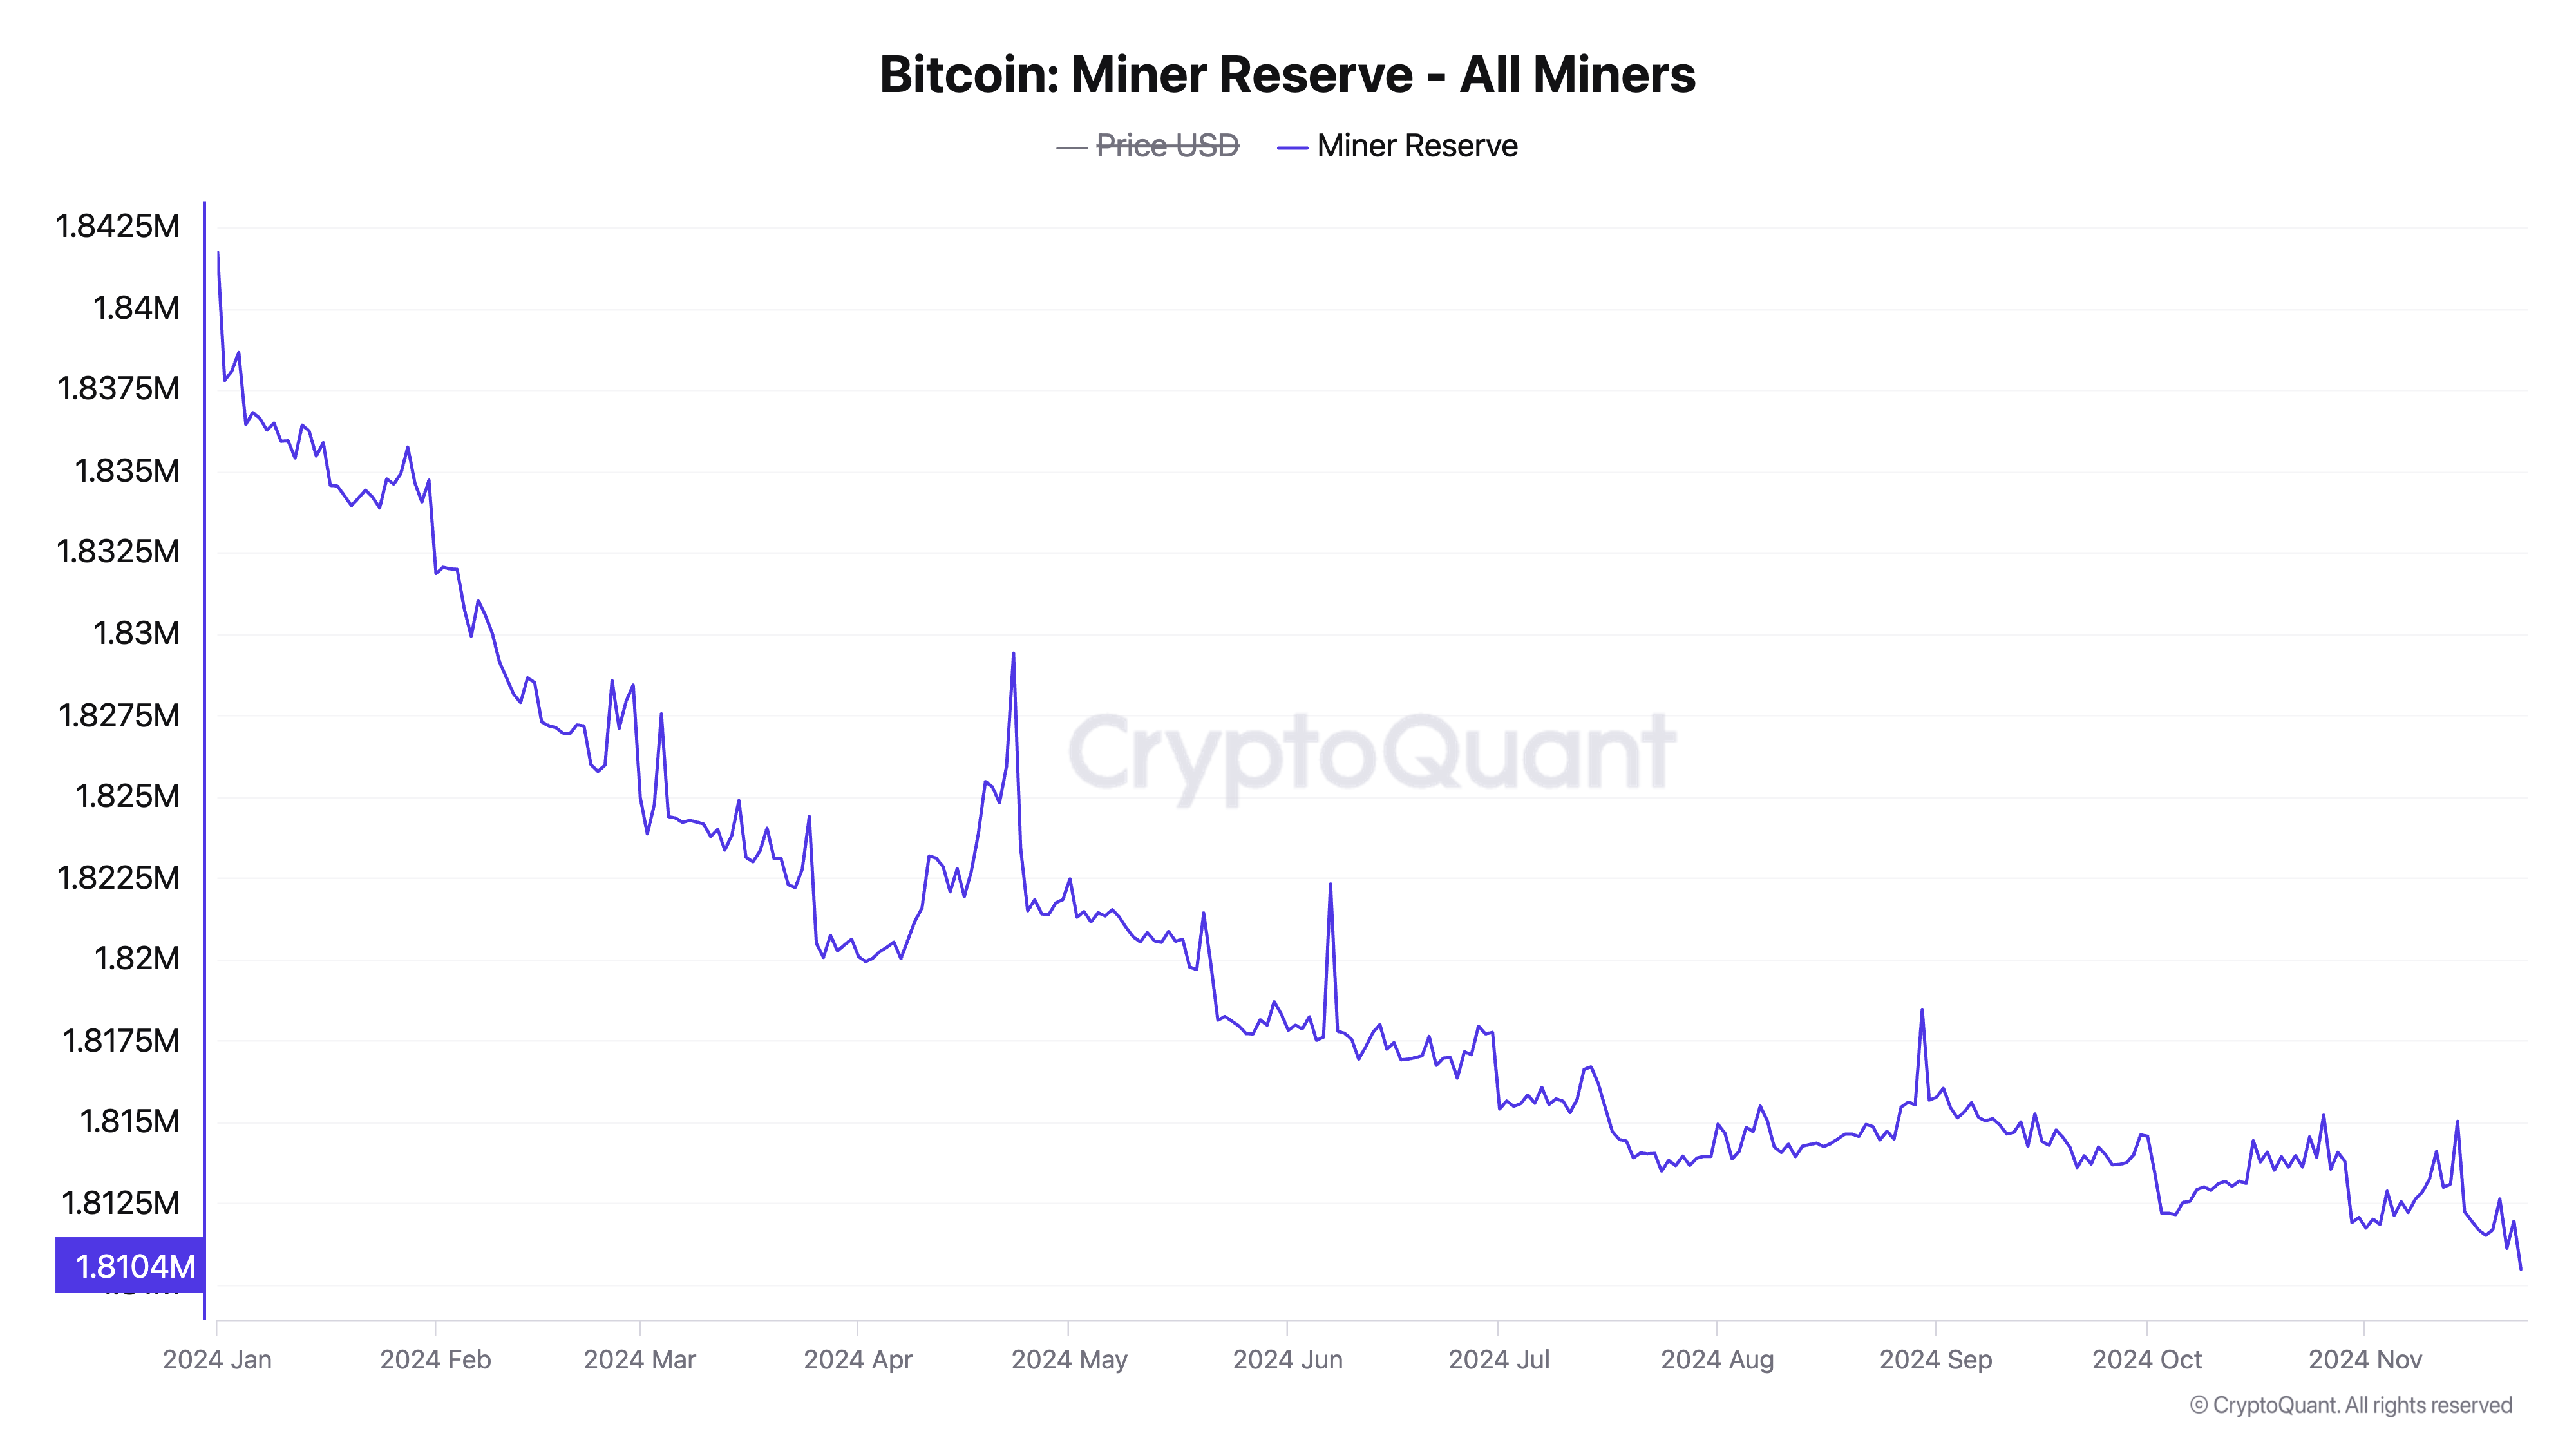
According to data from the on-chain analytics platform CryptoQuant, Bitcoin miner reserves have dropped to the lowest level since the start of the year. They currently stand at 1.81 million BTC.
This metric tracks the number of coins held in miner wallets, representing the coins that miners have not yet sold. The decline in BTC miner reserves indicates that the miners on the Bitcoin network are distributing their coins to realize profits or cover mining-related expenses.

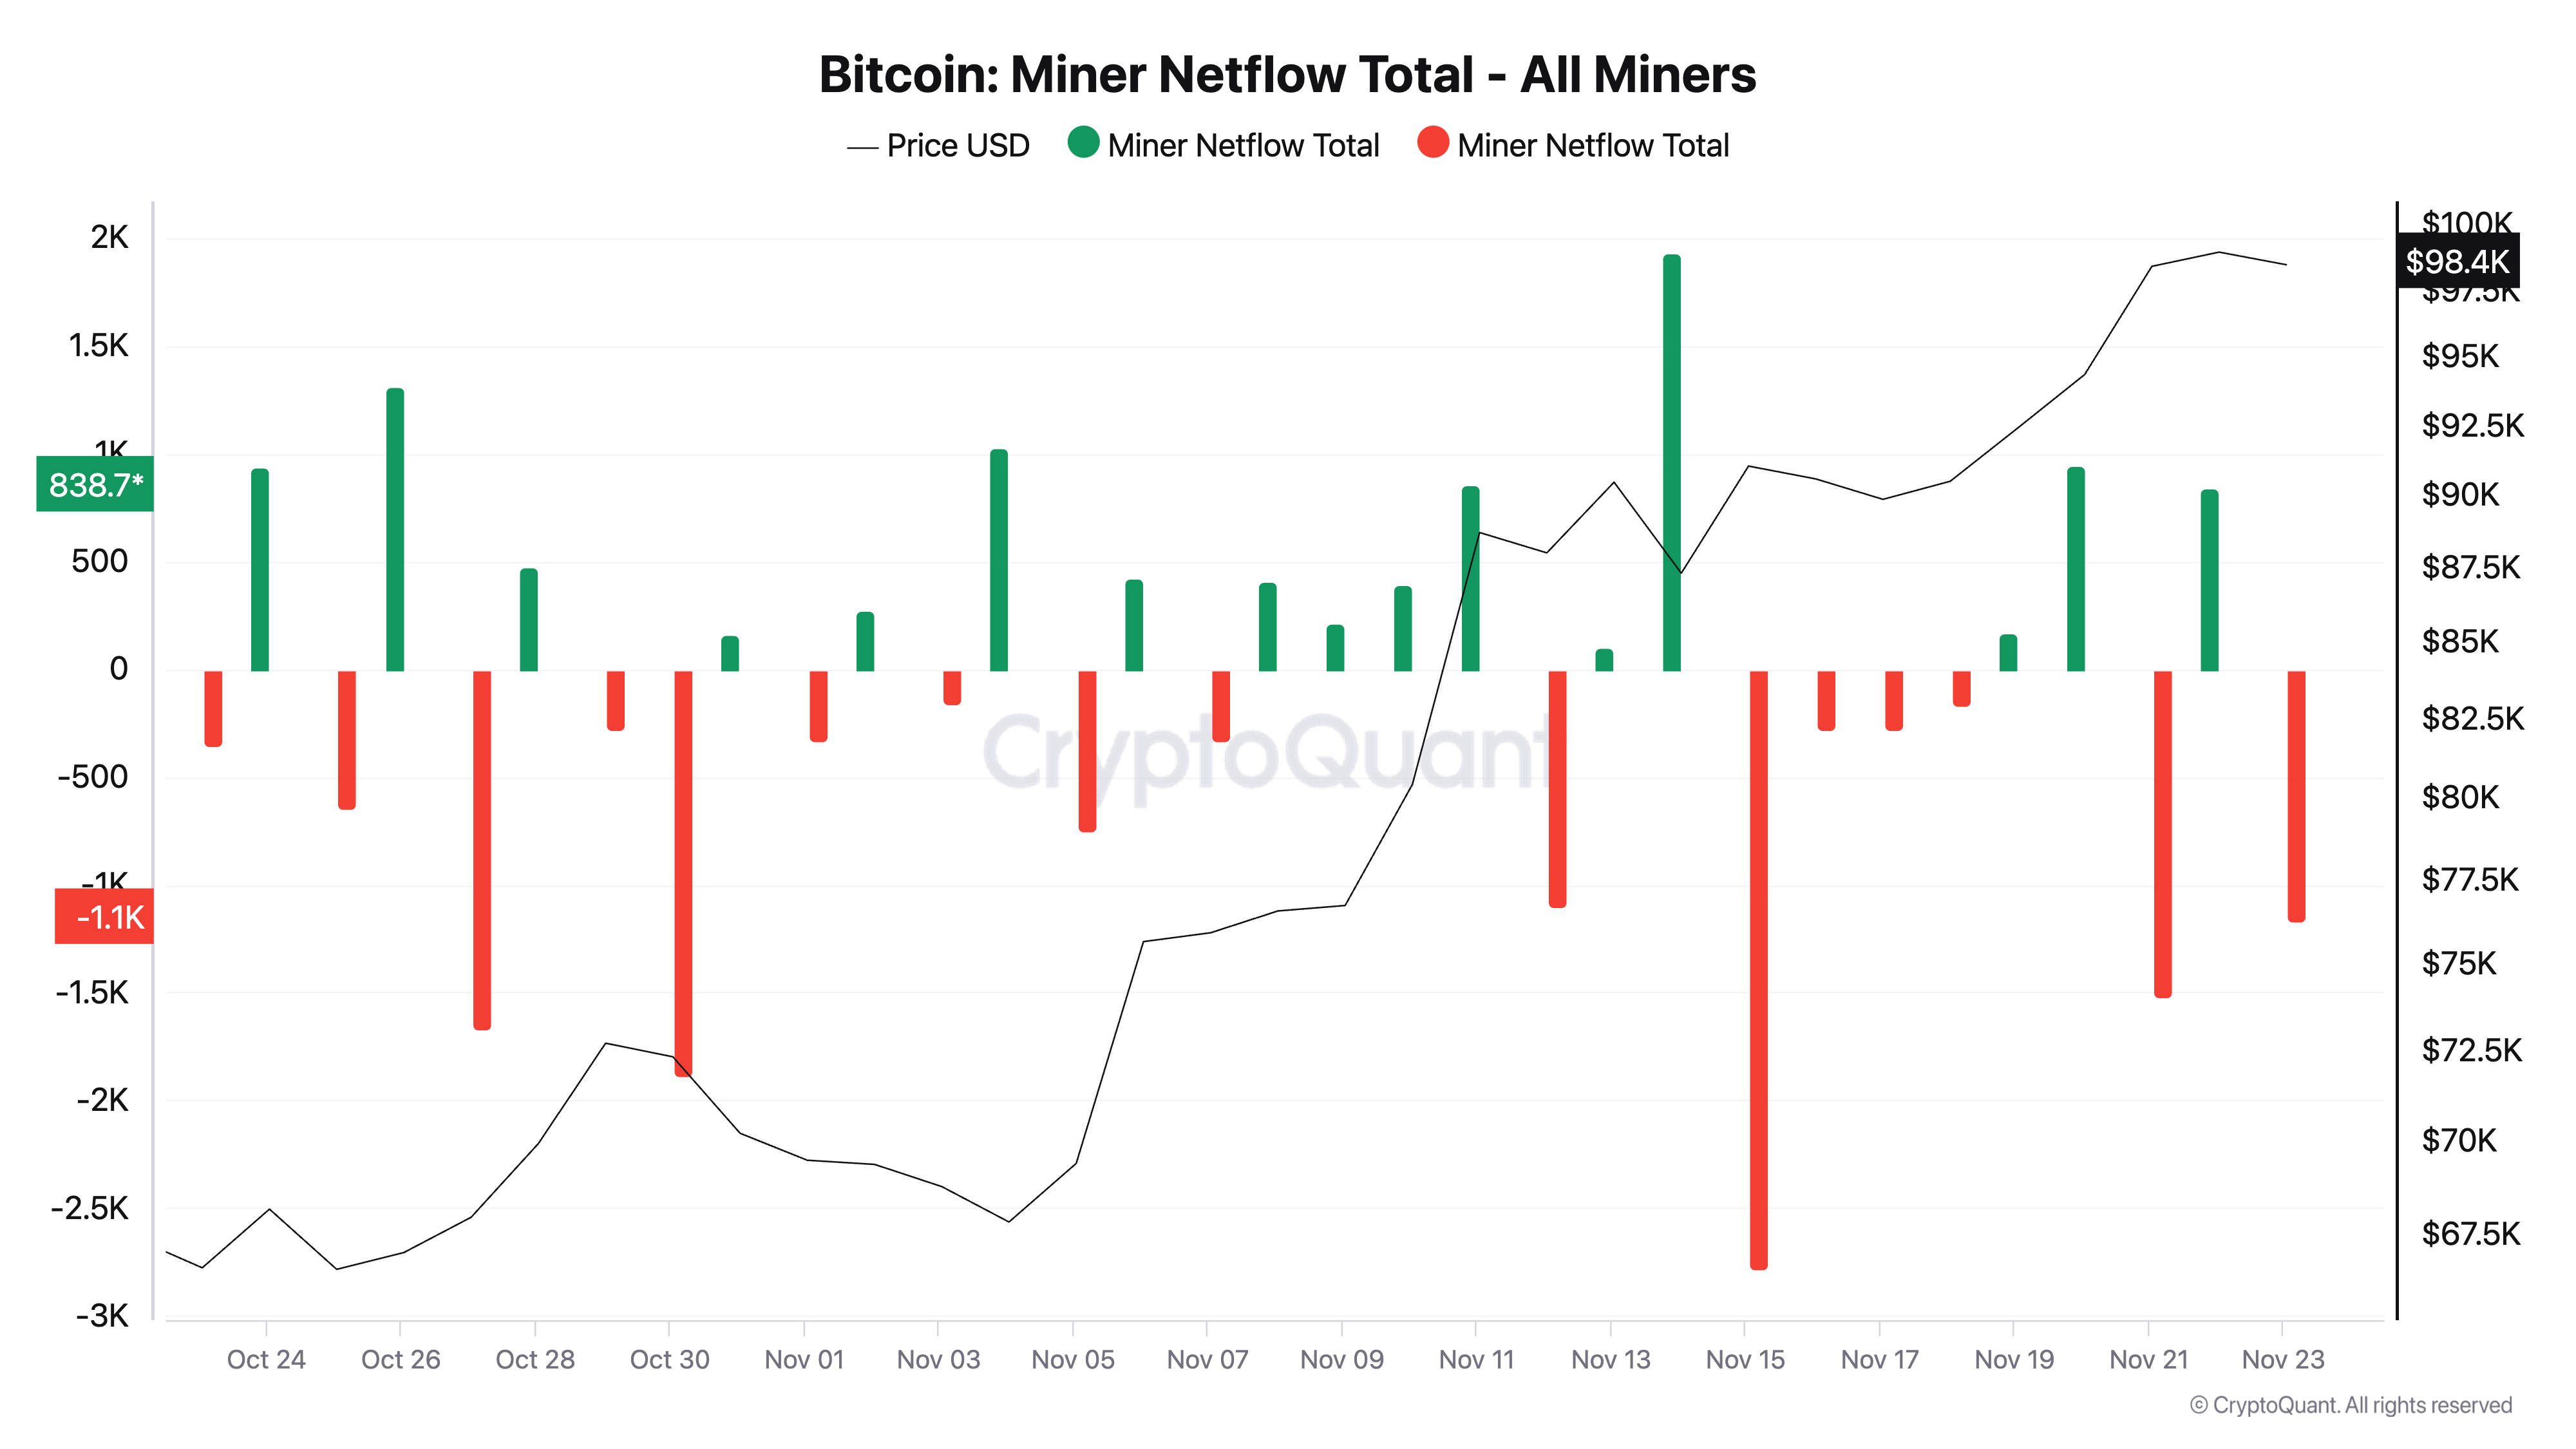
Additionally, the BTC miner net outflows confirm the daily trend of miners selling Bitcoin. This metric currently stands at -1,172 BTC, which is negative.
Miner net outflows represent the net amount of Bitcoin that miners are buying or selling. It is calculated by subtracting the amount of Bitcoin miners are buying from the amount they are selling. A negative value indicates that miners are selling more Bitcoin than they are buying, which is often seen as a bearish signal and may foreshadow a short-term price decline.

BTC Price Forecast: Selling Pressure Increased, but Bull Market Potential Remains
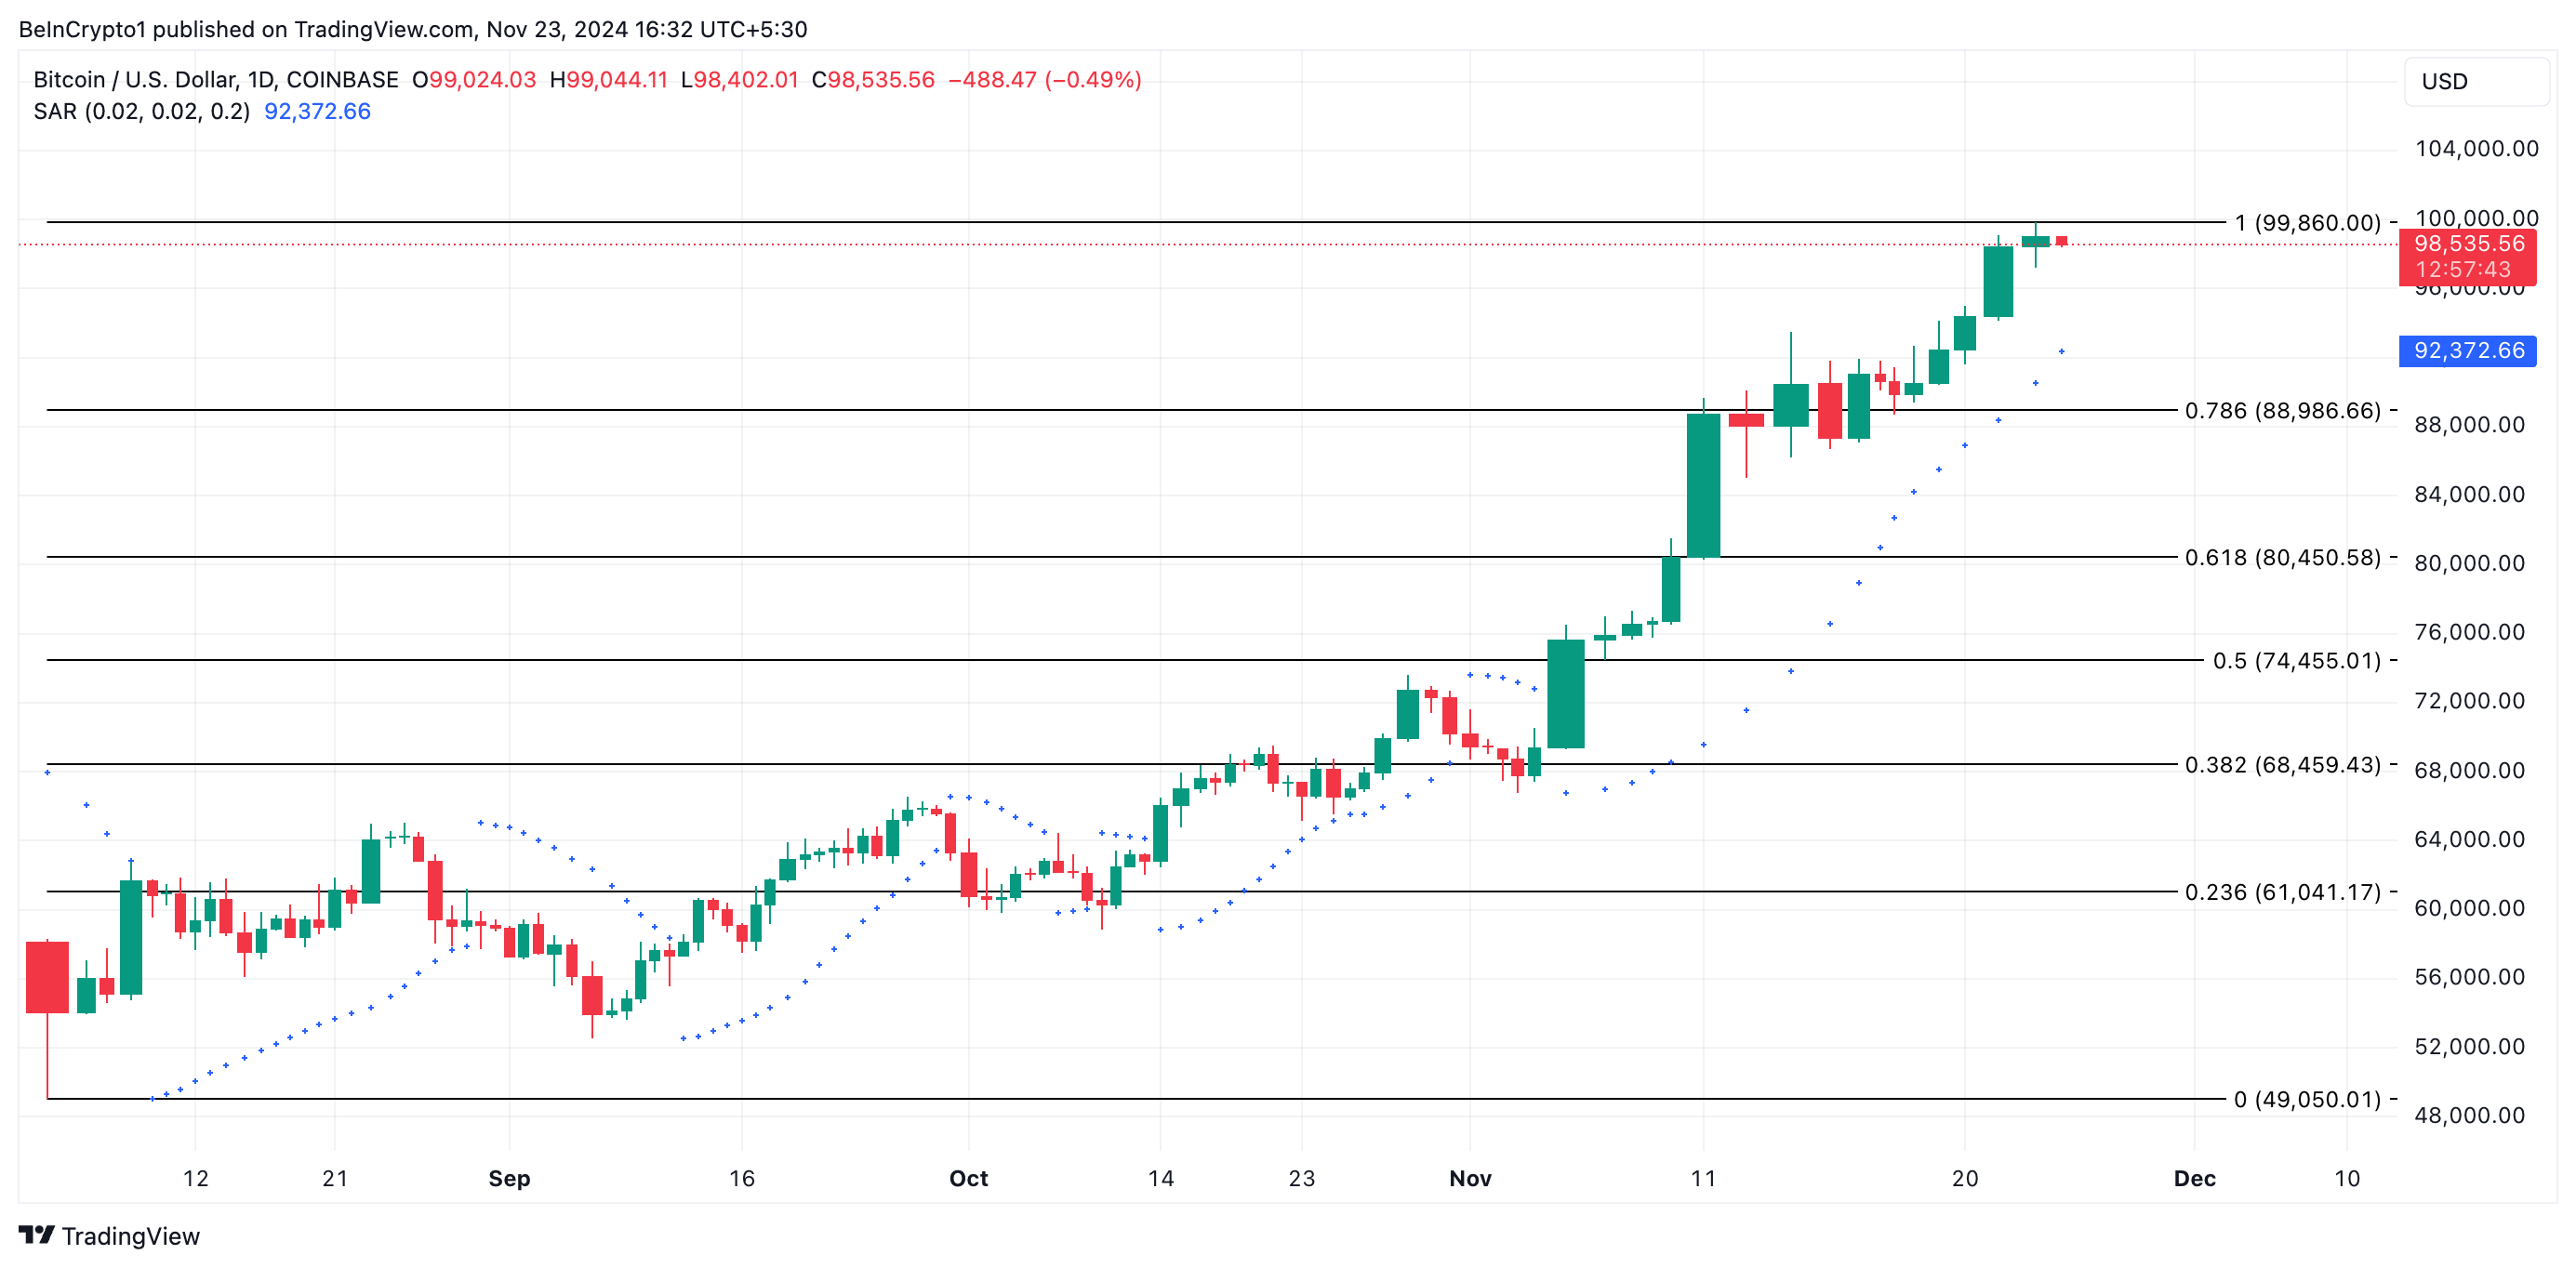
While BTC miners have increased the selling pressure on the coin over the past few weeks, the bullish bias on the king coin remains strong. This is reflected in the positioning of the dots that make up the Parabolic Stop and Reverse (SAR) indicator, which are currently located below BTC's price.
The Parabolic SAR identifies the trend direction and potential reversal points of an asset. When the dots are positioned below the asset's price, it indicates a bullish trend. Traders interpret this as a signal to take long positions and close short positions.

If this trend persists, BTC's price could recover the all-time high of $99,860 and breach the psychological $100,000 barrier. However, if profit-taking activity surges, this bullish outlook could be invalidated. If buying pressure weakens, BTC's price could drop to $88,986.


