On November 23, the price of Solana (SOL) hit an all-time high, sparking speculation that altcoins could rise to $300. Although that did not happen, recent data shows that Solana traders are expecting a rebound.
Why are traders confident? This on-chain analysis explores whether these positions can bring profits or if many traders are at risk of liquidation.
Solana Long/Short Ratio at 1.17... More Bullish Sentiment
According to data from Coinglass, Solana's 1-hour chart Long/Short ratio has risen to 1.17. This ratio measures market sentiment, indicating whether most traders are in a bullish or bearish position.
A ratio below 1 means there are more shorts (sellers) than longs (buyers). Conversely, a ratio above 1 means there are more traders expecting a price increase than those expecting a decrease.
Currently, 54% of Solana traders are holding long positions, while 46.17% are expecting the token to drop below $255. This suggests an optimistic sentiment among traders regarding the token's price appreciation.

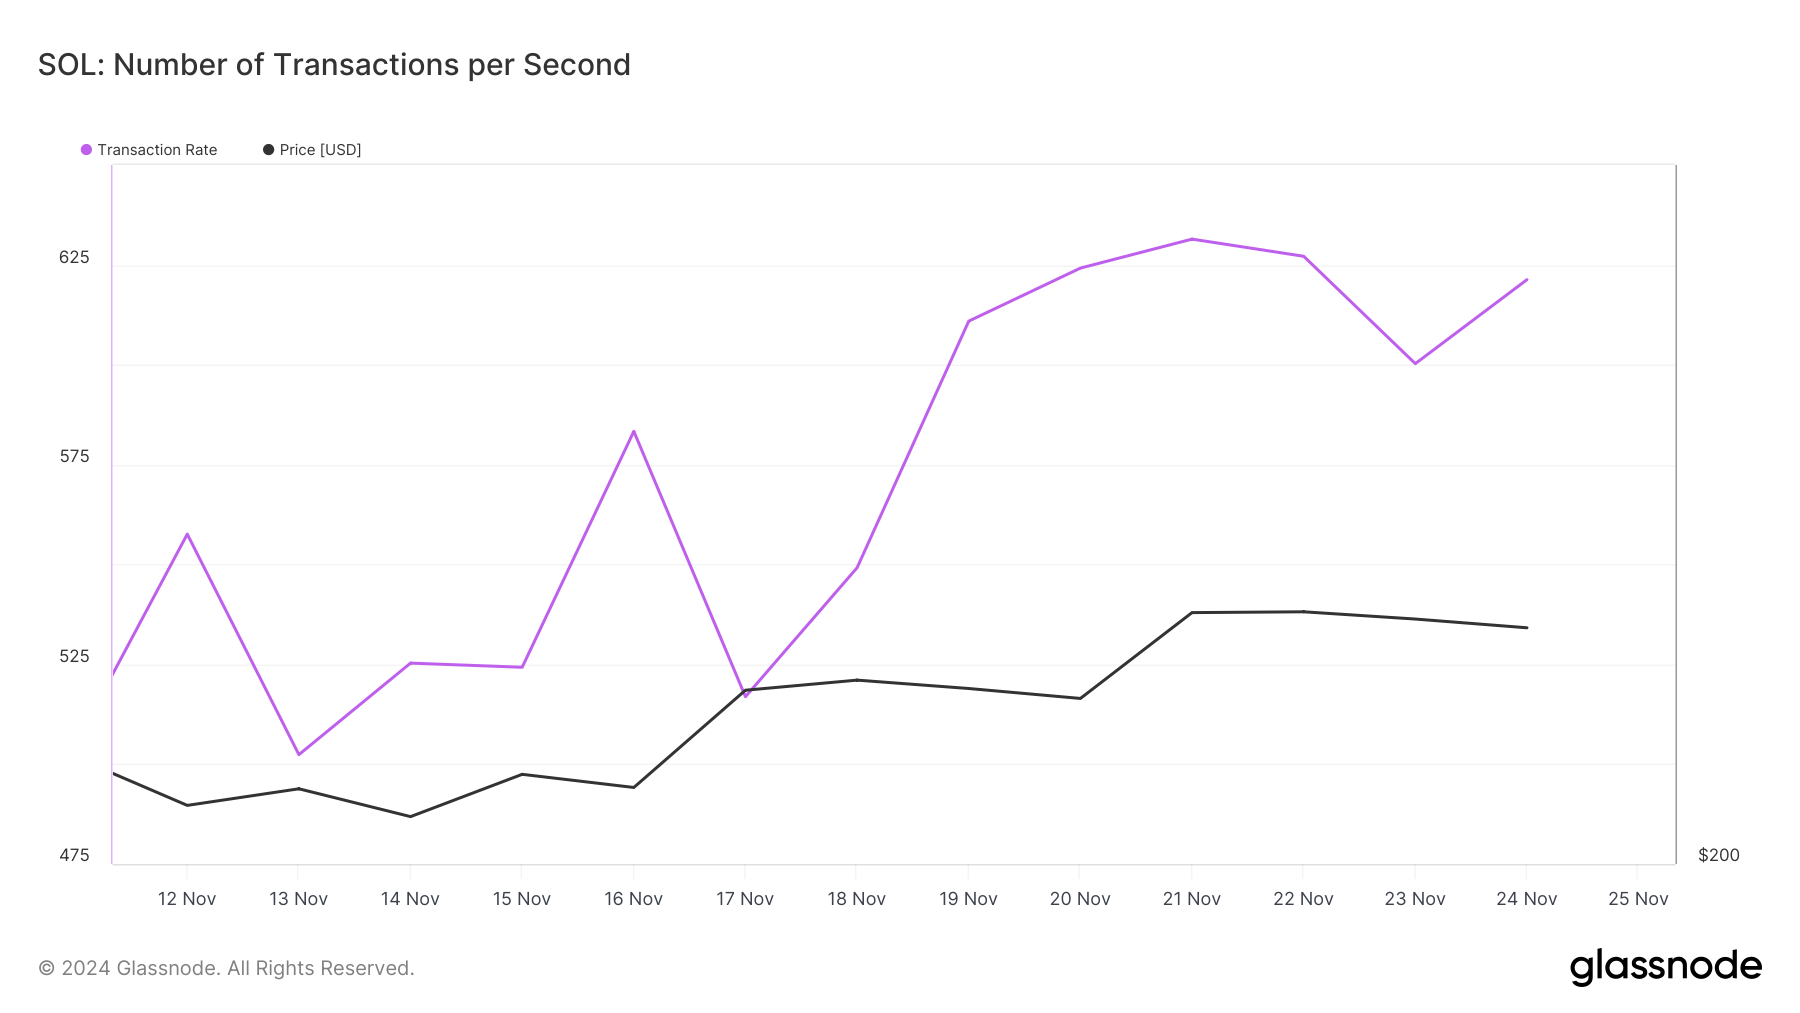
Additionally, the increased transaction rate of Solana suggests that these traders' positions may be profitable. This refers to the successful transactions processed per second on the blockchain.
An increase in transaction rate indicates growing user activity and engagement with the cryptocurrency, while a decrease suggests waning interest. According to glassnode, Solana's transaction rate has been rising. If this trend continues, it could push SOL's price above its all-time high.

SOL Price Prediction: Bullish Flag Pattern... Momentum Alive
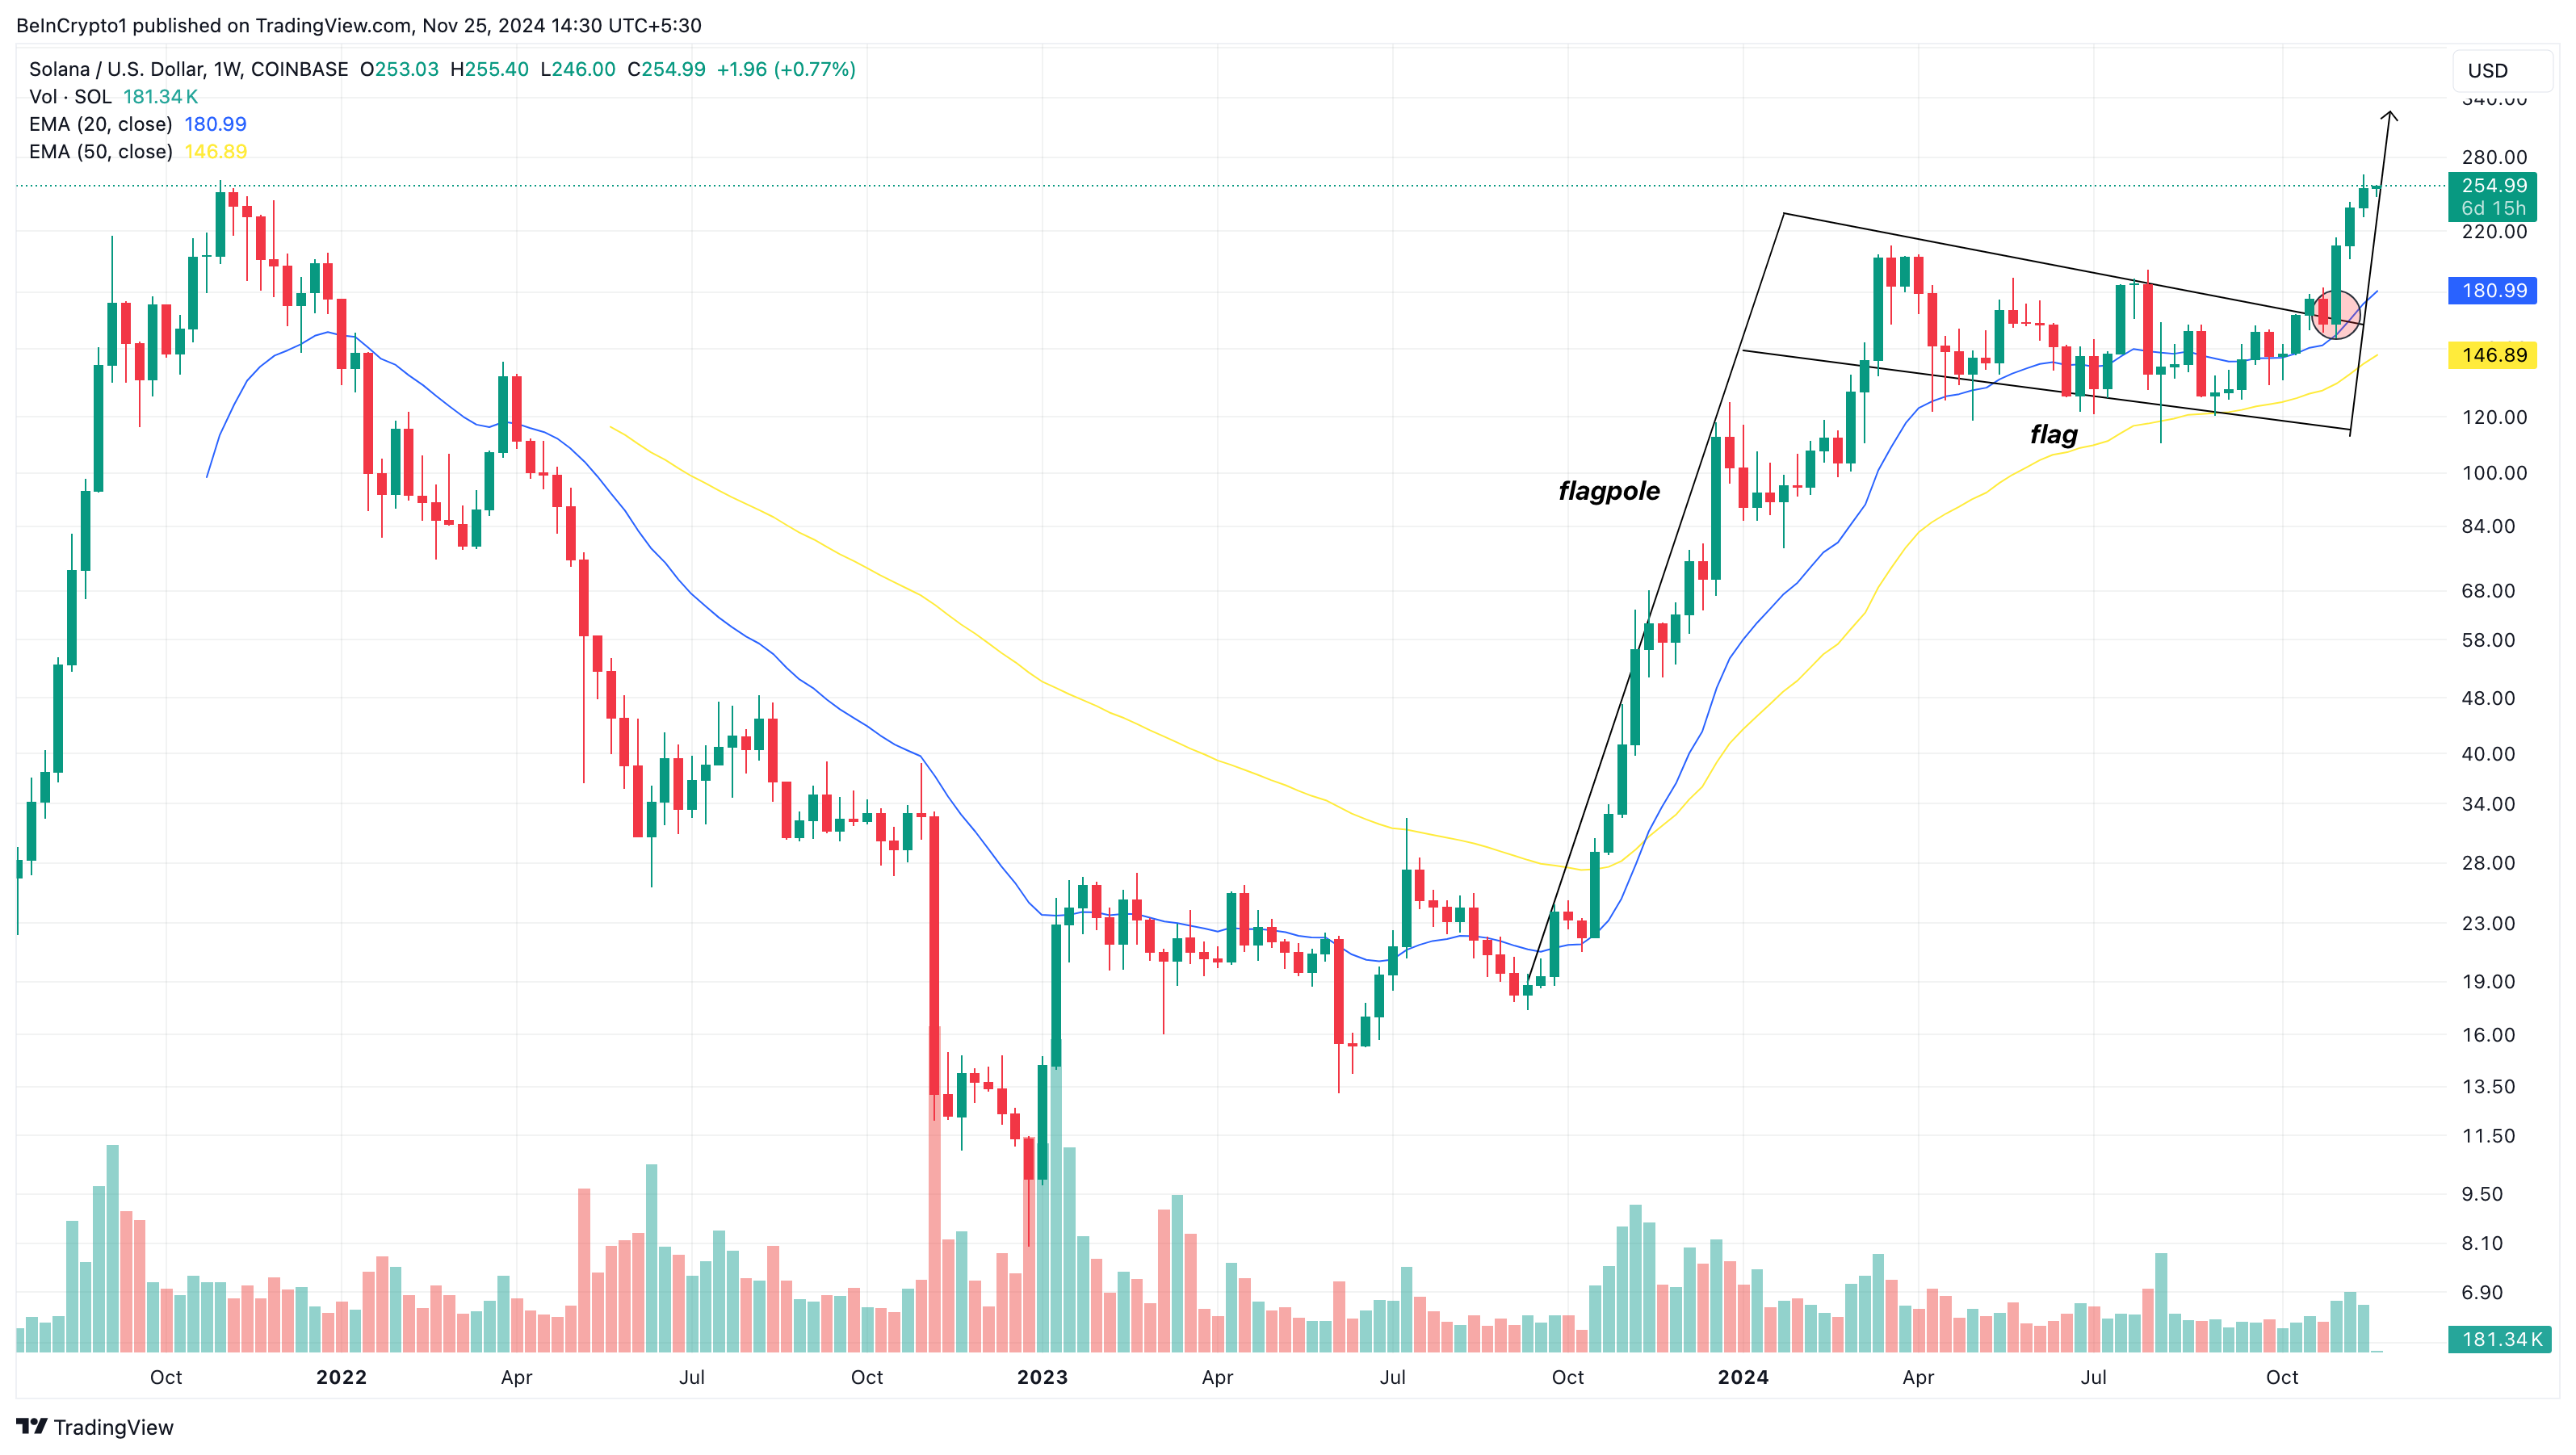
On the weekly chart, Solana's price has crossed above the 20 and 50 Exponential Moving Averages (EMAs). These are key indicators for measuring trend. Prices above the EMAs suggest an uptrend, while below them indicate a downtrend.
Currently, SOL's price is at $255, positioned above both EMAs, indicating the altcoin is likely to continue its upward momentum. The formation of a bullish flag pattern further supports this bullish outlook.
A bullish flag is a continuation pattern that has a high probability of maintaining the previous upward momentum if the price breaks out. As seen below, SOL has already broken out of the corrective pattern and is heading towards higher prices.

As long as the price remains above the top trend line of the corrective phase, it can potentially reach $325. However, if selling pressure emerges, this bullish scenario may change, and SOL could decline below $200.


