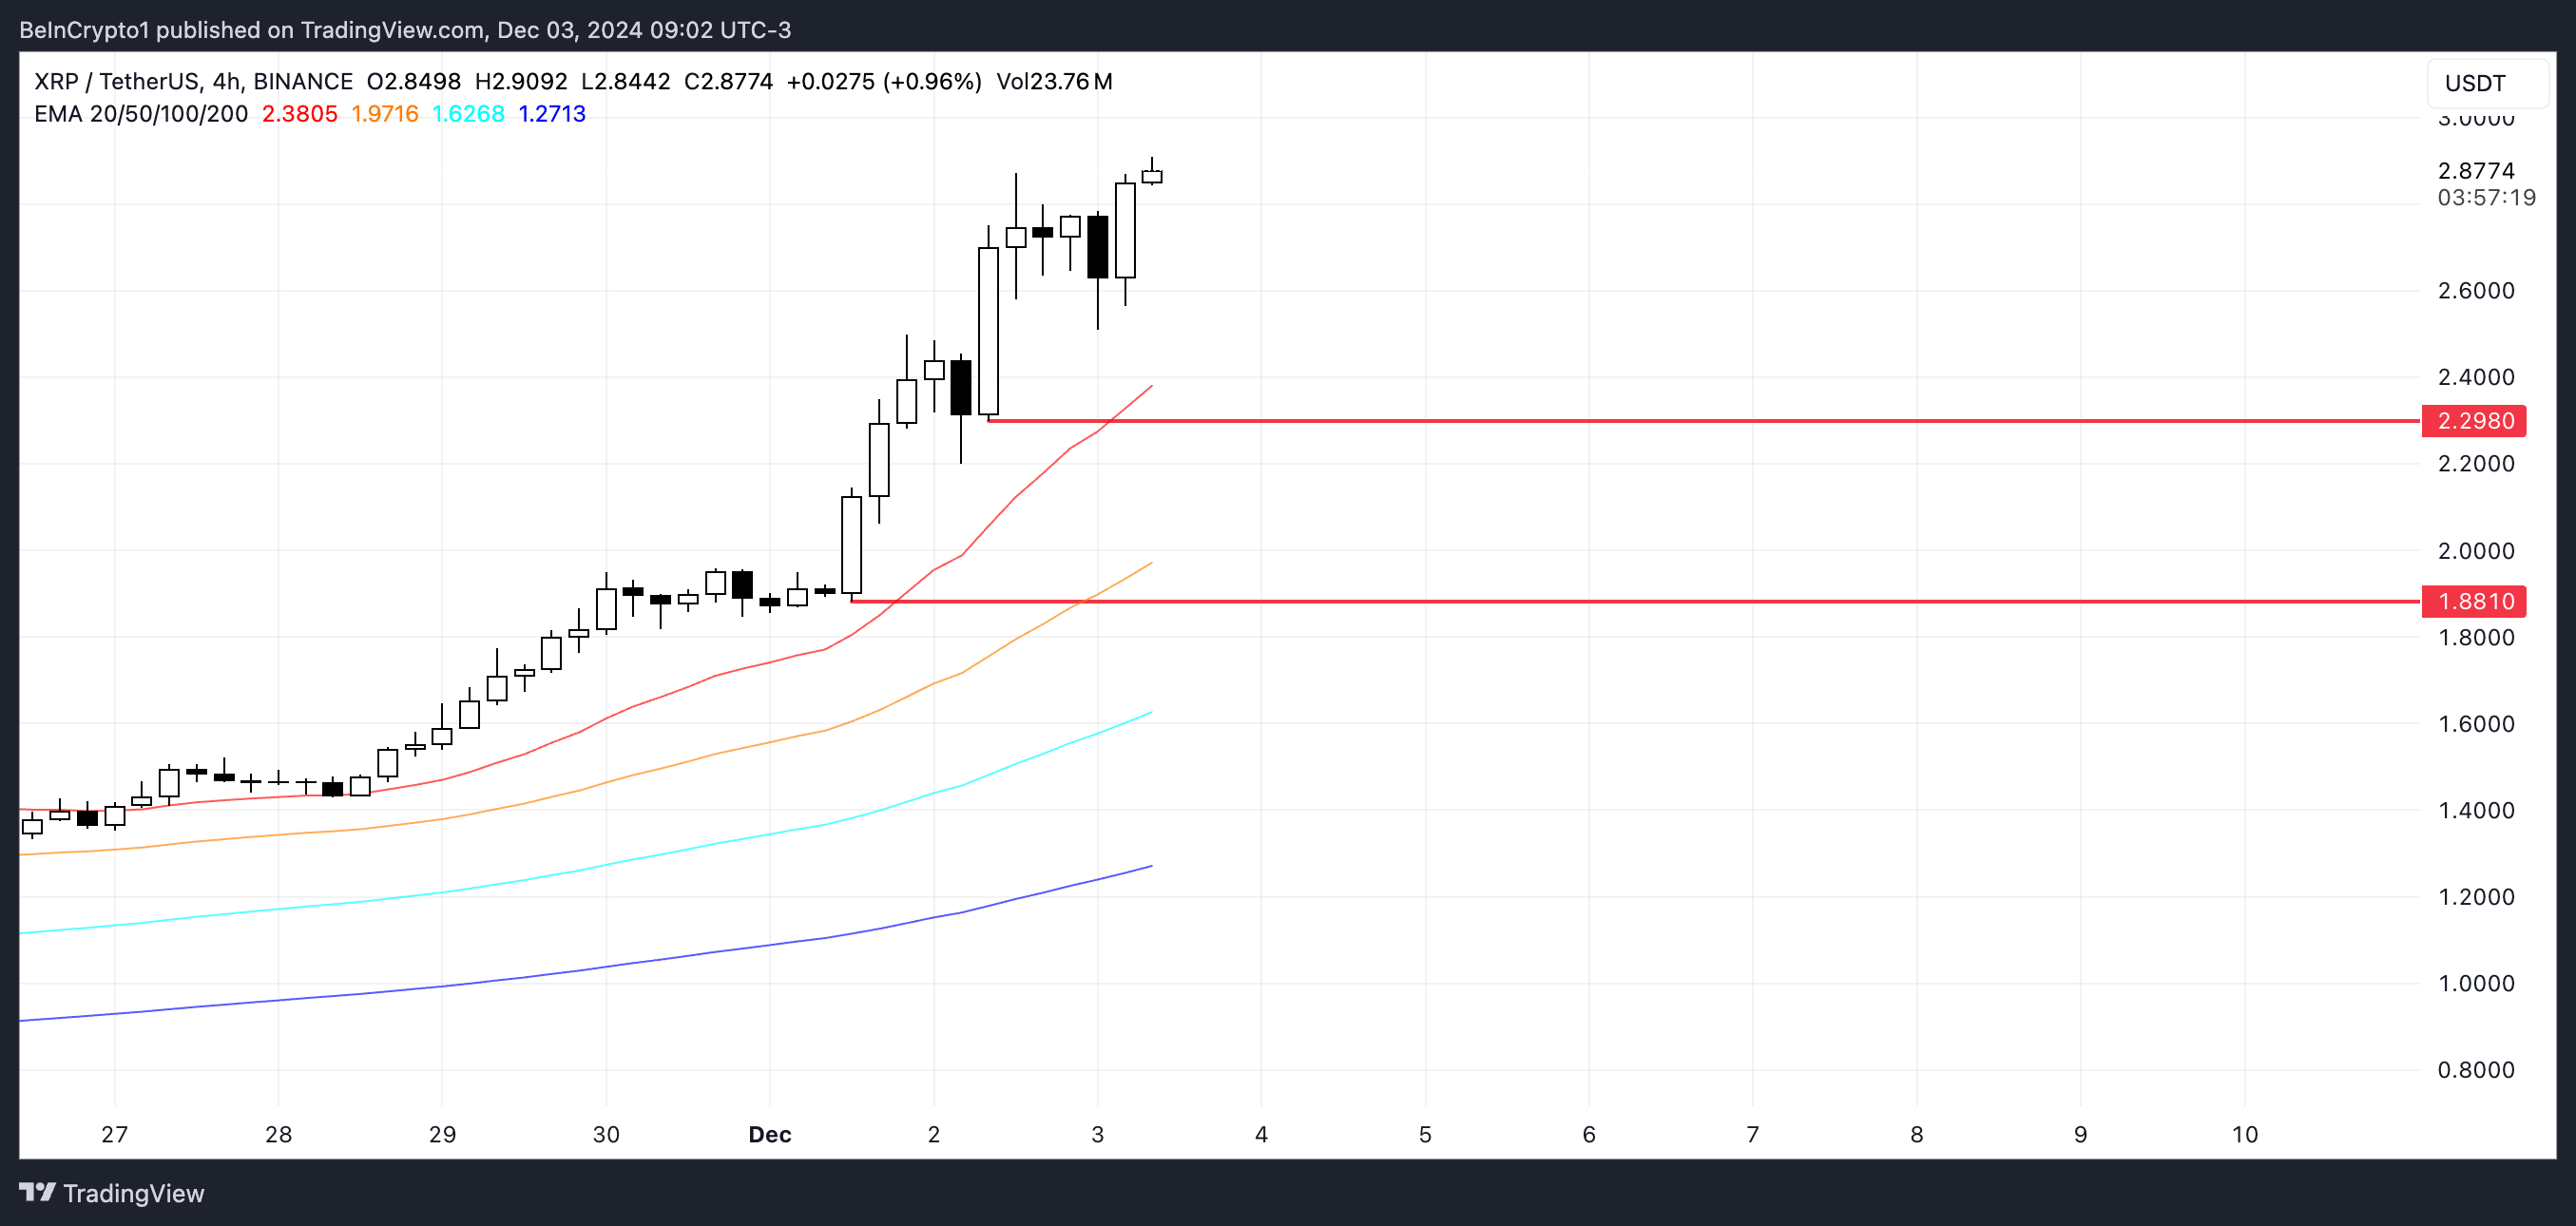
The price of XRP has surged to its highest level in 6 years. Optimism about the coin ecosystem has achieved a new milestone. This coin has risen by about 450% in the past 30 days, making it one of the best performing cryptocurrencies in the market.
This remarkable price movement occurred as the technical indicators showed strong upward momentum. However, some indicators suggest the potential for a correction.
XRP RSI still above 70... Overbought zone
The Relative Strength Index (RSI) of XRP has remained in the overbought state above 70 since the end of November. It recorded a peak close to 90 before falling to 71.5 recently. This persistent overbought zone coincides with the substantial price surge of Ripple, reflecting the strong bullish momentum that has dominated the market for several weeks.
RSI is a momentum indicator that measures the speed and magnitude of price movements on a scale of 0 to 100. Readings above 70 generally indicate an overbought state, while readings below 30 indicate an oversold state.

While the XRP RSI remains in the overbought zone at 71.5, the gradual decline from the near-90 peak may indicate that buying pressure is starting to ease. However, this does not necessarily predict an immediate reversal of the uptrend, as assets can maintain an overbought state during a strong rally.
The decreasing RSI may suggest a potential correction phase or a more sustainable pace of growth, rather than a definitive end to the current uptrend.
Ripple CMF positive for 4 consecutive days
The Chaikin Money Flow (CMF) has maintained a strong positive value of 0.34 for XRP, extending the bullish momentum since November 29th.
CMF is generally a 20-day volume-weighted average of the accumulation/distribution, helping to measure buying and selling pressure. A value above 0 indicates net buying pressure, while a negative value indicates selling pressure.

The high CMF value of 0.34 for XRP indicates significant buying pressure and institutional interest, supporting the current uptrend. This high positive value suggests that the majority of trading volume has occurred at higher prices compared to previous periods, reinforcing the bullish sentiment.
The CMF maintaining a significantly positive state lends support to the continuation of the uptrend.
XRP Price Prediction: Will it reach $3 in December?
The XRP EMA (Exponential Moving Average) lines are showing a strong bullish structure, with the faster EMA above the slower EMA and the price comfortably trading above the shortest EMA. As the uptrend continues, XRP is facing the crucial psychological and historical target of $3.00.
Beyond that, the all-time high of $3.18 emerges as the next major resistance, representing a potential upside of around 18.5% from the current XRP price.

However, the uptrend comes with downside risks that traders should consider. Key support levels have formed at $2.29 and $1.88, which could serve as potential correction targets if the momentum weakens.
A correction to these levels would represent a significant pullback of up to 32% for XRP price, but such corrections are common occurrences even within a sustained uptrend.


