The price of Ripple (XRP) has shown significant movement recently, reaching its highest level since 2018 with a notable surge in November. Currently, if it rises by about 3% in market capitalization, XRP will surpass Tether (USDT) to become the third-largest cryptocurrency.
After the strong performance last month, XRP has undergone a slight correction, declining by 2% over the past week. Technical indicators suggest a balance between bullish and bearish momentum.
XRP RSI Currently Neutral
Ripple's price has reached its highest level since 2018, but it has declined by 2% over the past week. During the December surge, the Relative Strength Index (RSI) remained above 70 for several days, indicating an overbought state driven by strong bullish momentum.

Currently, the XRP RSI is at 46.3, indicating a neutral momentum. RSI is a key technical indicator that measures the speed and magnitude of price changes on a scale of 0 to 100.
Levels above 70 indicate an overbought state, while levels below 30 suggest an oversold condition. With XRP's RSI near the midpoint, the asset is not in a strong bullish or bearish trend, and there may be room for price fluctuations in the coming days.
Ripple CMF Still Negative, but Recovering
The XRP Chaikin Money Flow (CMF) is currently at -0.01, recovering from -0.13 two days ago. This improvement suggests a decrease in selling pressure, and the flow of funds into XRP has become more balanced after the outflow.
While still slightly negative, this change indicates a more stable market sentiment.

CMF combines price and volume data to measure buying and selling pressure. A value above 0 indicates strong buying pressure, while negative values suggest selling dominance. From November 28 to December 5, the Ripple CMF was highly positive, peaking at 0.37 on December 1, reflecting significant bullish activity during that period.
With the CMF currently at -0.01, near the neutral zone, the XRP price may see limited movements in the short term, and significant fluctuations are unlikely unless a decisive new buying or selling momentum emerges.
XRP Price Prediction: $2.17 Support Crucial
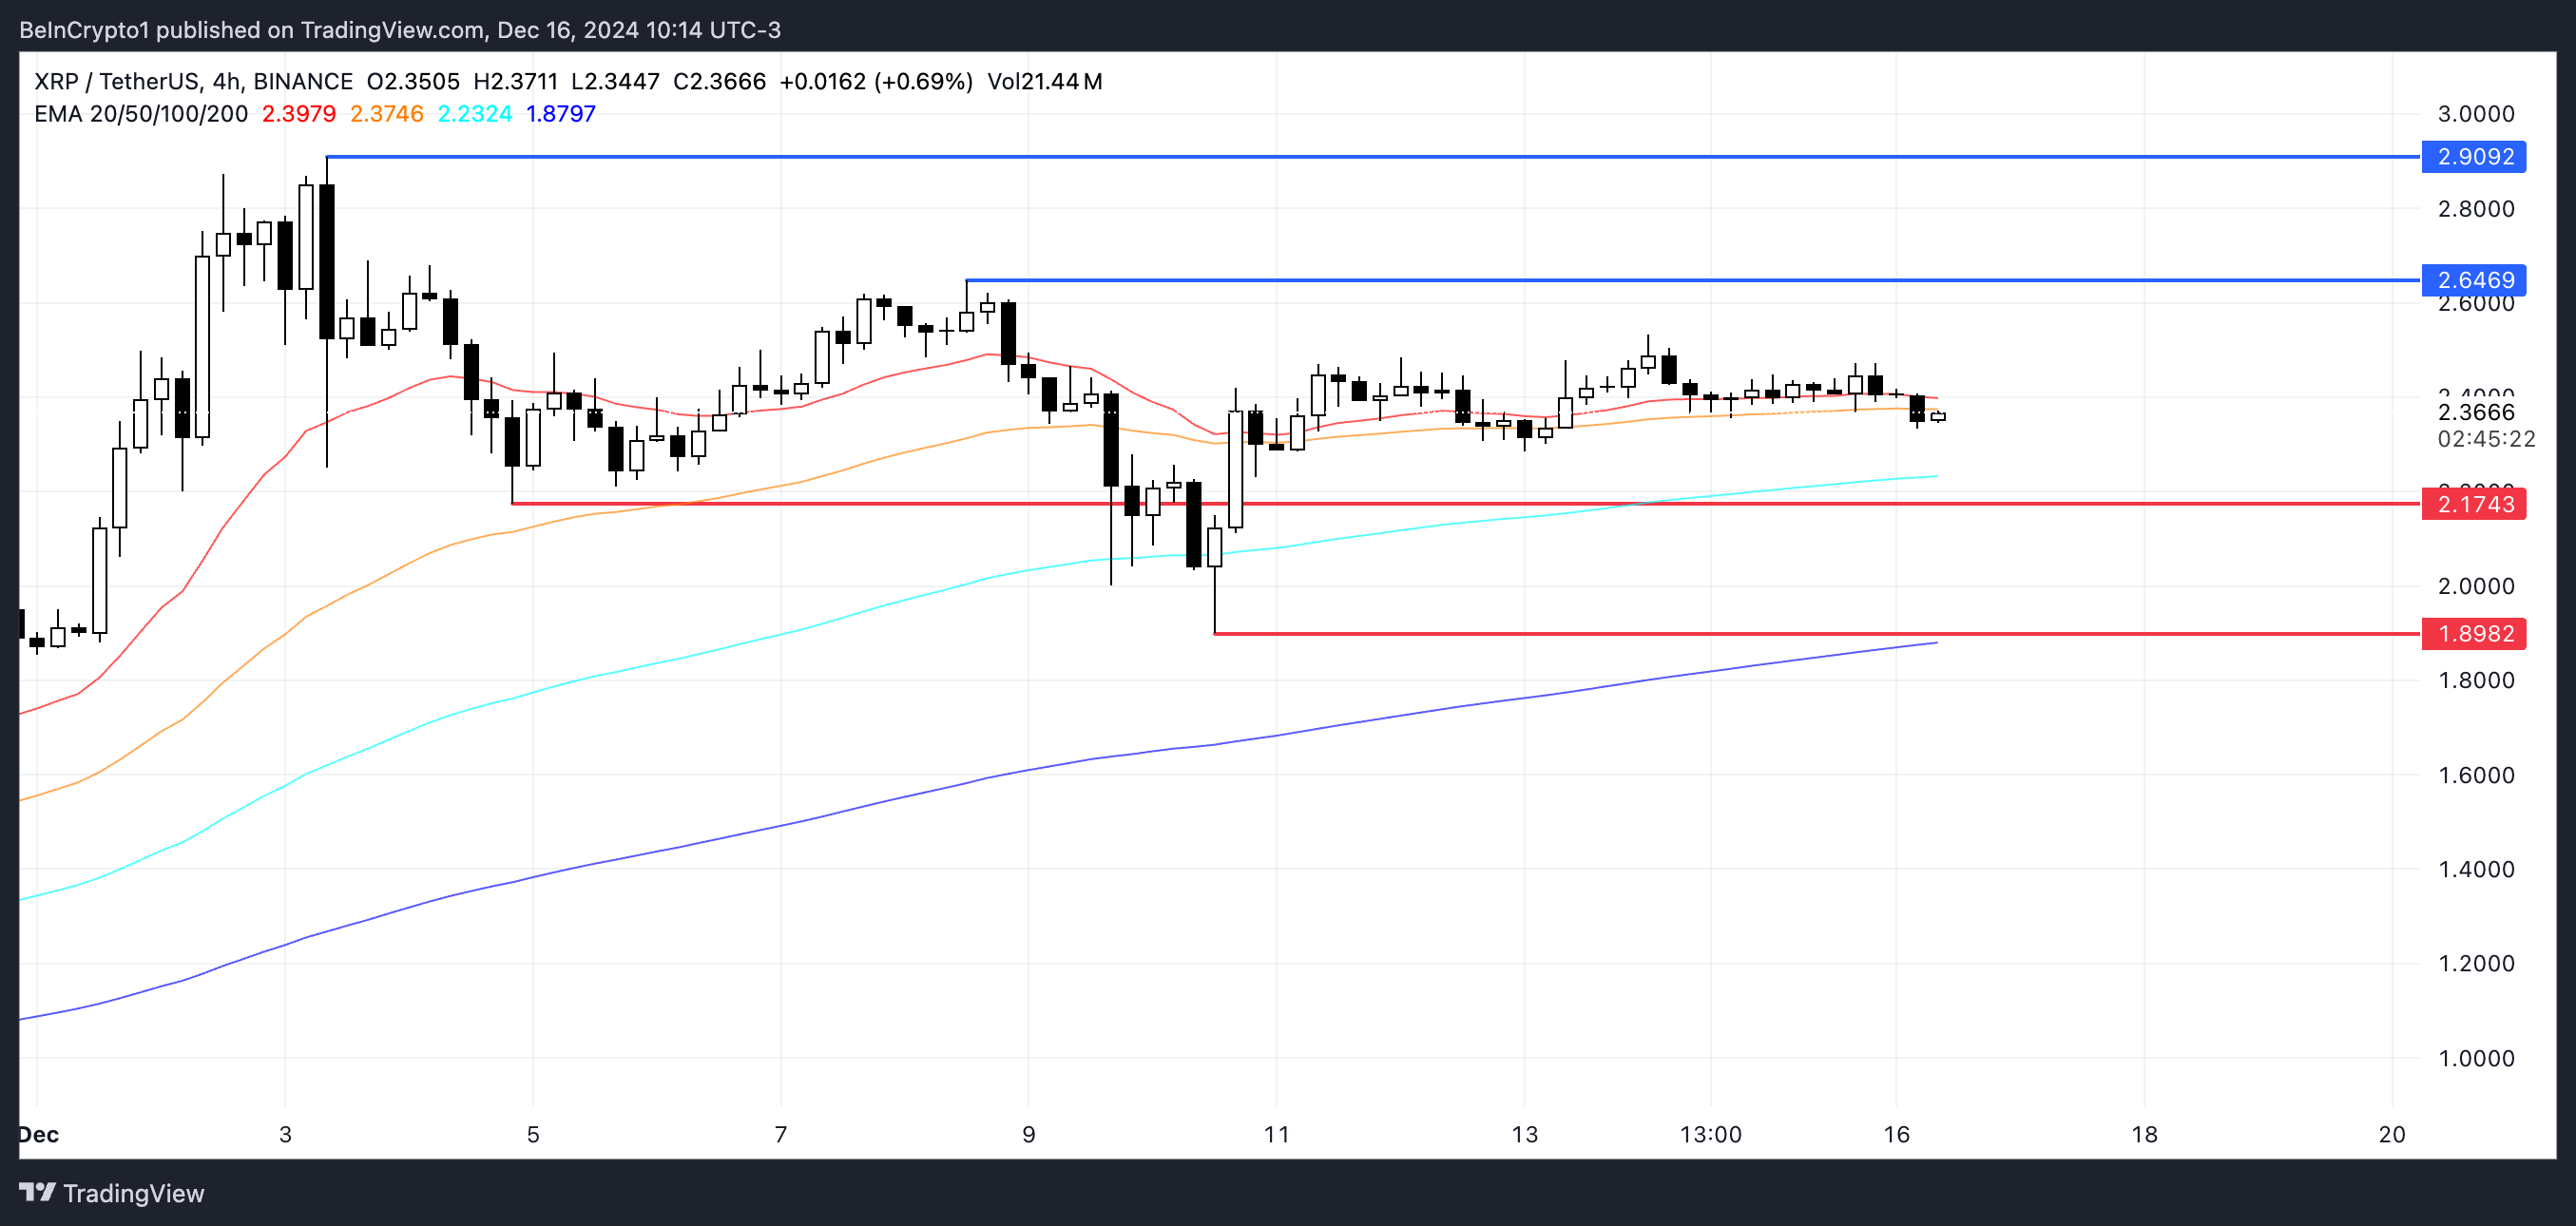
The XRP EMA lines indicate a price correction, with the short-term average still higher than the long-term average, but the gap is narrowing. This suggests that the bullish momentum is weakening, and an increase in selling pressure could lead to a downward trend.
In this scenario, the XRP price may test the $2.17 support level, and if this initial support fails, it could further decline to $1.89.

Conversely, a recovery of the bullish momentum could see Ripple's price challenge the $2.64 resistance level. If this level is breached, a potential move to $2.90 could strengthen the bullish sentiment.
The narrowing of the EMA lines highlights a critical moment for XRP, and its future movements will depend on whether buyers or sellers gain the upper hand.


