The price of Dogwifhat (WIF) reached its highest level since March 2024 at the beginning of this month. This reflects an amazing annual increase of 1386%. However, WIF has entered a correction and has fallen by about 11% in the last 24 hours. This indicates that the bearish signals are strengthening.
Momentum indicators such as the Ichimoku Cloud and ADX are showing a strong downtrend, and the sellers are firmly in control of the market. Whether WIF can maintain key support levels or have the resilience to test resistance zones will determine the short-term path.
Dogwifhat Ichimoku Cloud Signals Strong Bearishness
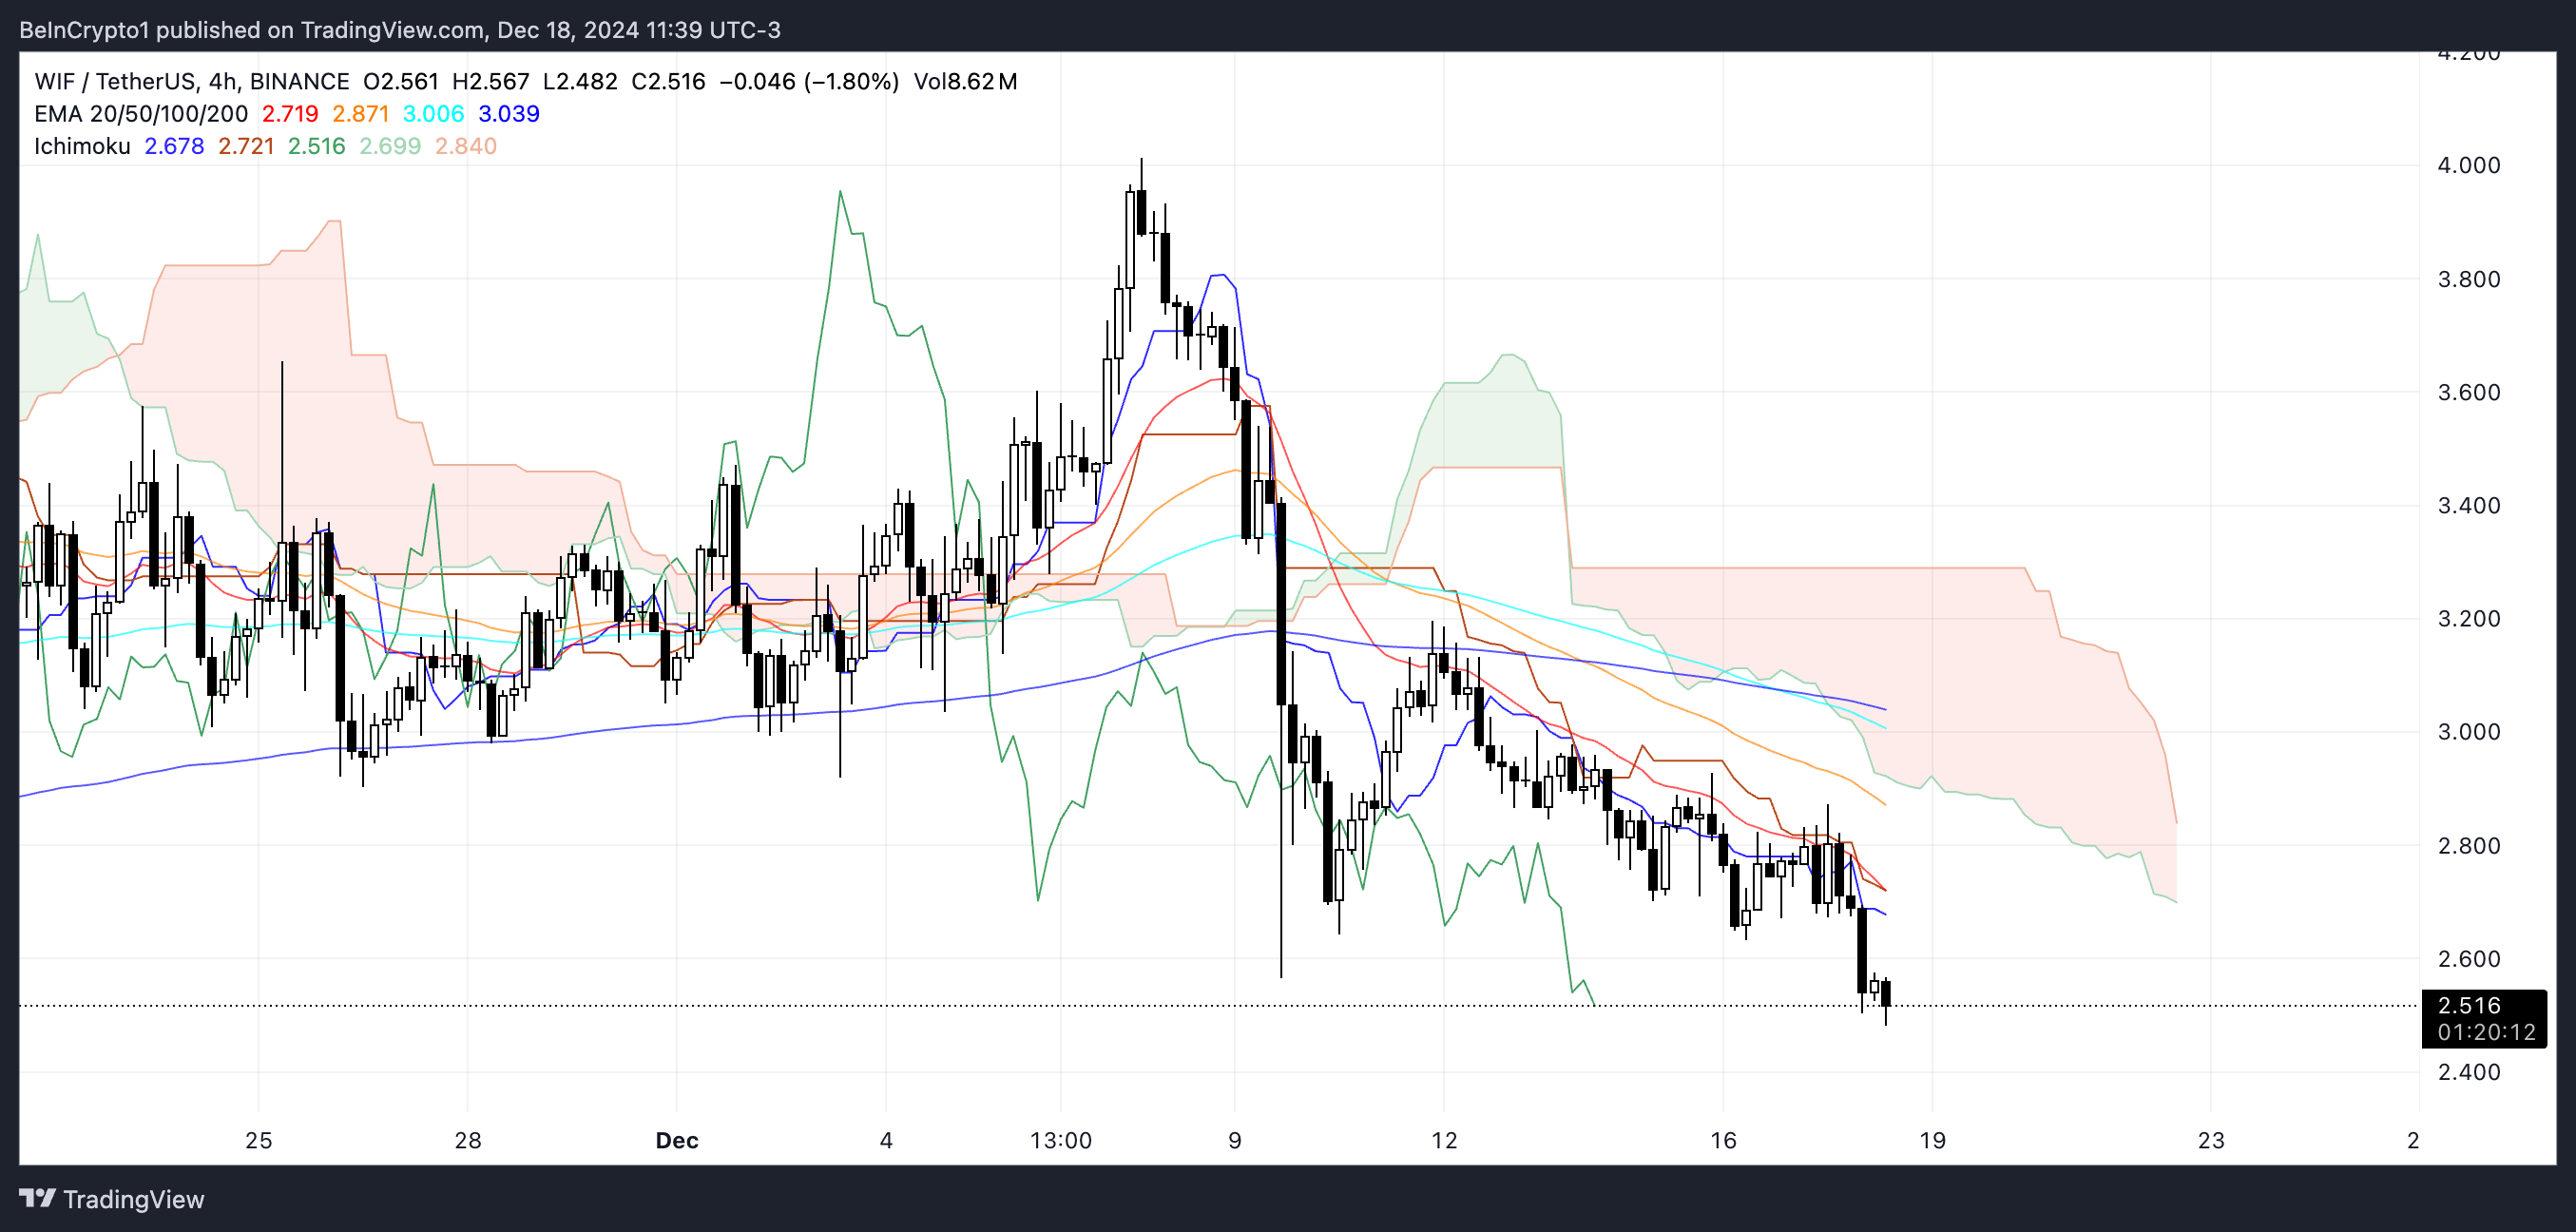
The WIF Ichimoku Cloud chart shows a clear downtrend. The price has fallen below the Kumo Cloud and all major Ichimoku components. The Conversion Line (blue) has crossed below the Base Line (red), generating a bearish signal. The Lagging Span, shown in green, has also moved significantly below the price, indicating strong bearish momentum.
Since early December, the price movement has consistently recorded lower highs and lower lows. The recent movements have shown an aggressive decline.

In early December, the cloud structure changed from a supportive green bullish cloud to a bearish red cloud. The Senkou Span A (red) has crossed below the Senkou Span B (orange). This change in cloud color and expansion suggests that bearish pressure is increasing.
The price is trading below the cloud, and all Ichimoku components are currently aligned above the current price. The Conversion Line, Base Line, and both Cloud Spans all suggest the continuation of a strong downtrend. The downtrend is likely to continue unless the price at least recovers to the Conversion Line level.
WIF ADX, Currently Strengthening Bearishness
The WIF ADX is currently at 38, up from 36 yesterday. This indicates a strong and growing trend. However, with WIF in a downtrend, the rising ADX suggests that the bearish momentum is strengthening. This implies that the downward movement is likely to continue. The sellers are maintaining a dominant position in the market.

The ADX (Average Directional Index) measures the strength of a price trend, but does not indicate the direction. An ADX above 25 indicates a strong trend, while 20 or below indicates a weak or non-trending market.
With Dogwifhat ADX at 38 and currently in a downtrend, the price may face additional downside in the short term, unless buying activity offsets the bearish momentum. If the selling persists, WIF price may continue to decline before finding stability.
Dogwifhat Price Prediction: Will it Recover to $4 by Year-End?
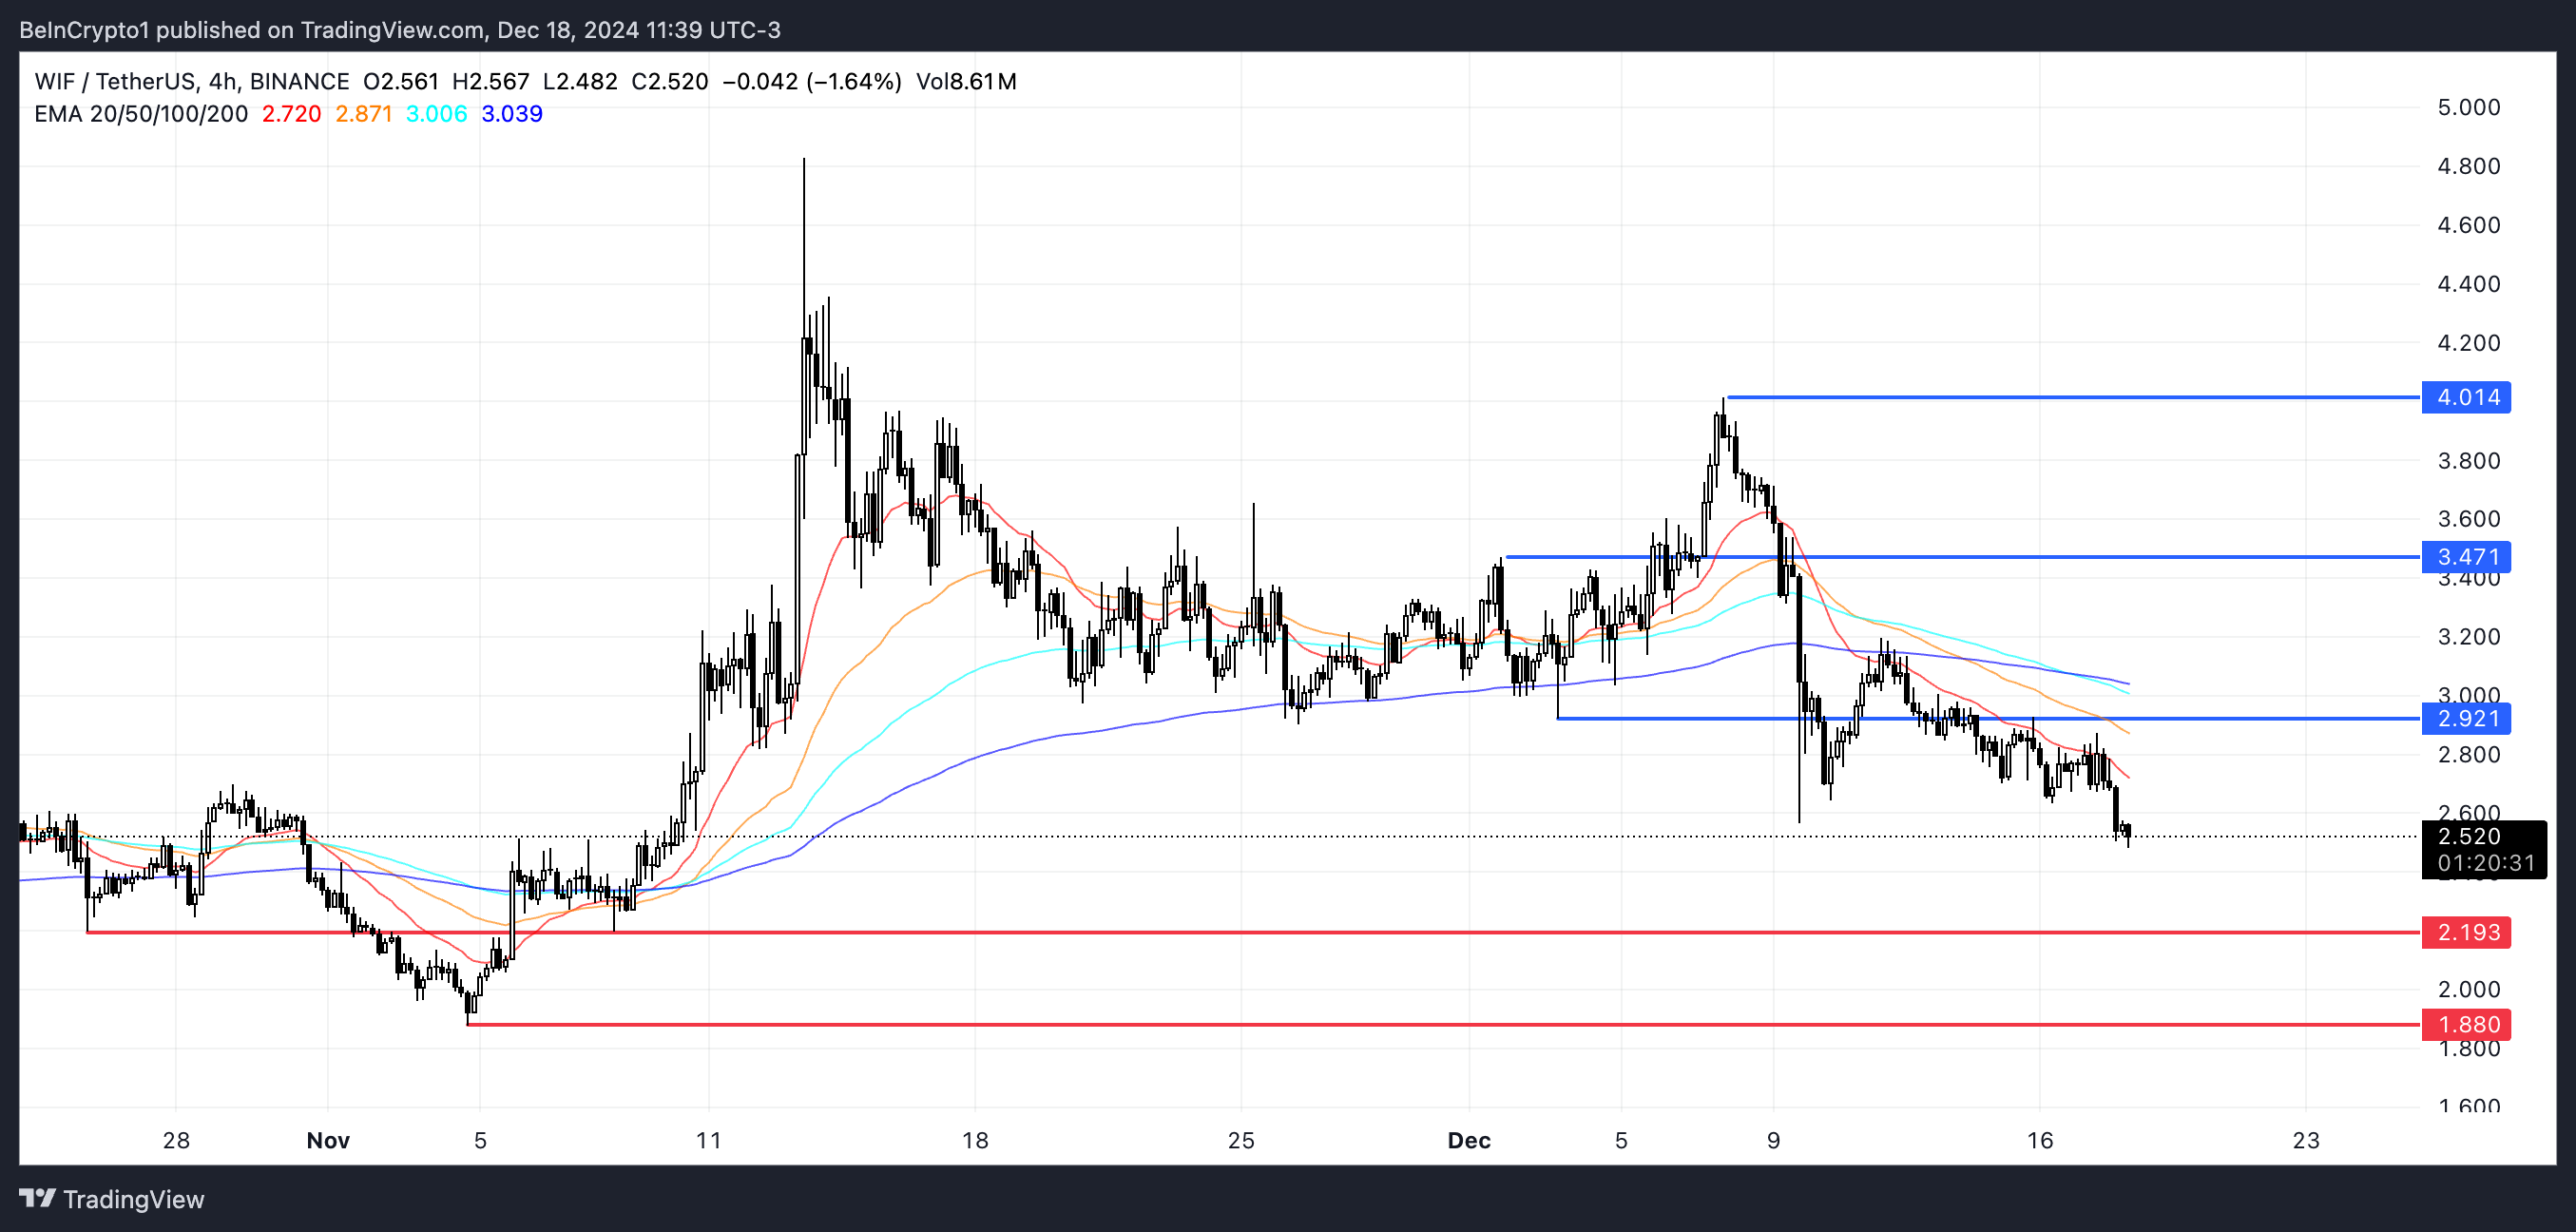
The WIF EMA (Exponential Moving Average) lines are currently showing a bearish configuration. The short-term EMA is below the long-term EMA. This setup suggests persistent downward pressure, and WIF is likely to test the $2.19 support level.
If this level is not maintained, WIF price may decline further and potentially reach the next major support at $1.88.

On the other hand, if WIF price can reverse the downtrend and regain positive momentum, it may challenge the $2.91 resistance level.
Successfully breaking above this level could open the door for further upside. The targets are $3.47, and if the uptrend strengthens, it could reach $4.


