Before Federal Reserve Chairman Jerome Powell announced a 25 basis point (bps) rate cut, Ethereum (ETH) holders were optimistic that this event would trigger a rally to $4,500. However, the rate cut did not bring the expected bullish result, and ETH subsequently fell by 4.50%.
This decline has dampened hopes for a notable breakout, and raises questions about Ethereum's next moves.
Ethereum Reacts Differently to the Latest Rate Cut
A few months ago, the Fed cut rates by 50bps. This development triggered a notable rally in cryptocurrency prices, including Ethereum. At the time, there were expectations of a similar rate cut before the end of the year. However, this did not materialize.
After yesterday's rate decision, the price of ETH fell from $3,890 to $3,624. Cryptocurrencies have recovered slightly, but several on-chain indicators suggest the attempted rebound may be fake.
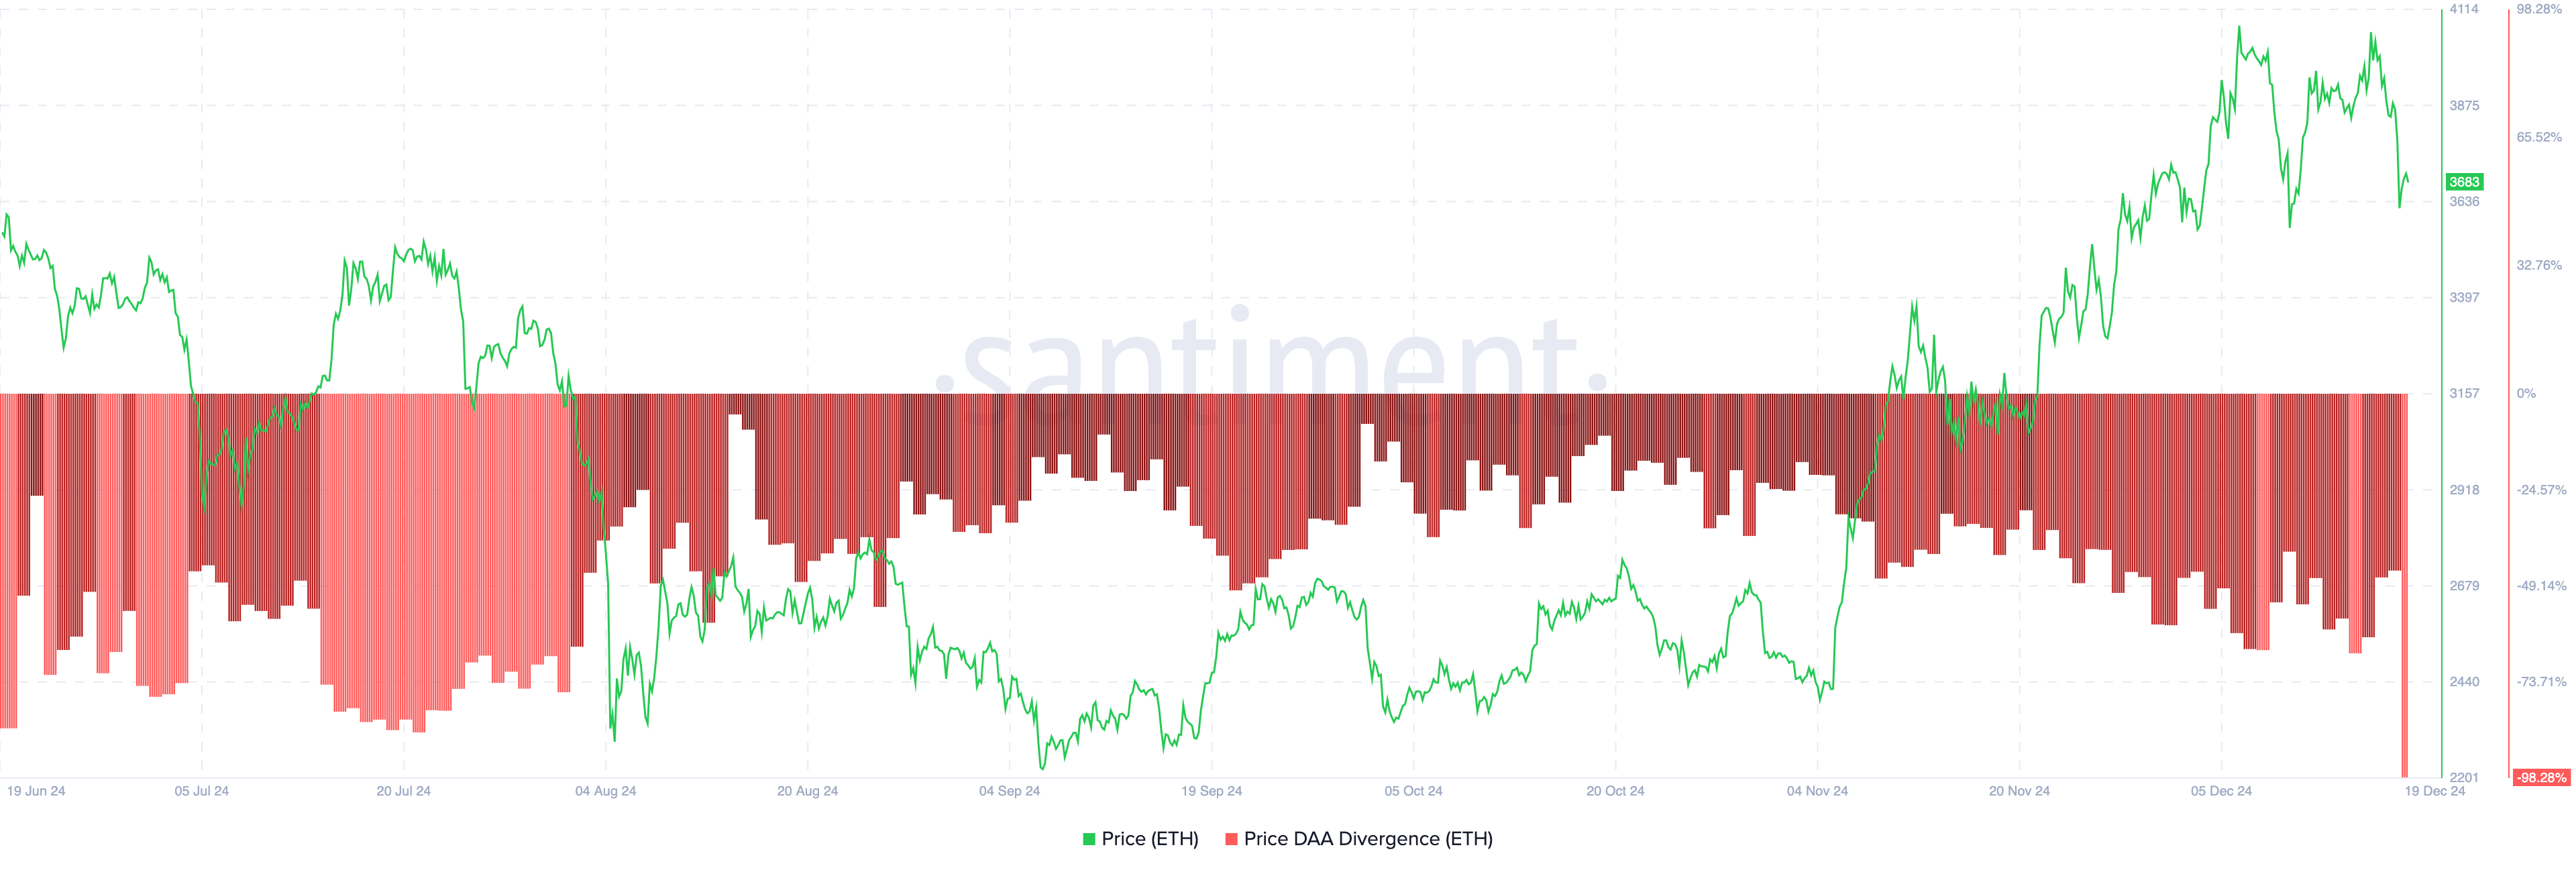
One indicator suggesting this is the price-daily active addresses (DAA) divergence. The price DAA divergence checks whether user engagement is increasing along with the price. When positive, it means cryptocurrency participation has increased, and it is bullish for the price.

Conversely, a negative reading indicates low interaction, which is bearish. According to Santiment, Ethereum's price DAA divergence has decreased by -98.28%, indicating a decline in user participation. If this trend continues, ETH's price could face a steeper price decline.
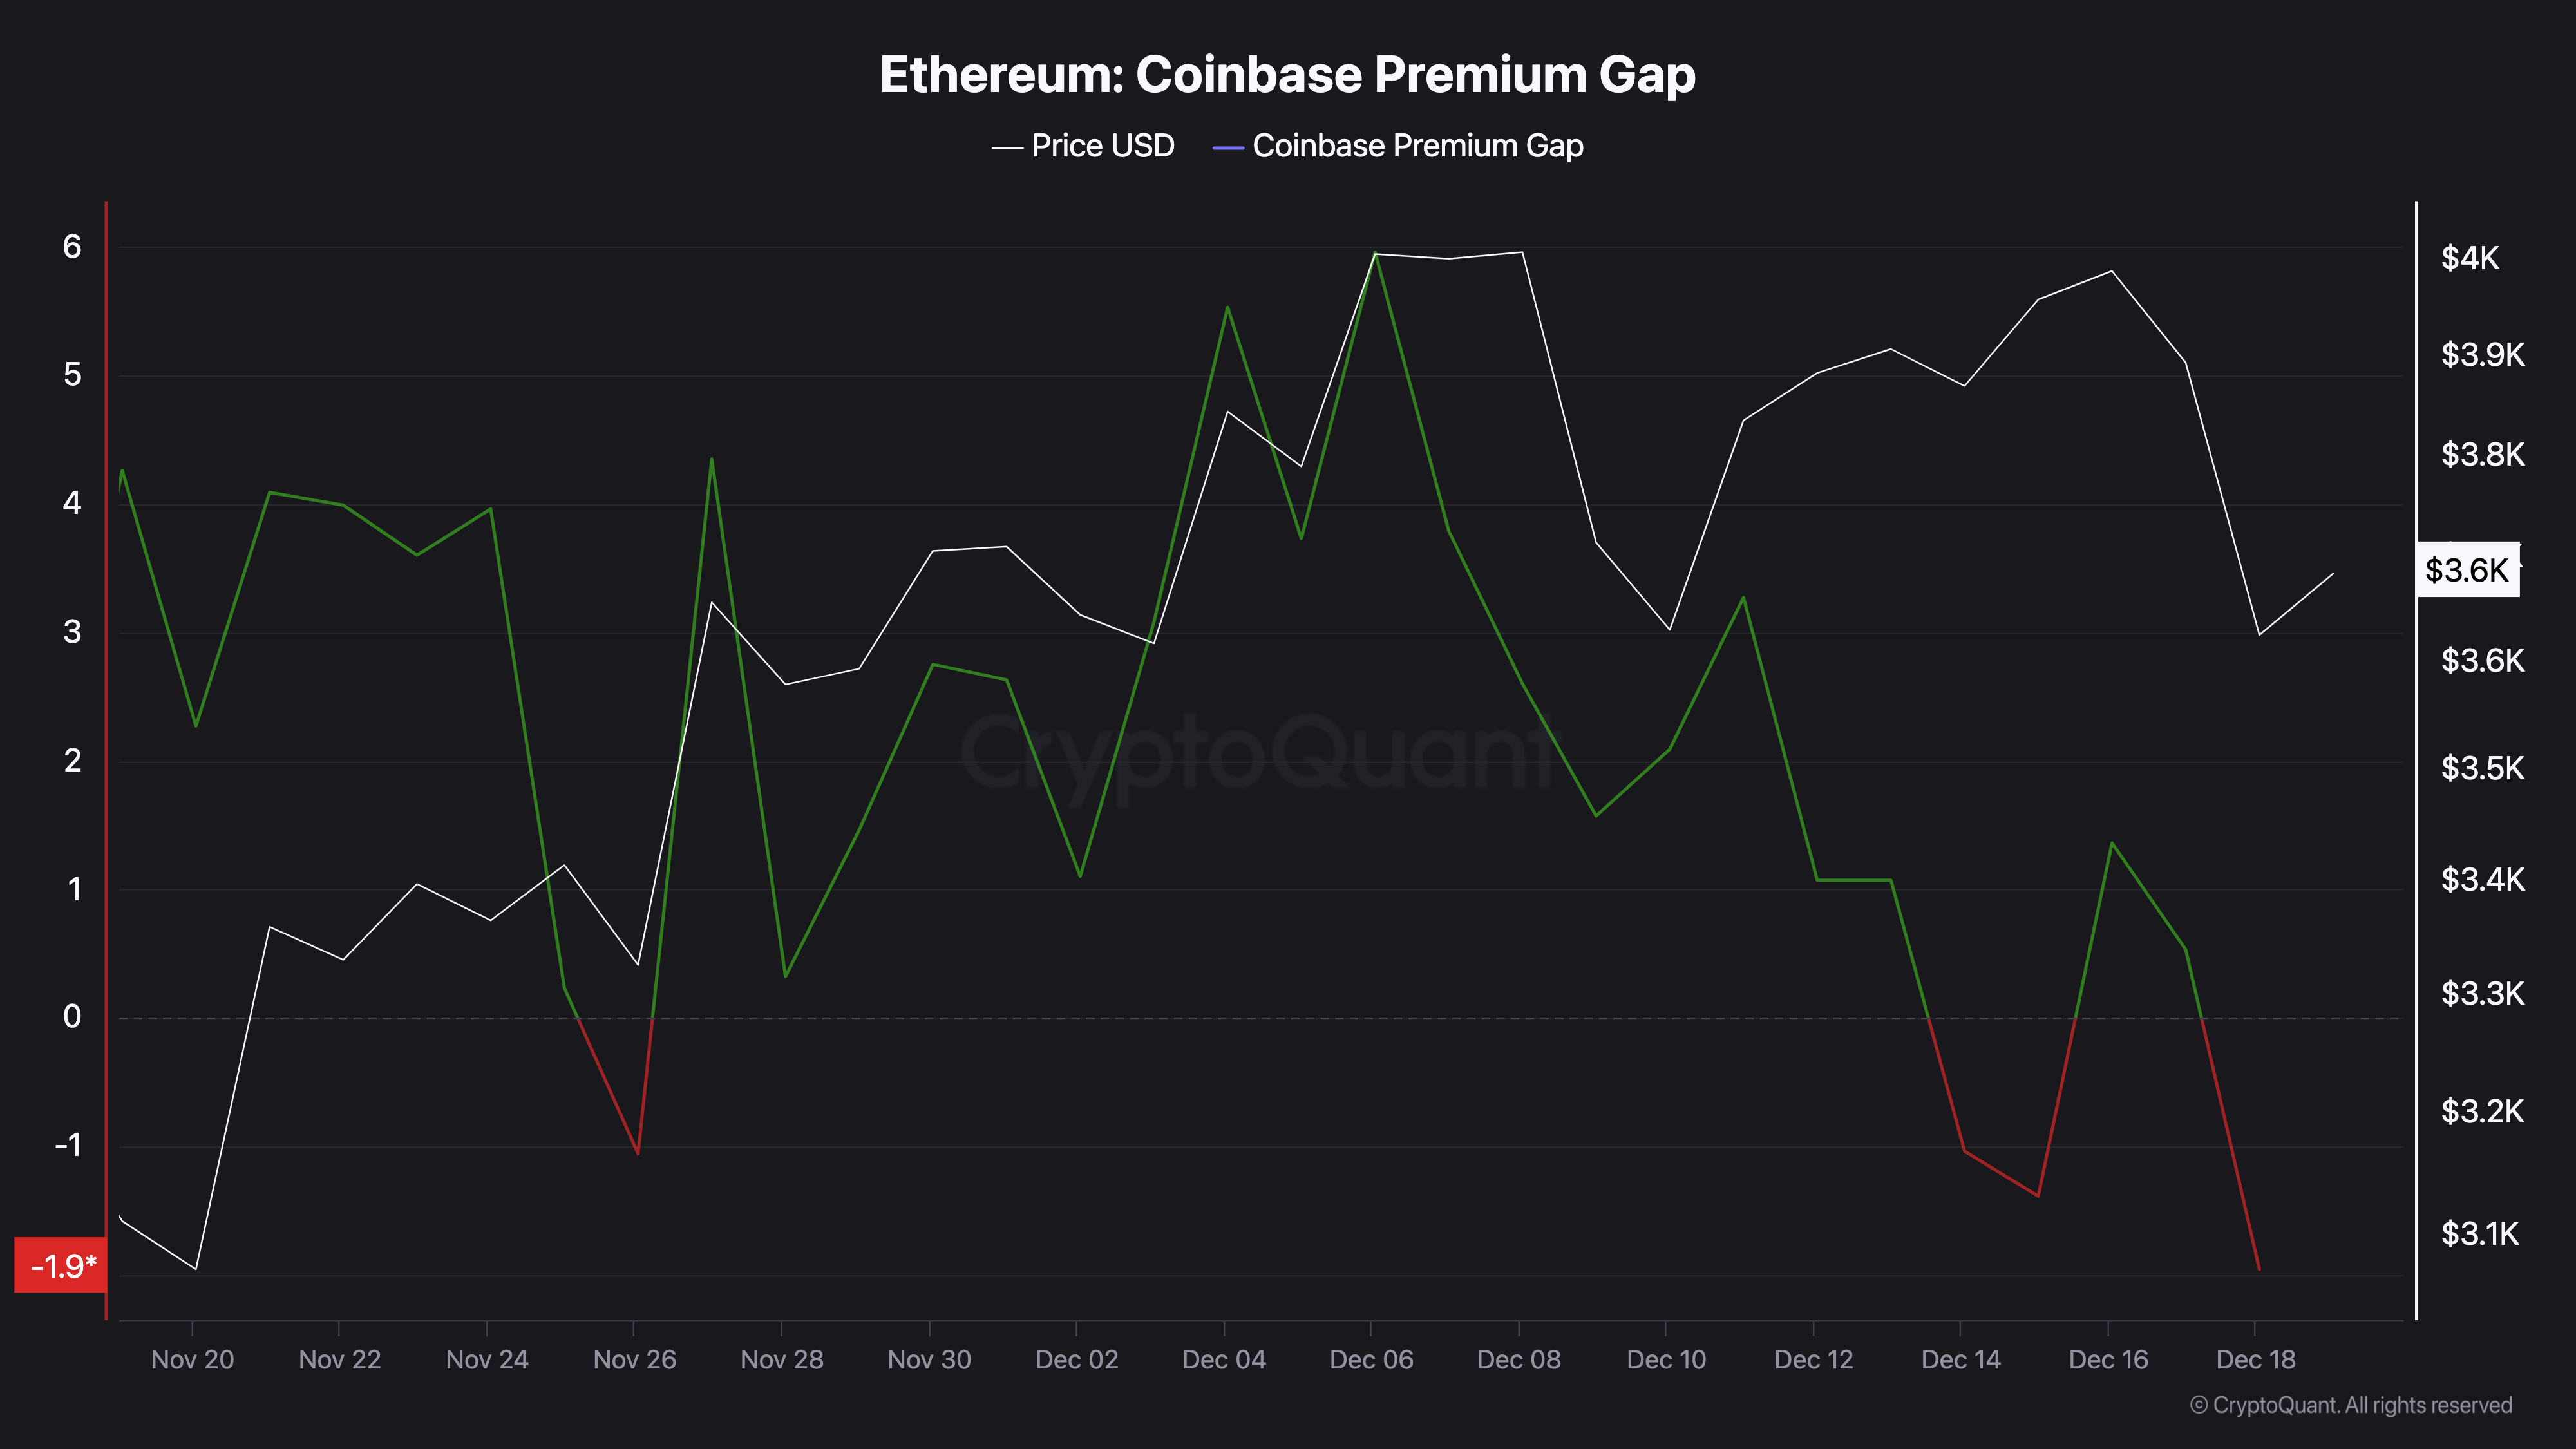
In addition to the above indicator, the Coinbase premium gap is another metric supporting further downside for ETH. This metric measures the price difference between the Coinbase ETH/USD pair and the same pair on Binance.
When there is a significant premium price on Coinbase compared to Binance, it indicates notable buying activity among US-based investors. This buying pressure can originate from increased local demand and favors price appreciation.

Conversely, when Coinbase's price lags behind Binance, it may suggest waning demand in the US market or strong selling pressure from institutions or retail investors.
The chart above shows the premium gap has fallen to -1.96, indicating substantial selling pressure on ETH following the Fed rate cut.
ETH Price Prediction: Reclaiming All-Time Highs May Be Difficult for Now
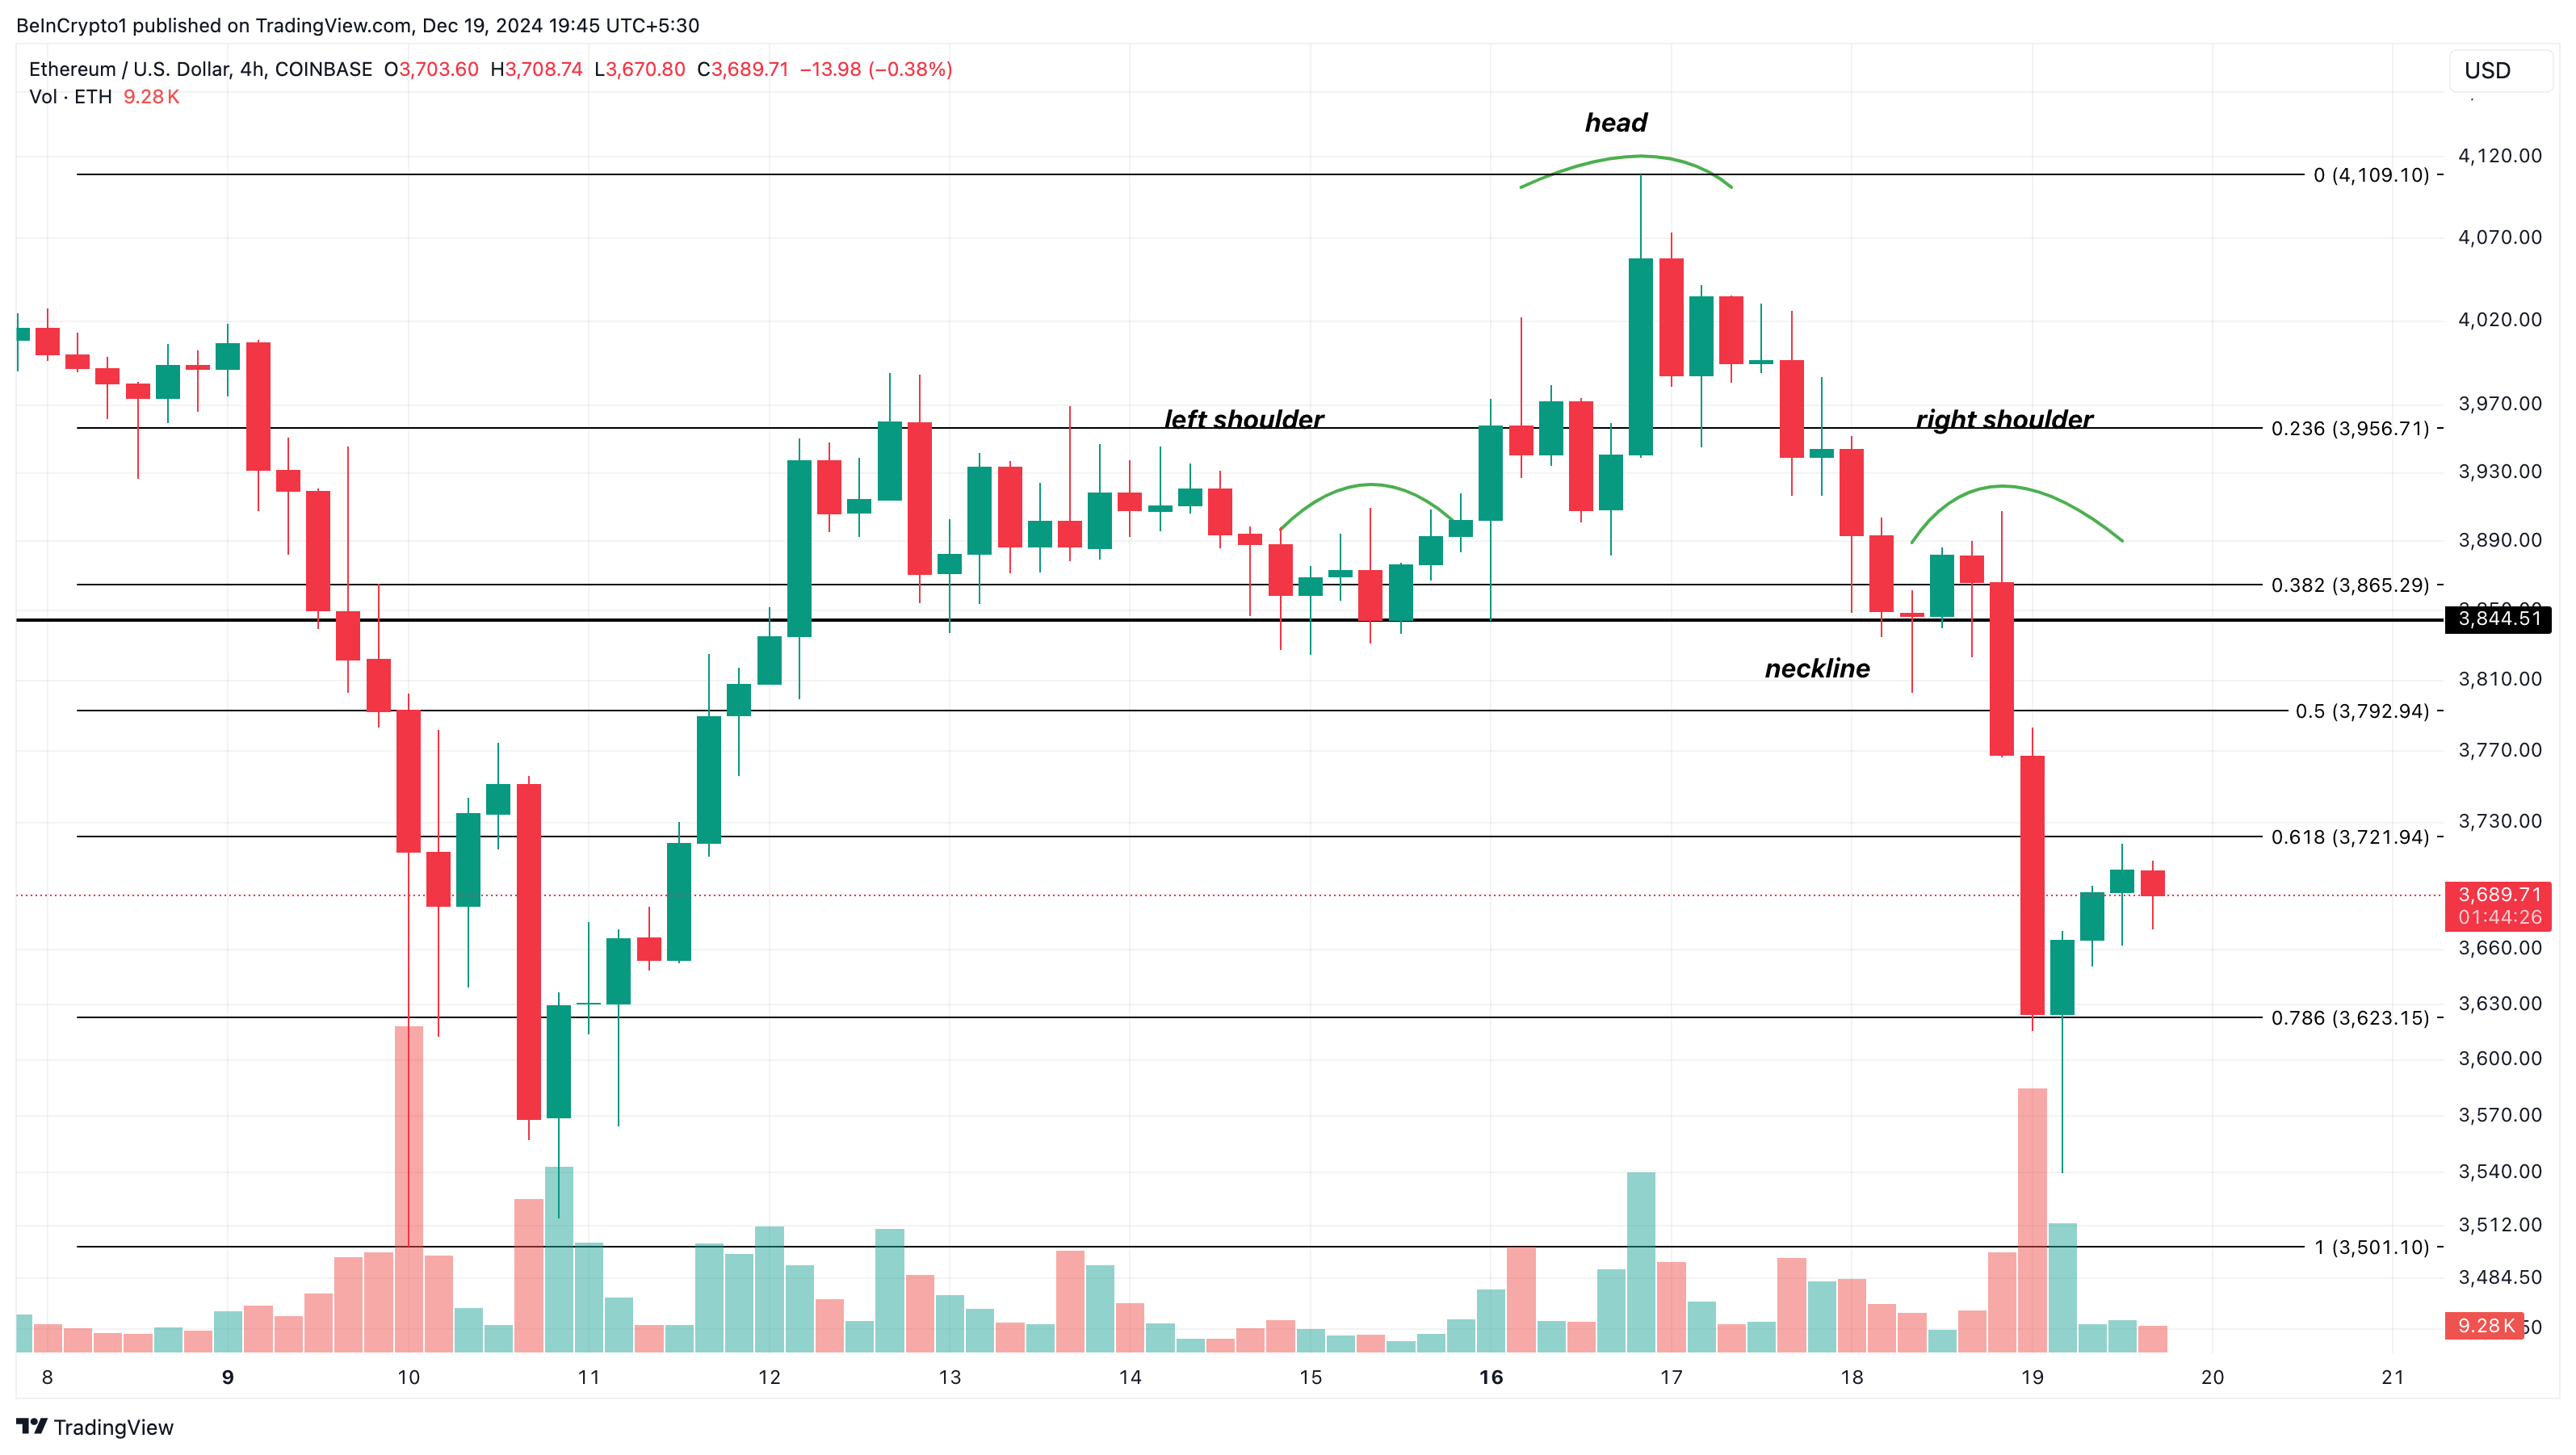
In addition to Ethereum's reaction to the Fed rate cut, it has also experienced a decline due to the formation of a head and shoulders pattern on the 4-hour chart. The head and shoulders pattern is a classic technical analysis chart formation that indicates a potential trend reversal from bullish to bearish.
This pattern is characterized by a price rise (left shoulder), a peak (head), and a decline (right shoulder). If the price falls below the neckline after the right shoulder forms, it signals a bearish trend reversal.
However, the reliability of the pattern depends on the trading volume. As can be seen below, the trading volume around ETH has decreased, and the price has fallen below the neckline.

If this condition persists, the ETH price could decline to $3,501. However, if the trading volume increases and buying pressure also increases, this prediction may not materialize. Instead, Ethereum's price could rise to $4,109 and eventually reach $4,500.


