The BTT, the native token of the BitTorrent platform, has risen by 4% in the market over the past 24 hours, showing the biggest upward trend.
However, while this upward trend may reflect renewed interest in the token and a change in market sentiment, the BTT price chart suggests the possibility of a short-term correction.
BTT lacks momentum to extend the rally
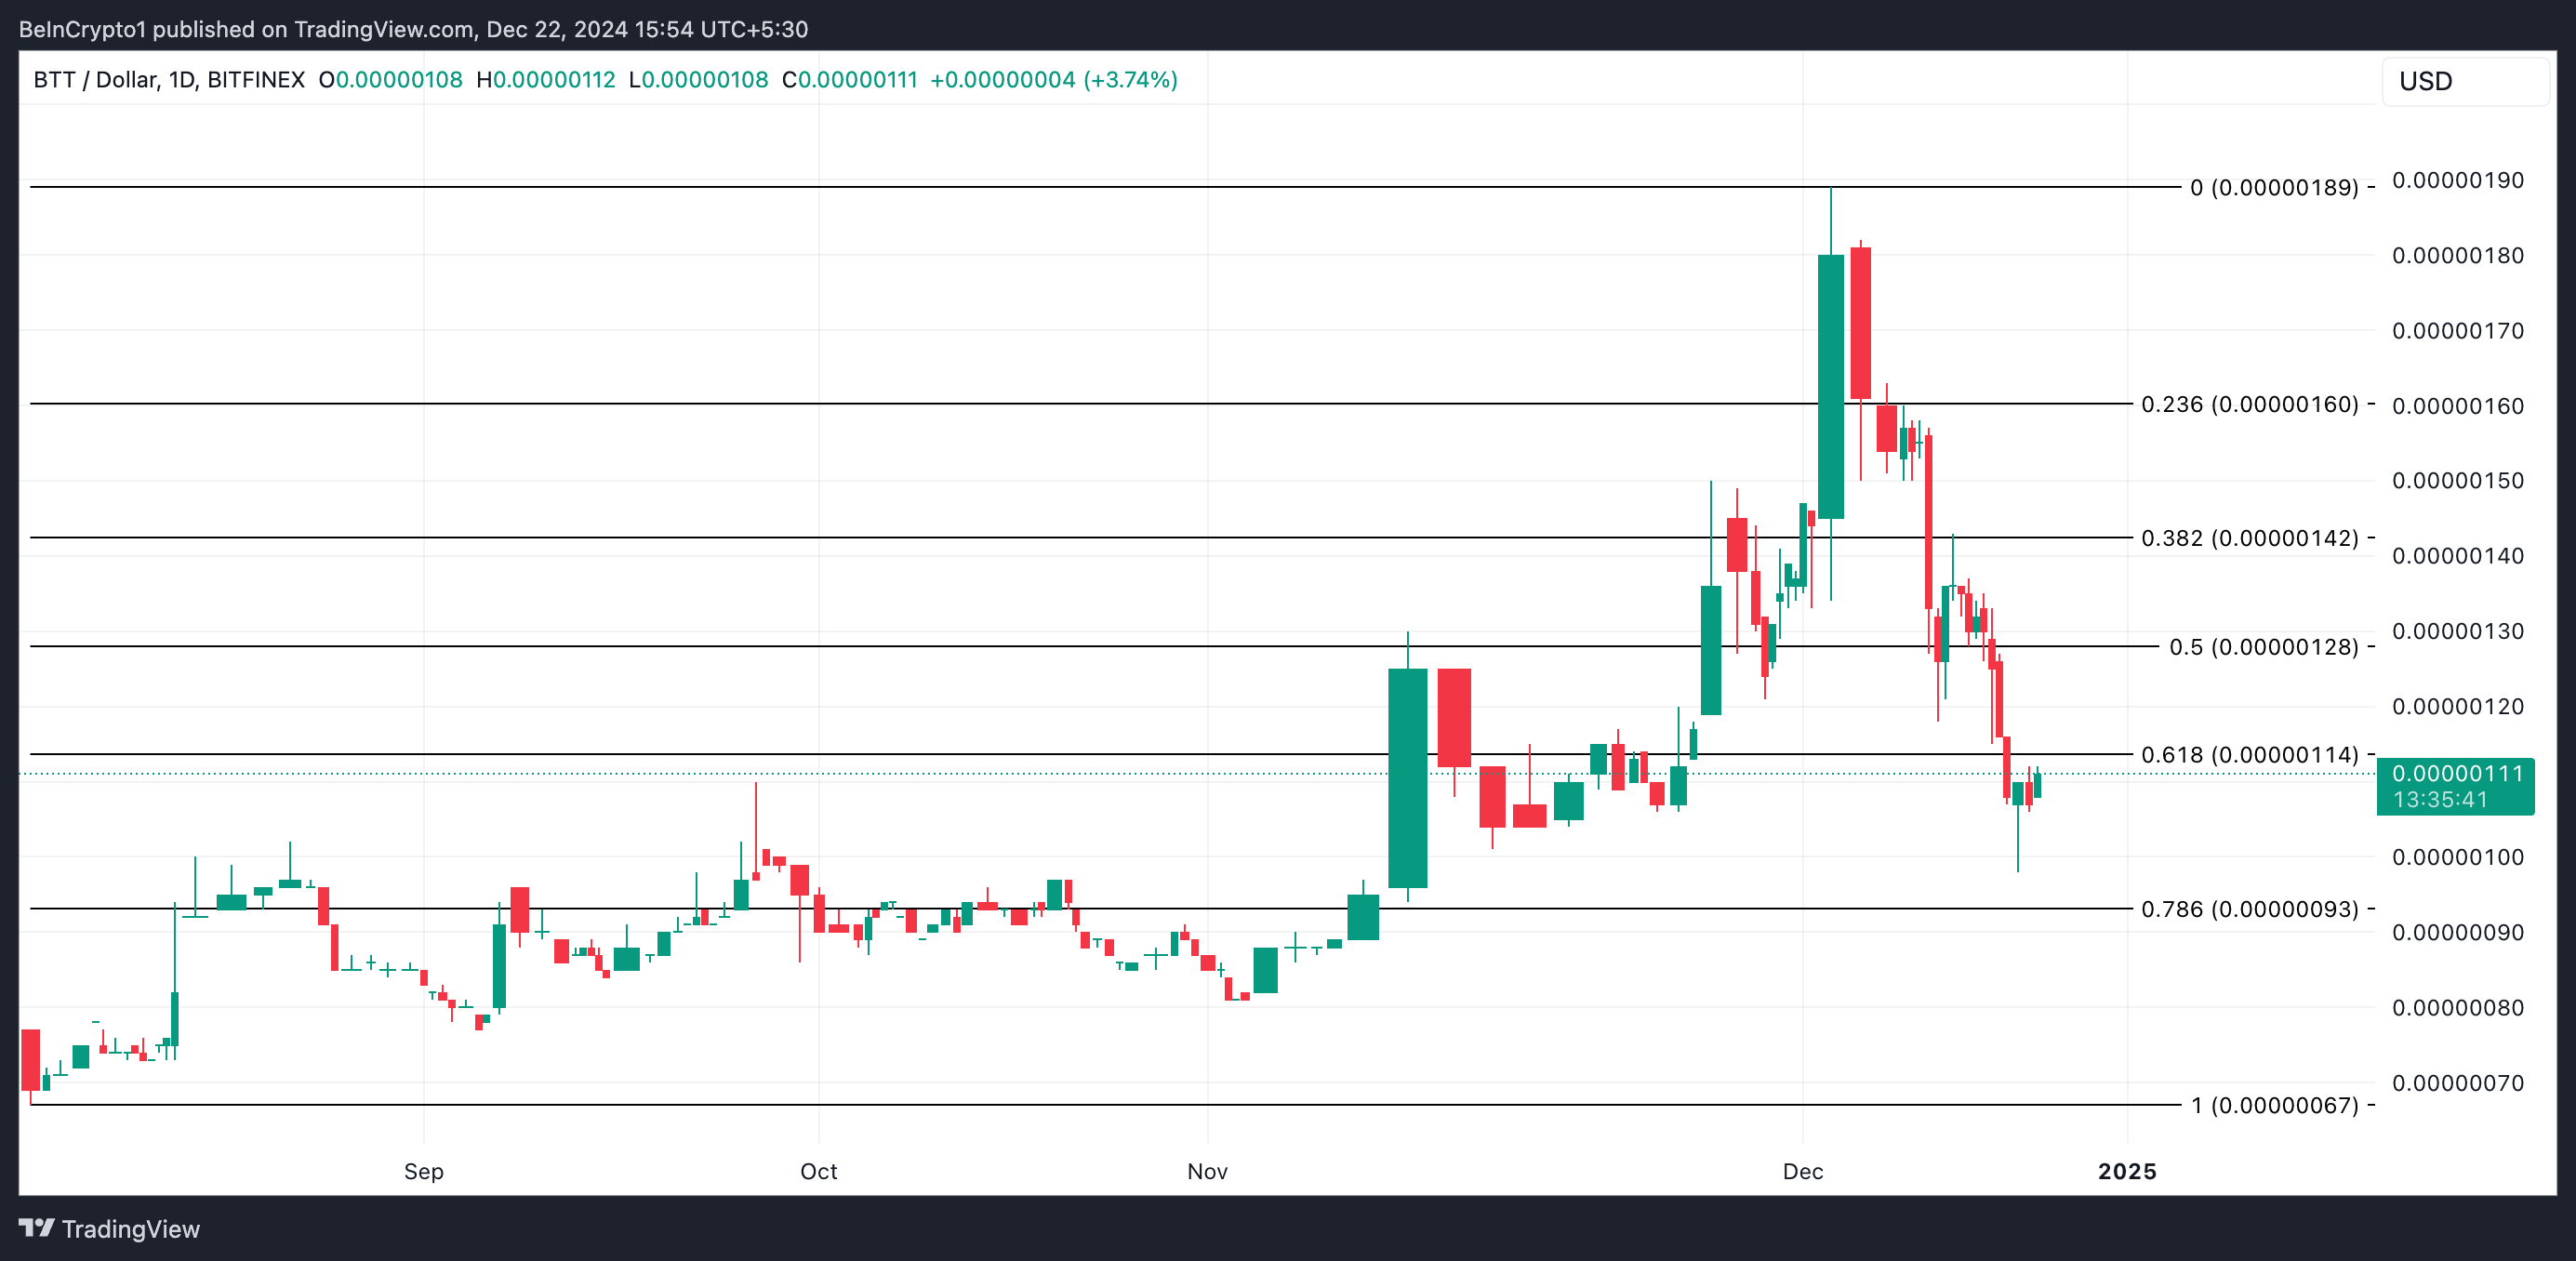
The price of BTT has risen by 4% over the past 24 hours. Currently, this altcoin is trading at $0.00000111, and trading volume is increasing.
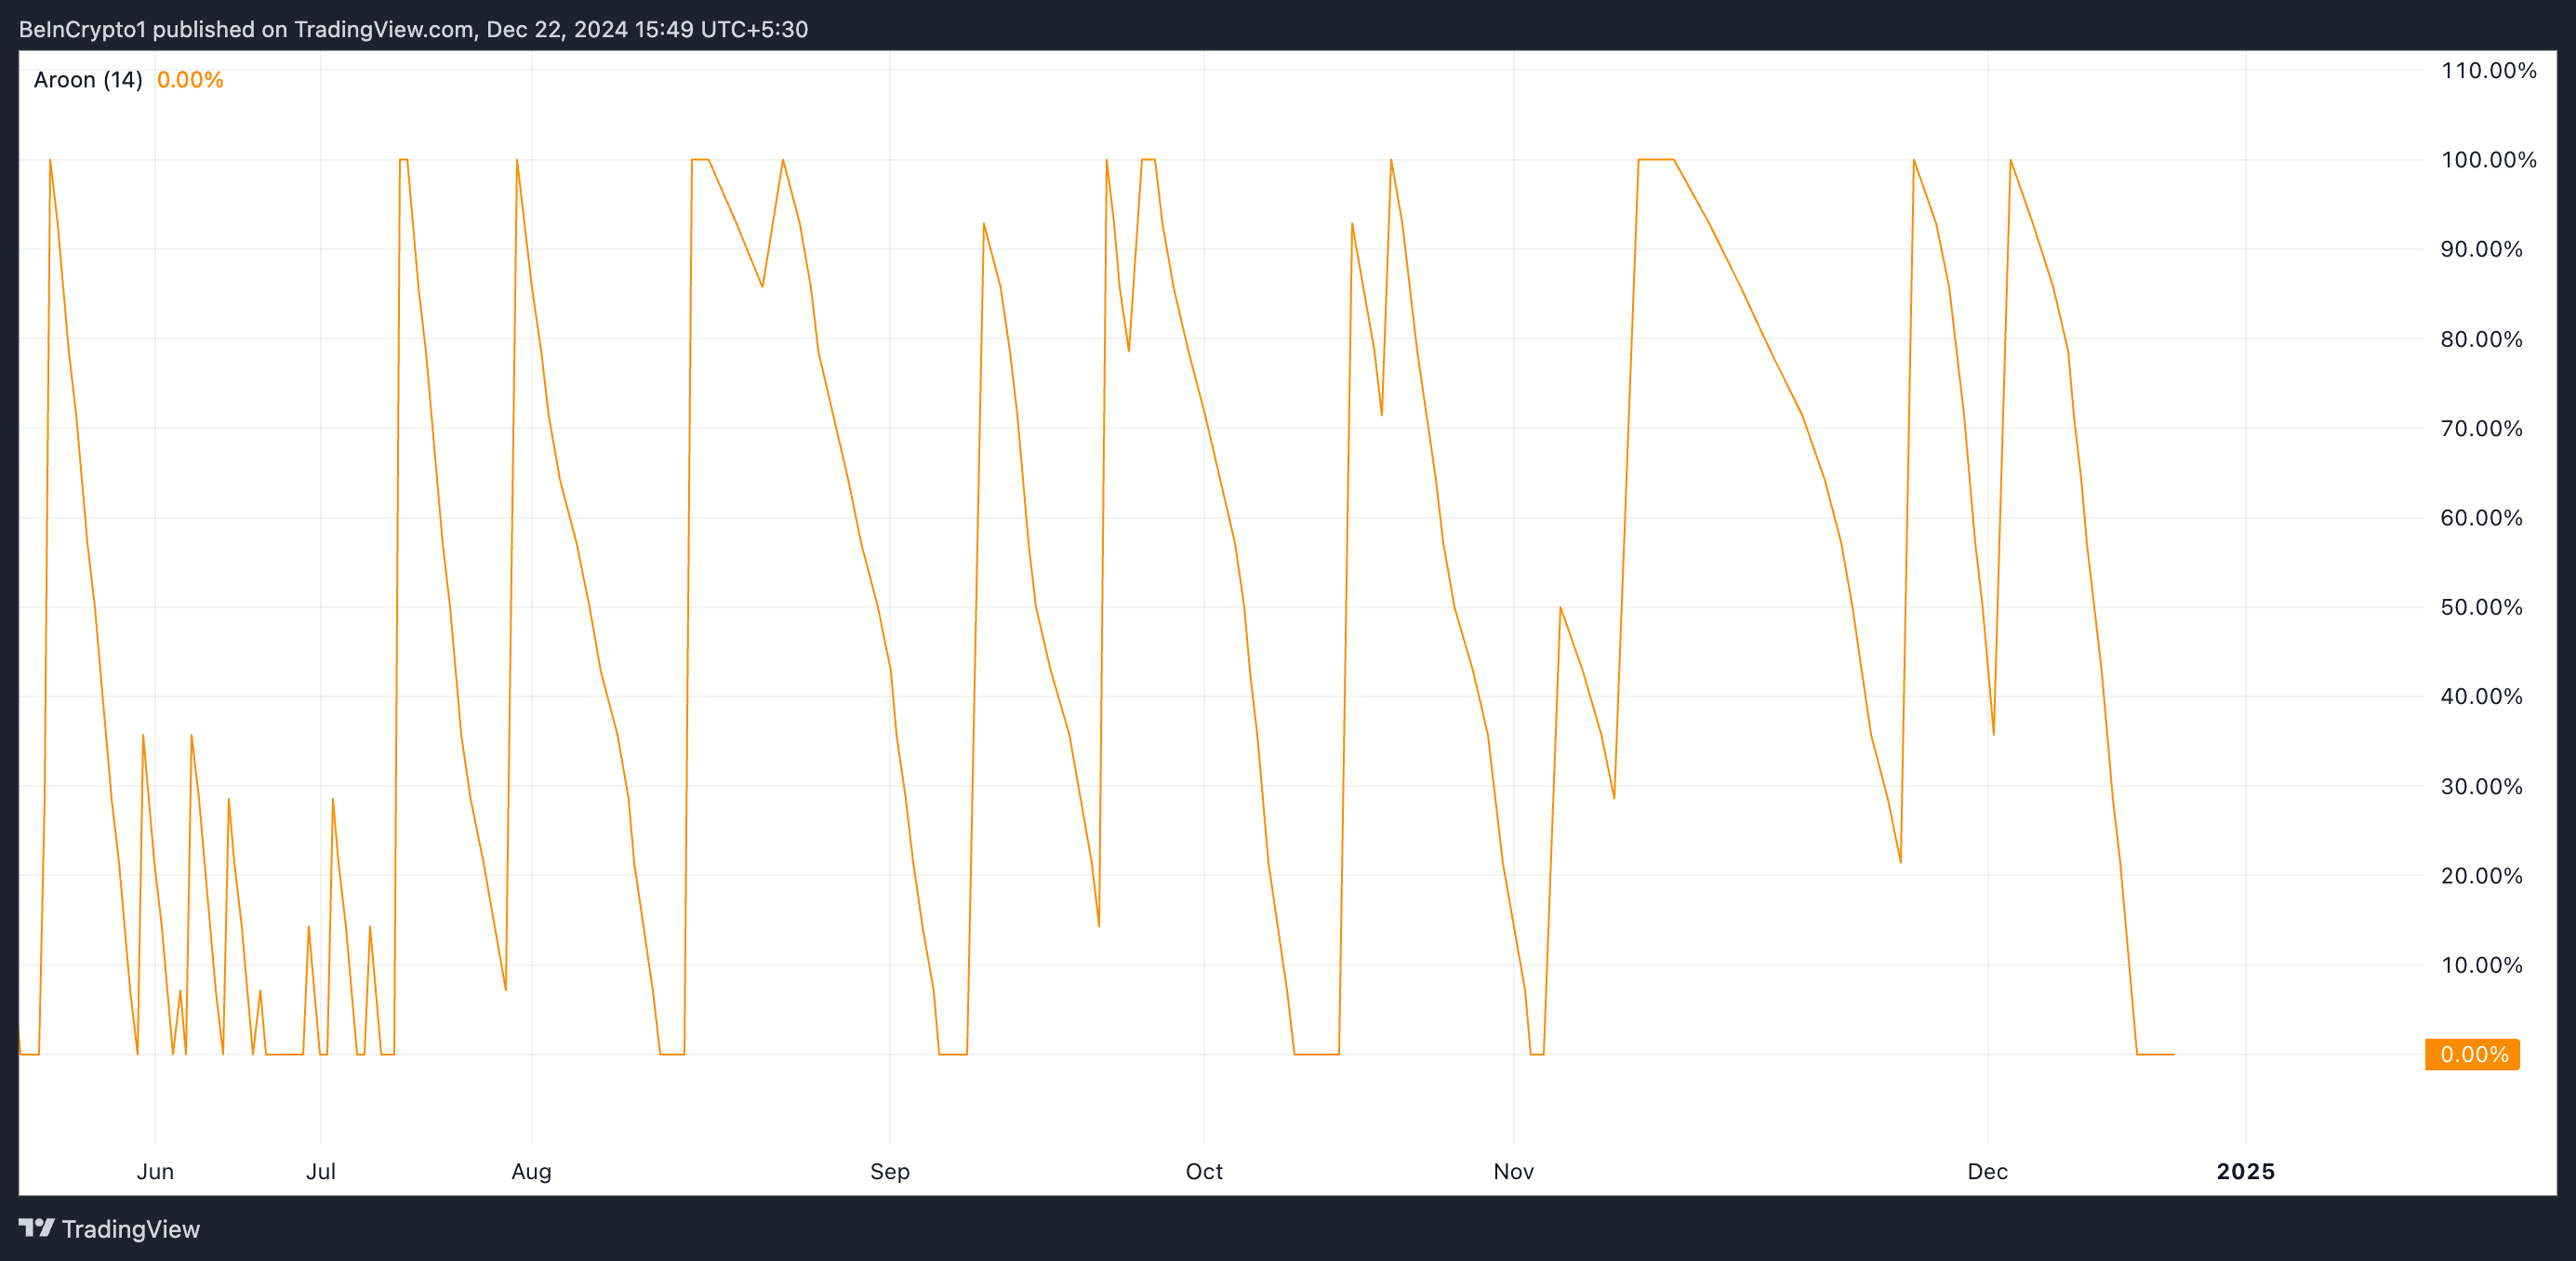
However, despite the price increase, the BTT's Aroon Up line is currently at 0%, indicating that the uptrend lacks strong momentum. The Aroon indicator of an asset measures the strength and direction of a trend by evaluating the time elapsed since the asset's highest and lowest points over a specific period.

When an asset's price is rising, and the Aroon Up line is at 0%, it indicates a lack of recent strong upward momentum. The Aroon Up indicator measures the time when the asset has recorded a new high within a specific period. A 0% value shows that the asset's price has not reached a new high during that period.
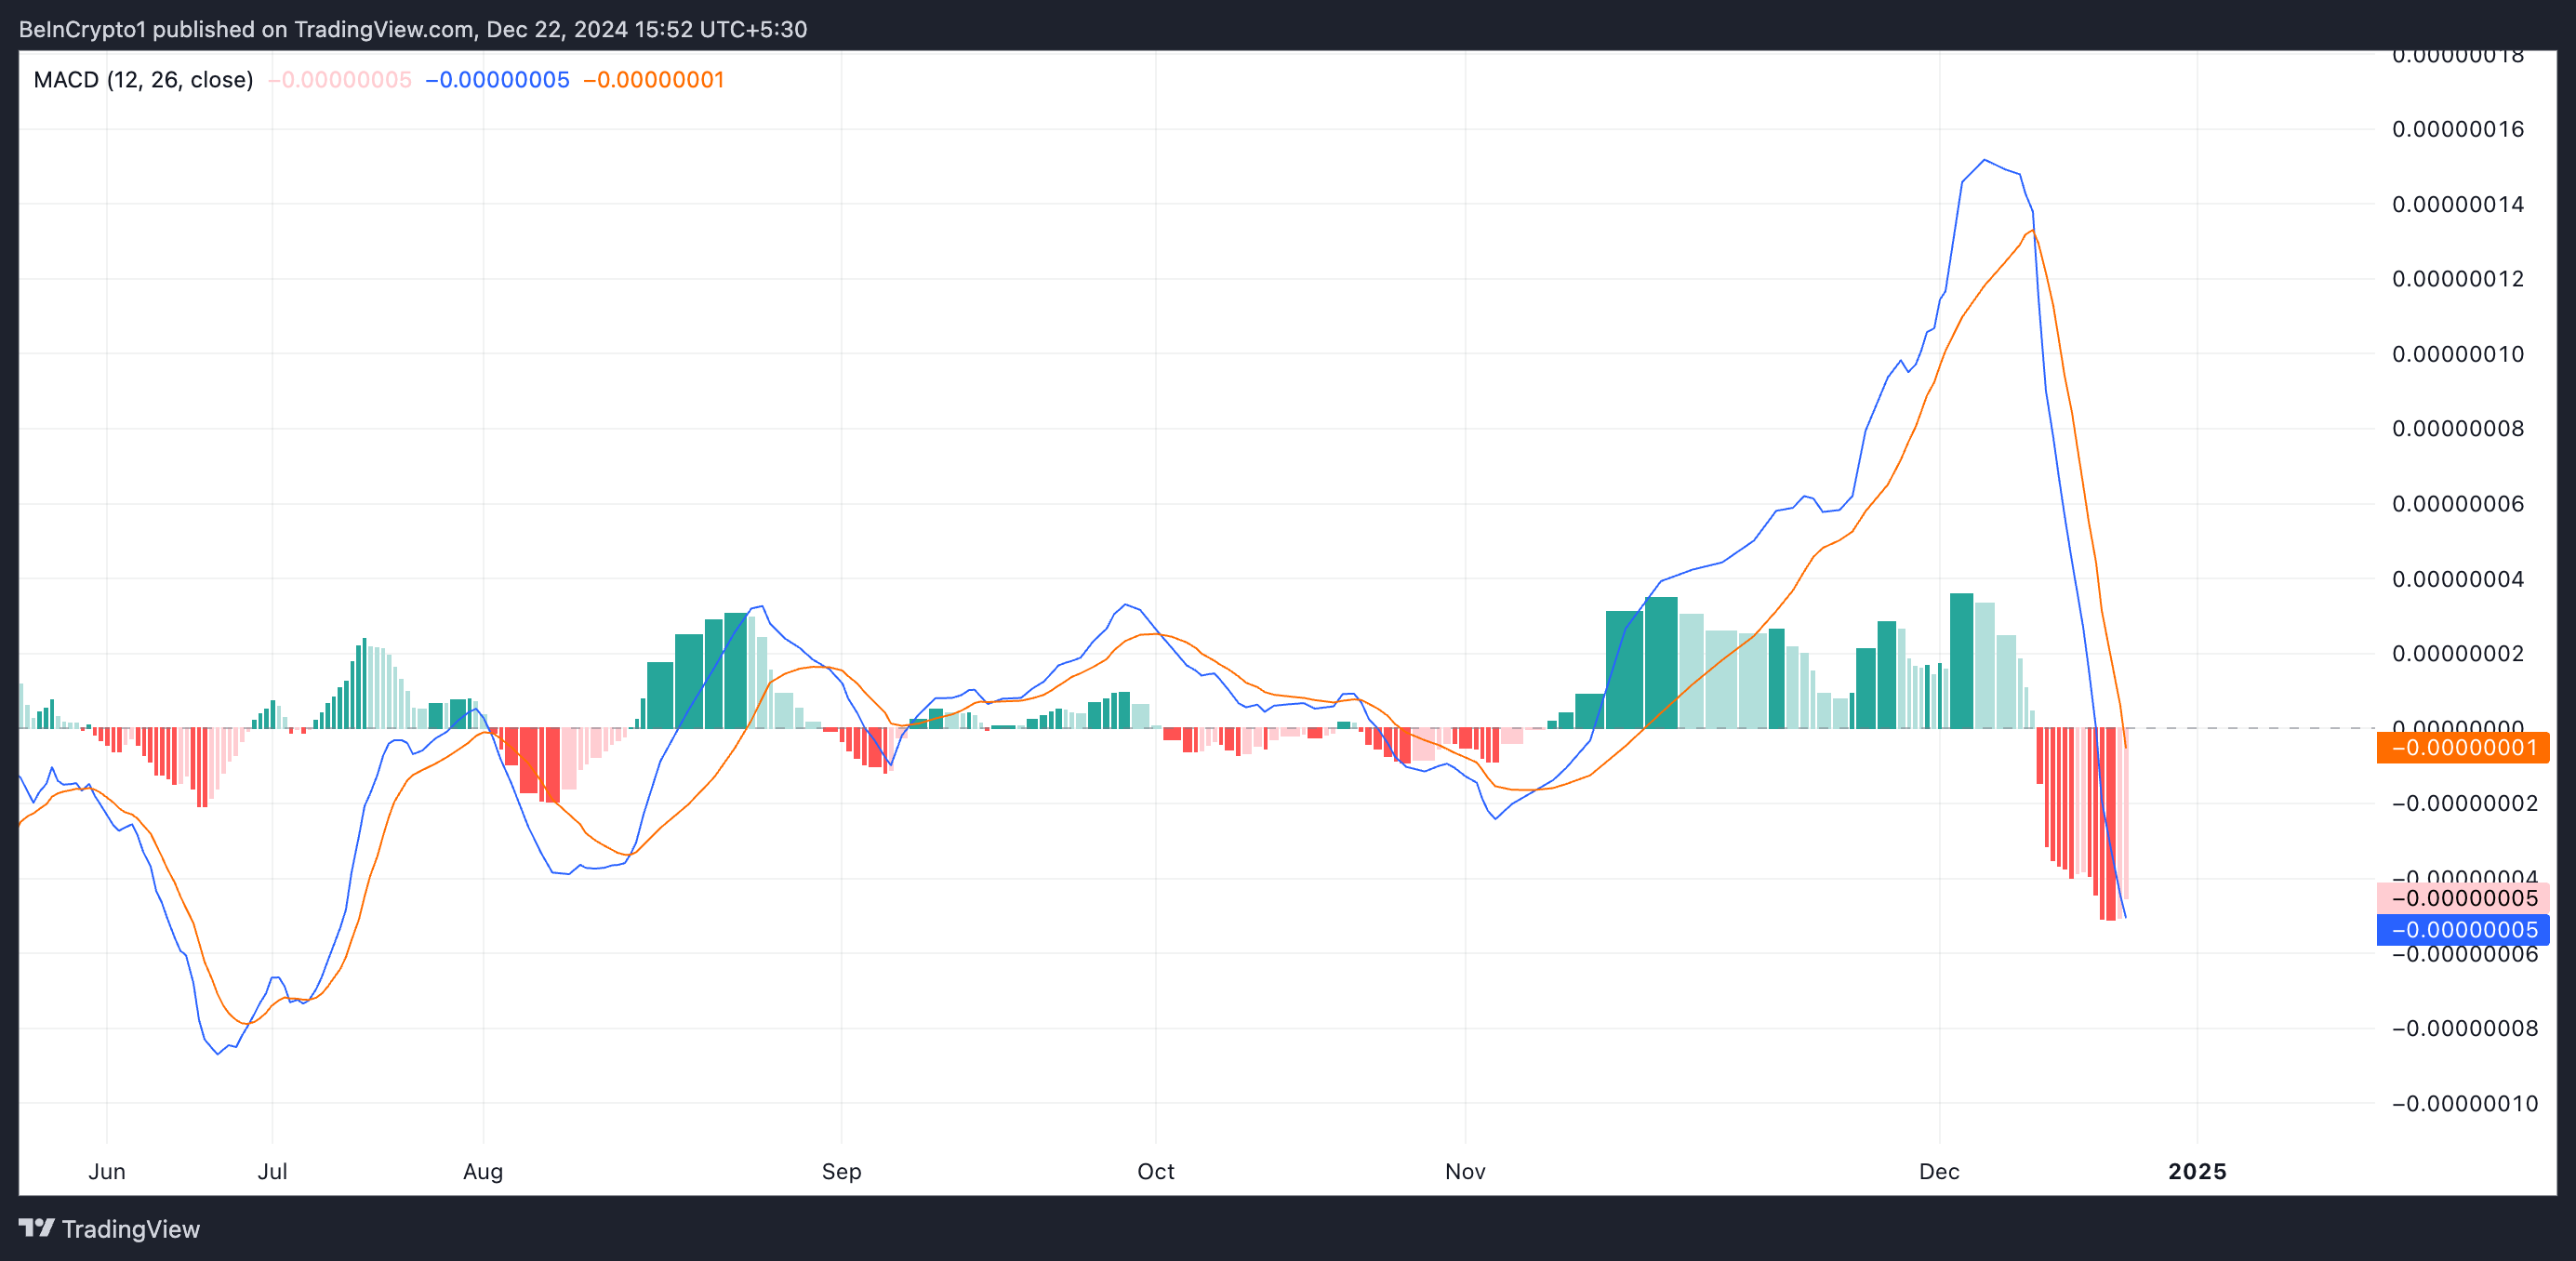
The BTT's Moving Average Convergence Divergence (MACD) indicator also supports this bearish outlook. Currently, the MACD line (blue) of this token is significantly below the signal line (orange).

The MACD indicator of an asset helps identify the trend and momentum of price movements. It captures potential buy or sell signals through the crossover of the MACD and signal lines. In the case of BTT, the MACD line being below the signal line suggests the price may decline. Traders often view this crossover as a potential sell signal.
BTT price prediction, key support level... Further upside possible?
According to the daily chart, BTT is currently trading above a crucial support level of $0.00000093. If the selling pressure intensifies, the token's price may test this level. If the selling pressure overwhelms the buying pressure, BTT could extend its decline and plummet to $0.00000067, which was its last low reached in August.

On the other hand, if the buying pressure strengthens, BTT could continue its upward trend and break through the $0.00000114 resistance level. If it successfully clears this level, the token could recover to $0.00000128.


