The price of Cardano (ADA) continues to show volatility. Despite a decline of over 18% in the past 7 days, it remains one of the top 10 cryptocurrencies by market capitalization. The recent downtrend has been marked by bearish technical indicators, including a death cross on the EMA lines and a weak position within the Ichimoku Cloud.
However, some signs suggest that the bearish momentum may be waning, as ADA's ADX peaked earlier this week and has since declined slightly.
ADA Downtrend Continues... Will Prices Fall Further?
ADA's Average Directional Index (ADX) currently stands at 27.5. It rose above 20 on December 19th but has since declined slightly from above 30 over the past few days. These fluctuations in ADX reflect changes in the intensity of Cardano's ongoing downtrend.
While an ADX above 25 generally indicates a strong trend, the slight decline suggests the bearish momentum may be losing some steam. However, it remains significant.

ADX measures the strength of a trend on a scale of 0 to 100. Readings above 25 indicate a strong trend, while 20 or below suggest a weak or absent trend. Cardano's ADX at 27.5, slightly declining, indicates that the bearish momentum is still present but may be weakening in strength.
In the short term, this could mean that selling pressure is easing, allowing the ADA price to find a bottom or attempt a modest recovery. This will depend on whether buying activity increases enough to offset the bearish trend.
Ichimoku Cloud Signals Negative Sentiment
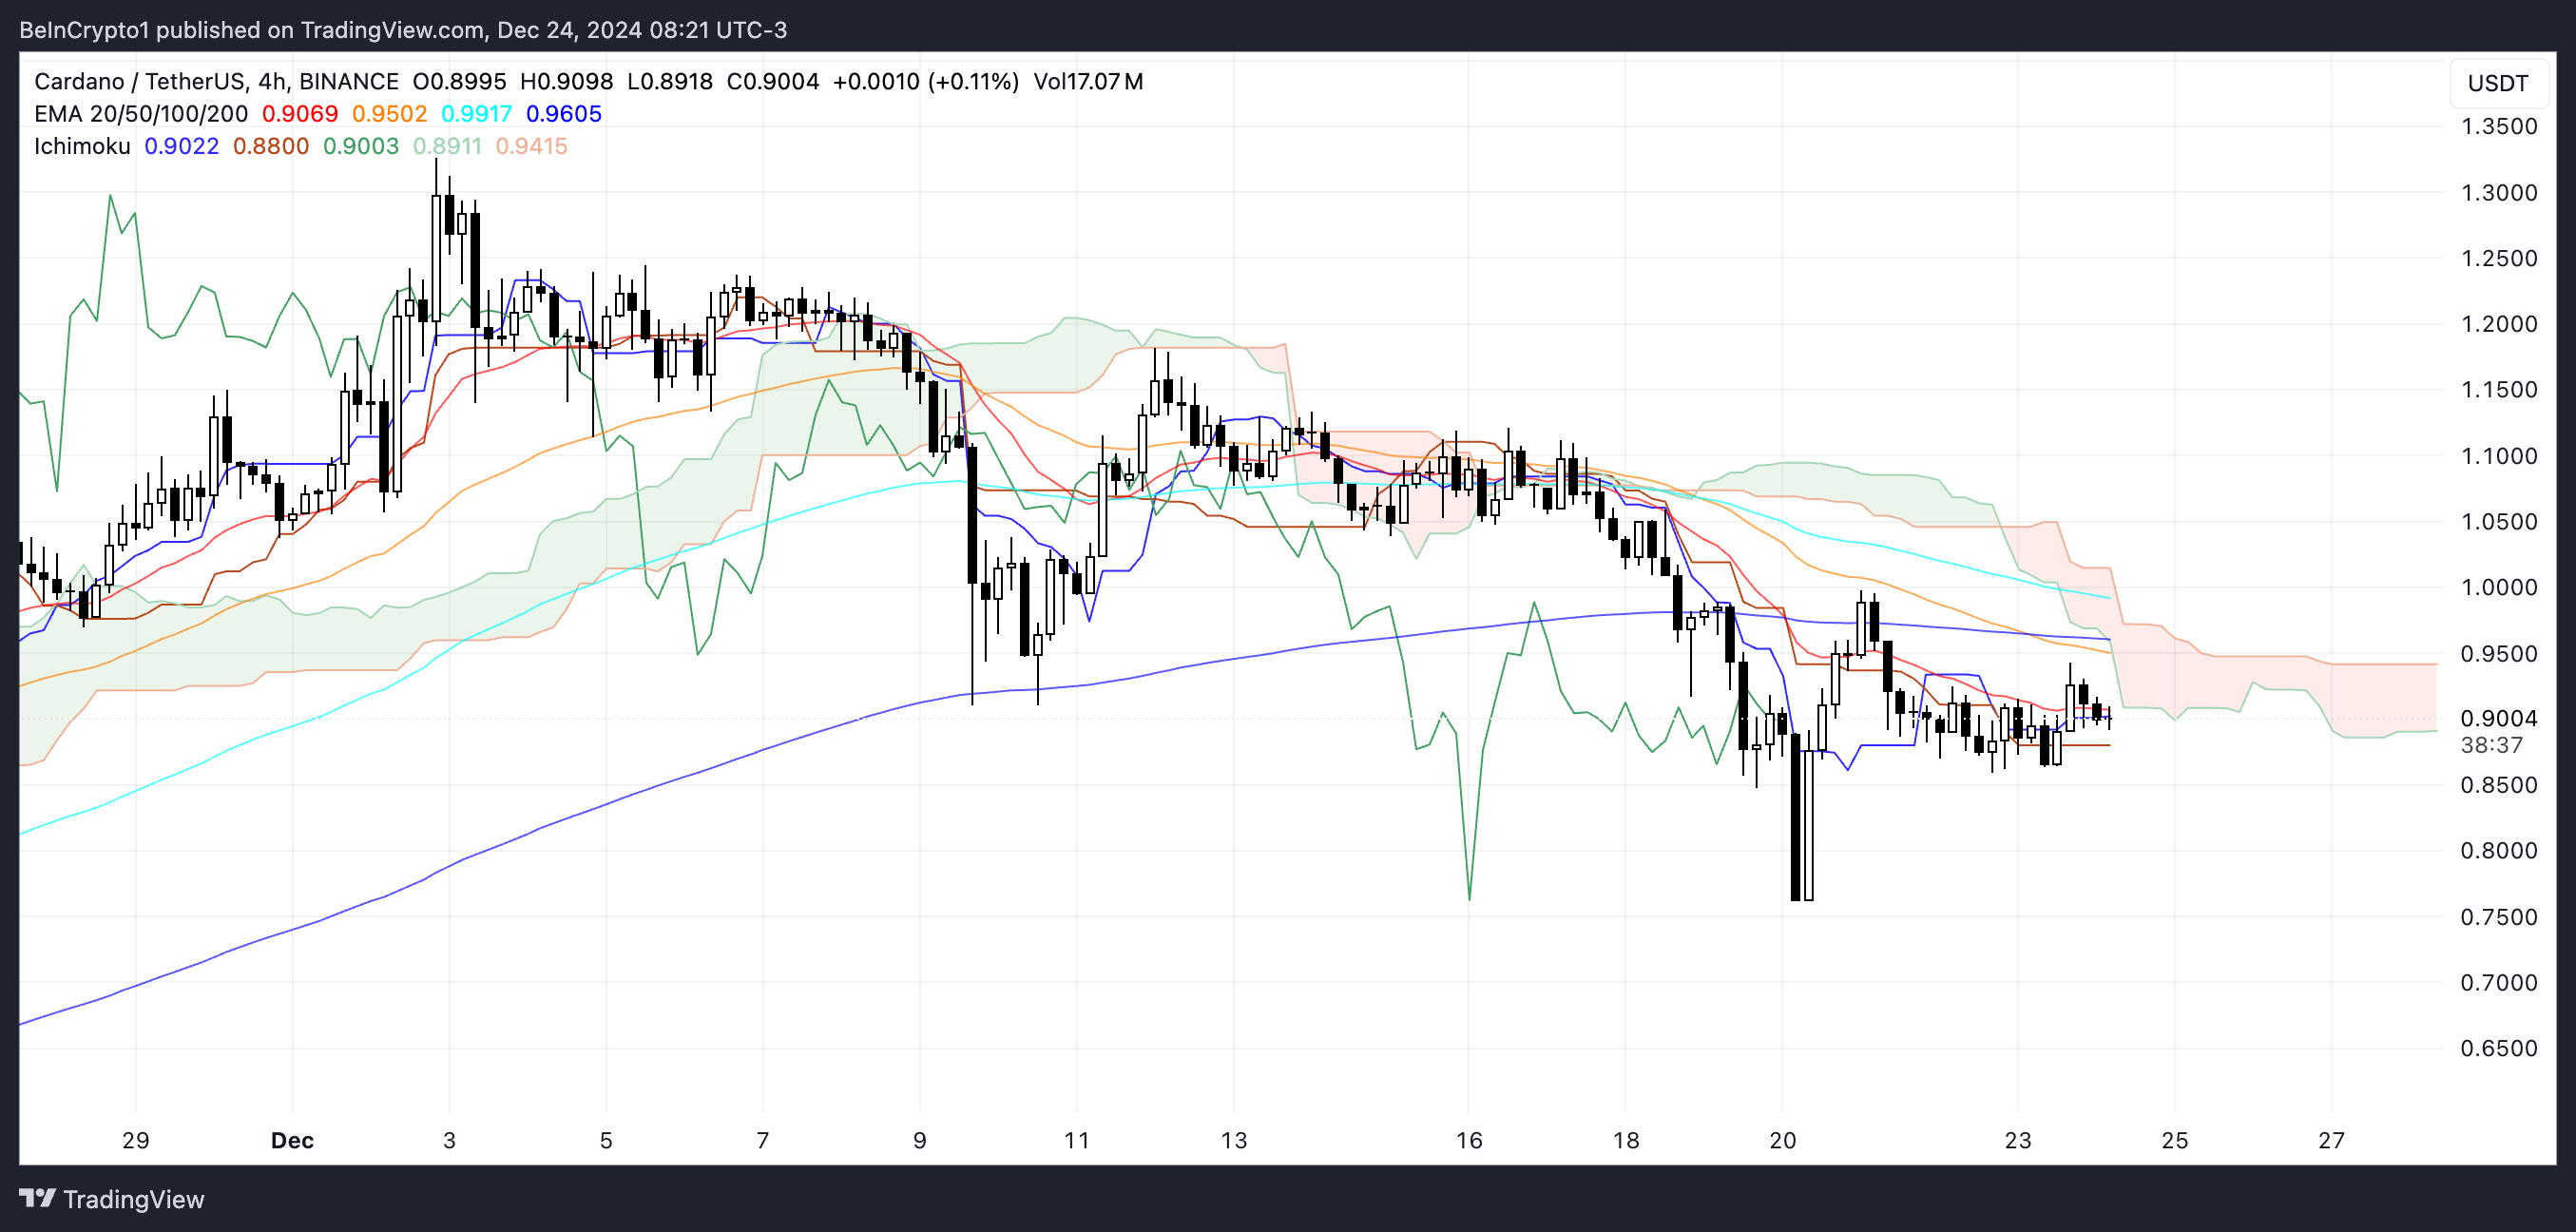
Cardano's Ichimoku Cloud chart displays a bearish trend. The price is positioned below the cloud (red and green shaded areas), indicating the downward momentum continues.
The blue conversion line (Tenkan-sen) remains below the red base line (Kijun-sen), confirming the bearish sentiment prevailing in the market. However, the narrowing gap between these lines suggests the bearish momentum could potentially slow down as the price stabilizes.

The lagging span (green line) is positioned below both the price and the cloud, emphasizing the persistence of the bearish trend. Additionally, the future cloud (red) suggests ongoing bearish pressure, as the leading span A (green edge) remains below the leading span B (red edge).
These conditions imply that ADA's setup is tilted bearish, and there are limited signs of an immediate trend reversal unless further adjustments occur.
ADA Price Prediction: Holding $0.78 is Crucial
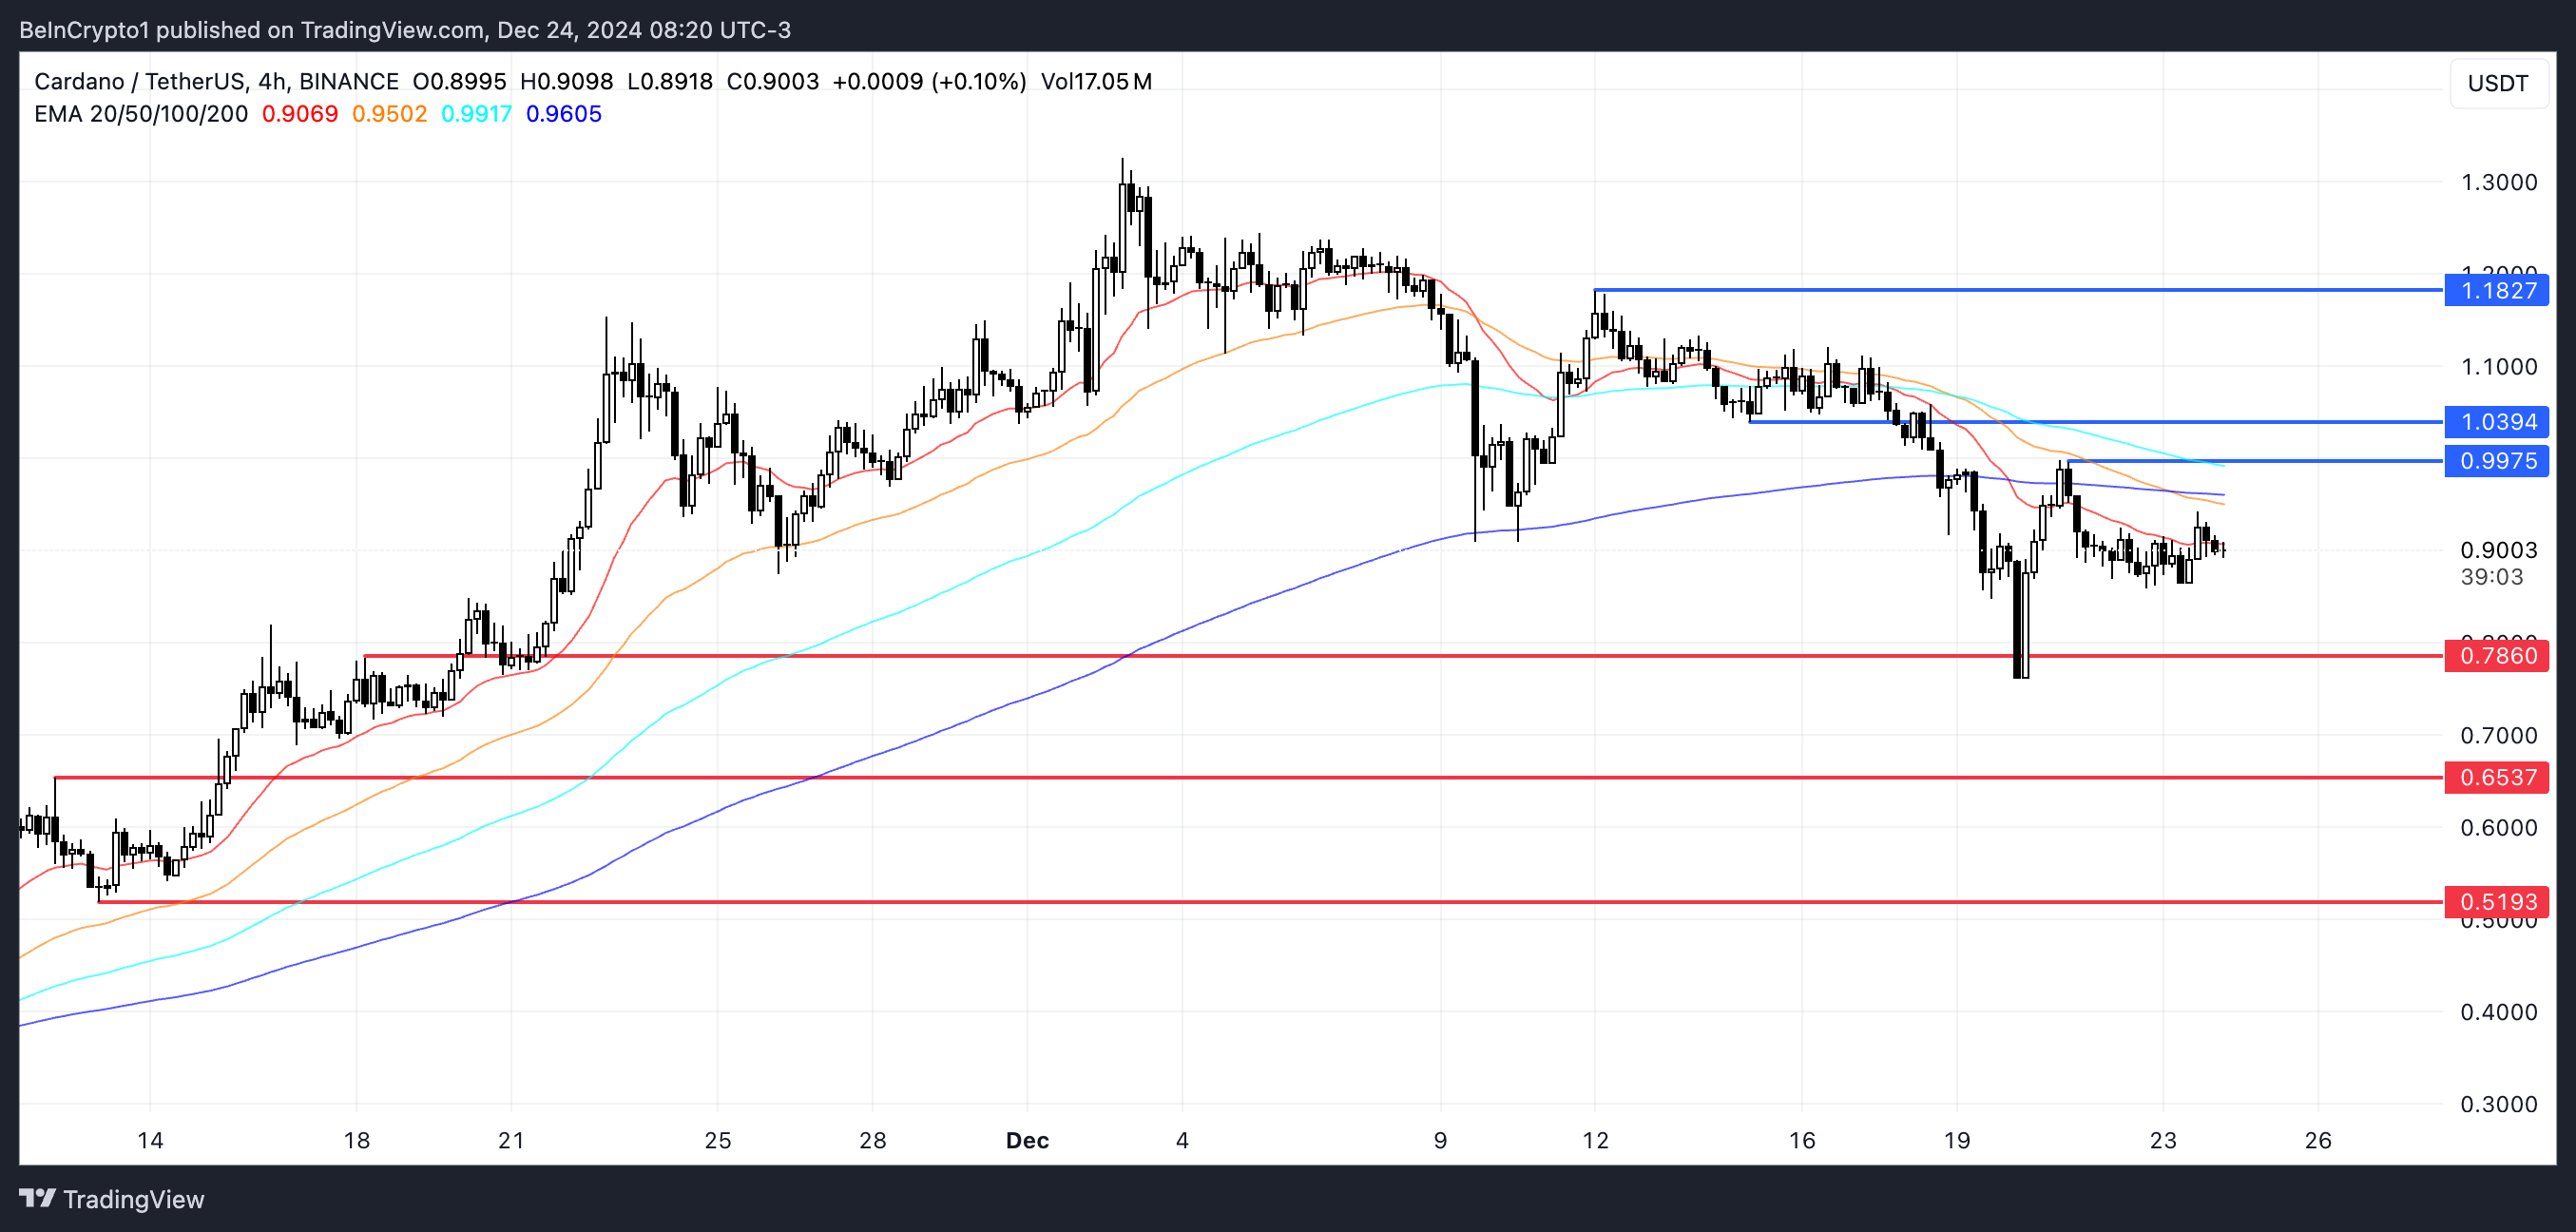
ADA's EMA (Exponential Moving Average) lines formed a death cross on December 20th. The short-term EMA crossed below the long-term EMA, a typical bearish signal indicating persistent downward momentum. If this decline continues, the Cardano price could face further downside and test the $0.78 support level.
If the bearish pressure persists and $0.78 is not maintained, the ADA price could drop to $0.65 or even as low as $0.519. This would represent a correction of around 42% from the current levels.

However, if the trend reverses and bullish momentum forms, the ADA price could recover to higher levels, starting with the resistance at $0.99 and $1.039. Breaking above these levels could signal stronger buying interest and pave the way for a rally towards $1.18, representing an upside potential of around 31% from the current levels.


